Camden Town ward profile
A summary of Camden Town ward in the Central neighbourhood of Camden
Abstract
The population of Camden is among the most diverse in London and health outcomes vary significantly across its different neighbourhoods. Understanding the impact of environment on resident health is crucial for informed decision-making and the development of interventions. This area profile focuses on the ward of Camden Town.
Introduction
This is a summary profile of Camden Town ward in the Central neighbourhood of Camden. It includes data on the neighbourhood’s demography, levels of deprivation, and key health indicators such as life expectancy and prevalence of long-term conditions.
Demography
Population
The London Borough of Camden has approximately 219,900 residents according to the latest population projections. Of this total, 6,800 reside in Camden Town, making it the ward with the lowest number of residents. There are 3,500 female residents and 3,300 male residents in Camden Town.
Age
Children and young people (0-24 years old) make up 30.79% of the population of Camden Town which is less than Camden overall (30.85%). Additionally, the percentage of older adults aged 65+ years is 8.66% compared to 12.02%.
Ethnicity
The following data uses the Office of National Statistics (ONS) ethnicity classifications. When looking at the broader ethnicities (e.g. ‘Asian’ instead of ‘Asian: Indian’), the most frequently reported ethnicity in Camden Town is White (57.46%), which is lower than Camden (59.52%). Additionally, this ward exhibits higher proportions of residents identifying as Black, and Mixed.
Looking at the specific subgroups of ethnicity, Camden Town shows higher proportions of residents identifying as Bangladeshi, African, Irish, Other Mixed or Multiple ethnic groups, Arab, Caribbean, White and Black Caribbean, White and Black African, Other Black, Pakistani, Roma, and Gypsy or Irish Traveller compared to the borough.
Wider Determinants of Health
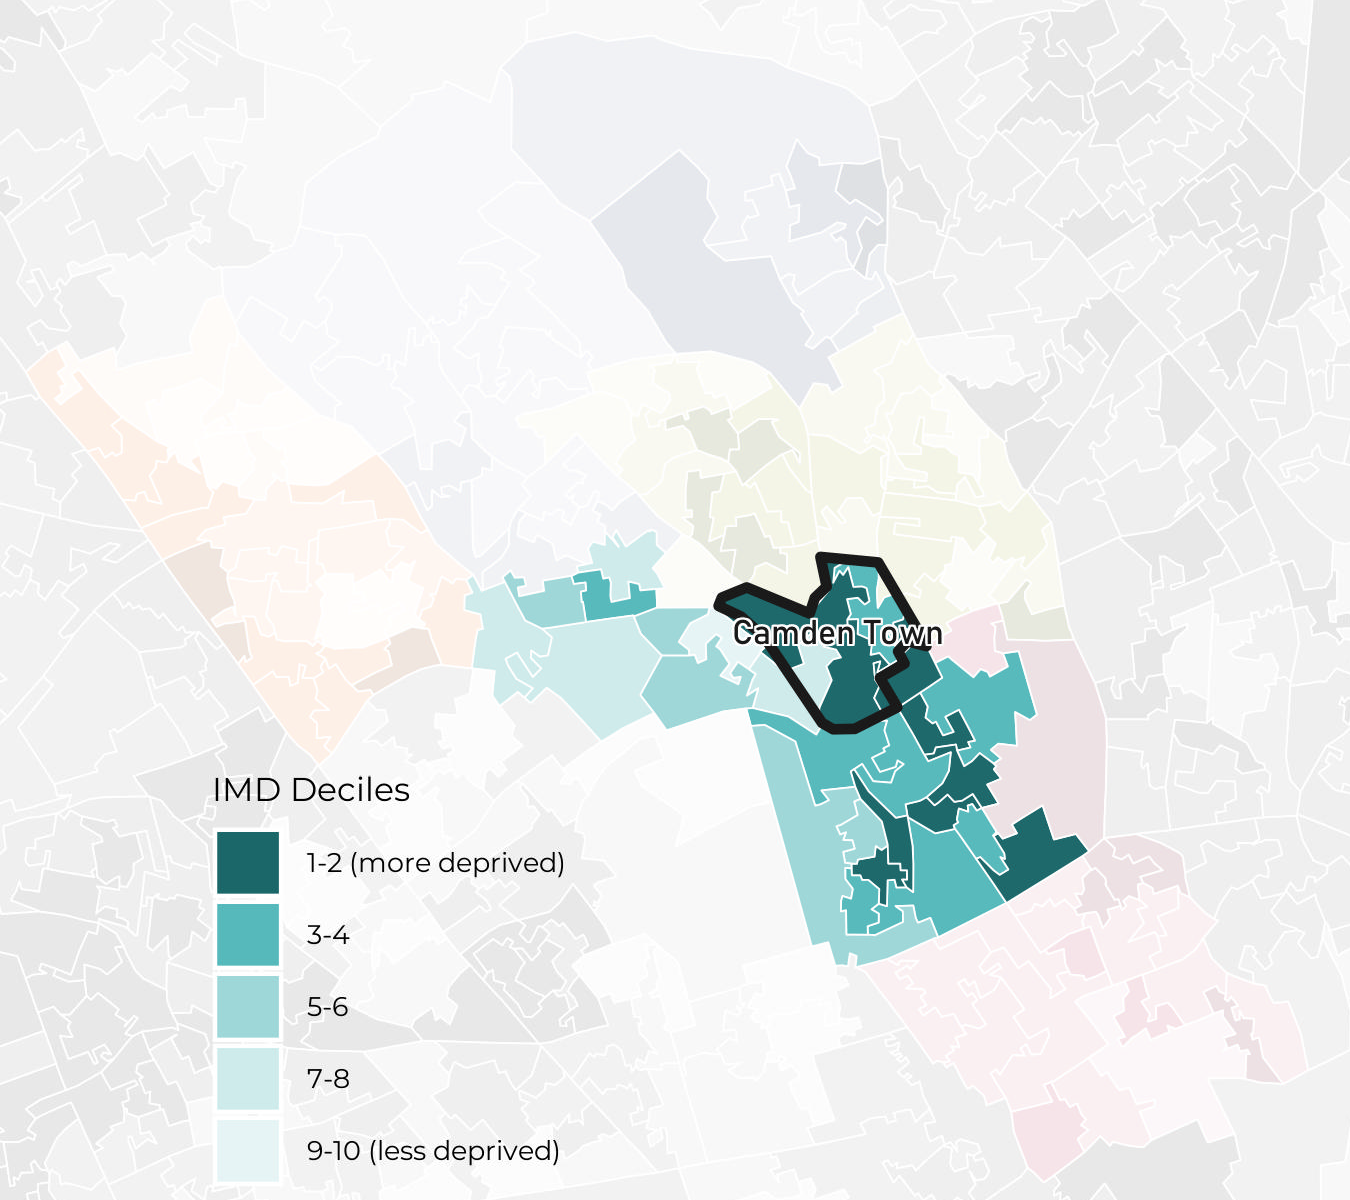
Index of Multiple Deprivation
Camden Town ward has IMD deciles ranging from decile 2 to decile 3. Note that the least deprived decile is decile 10.
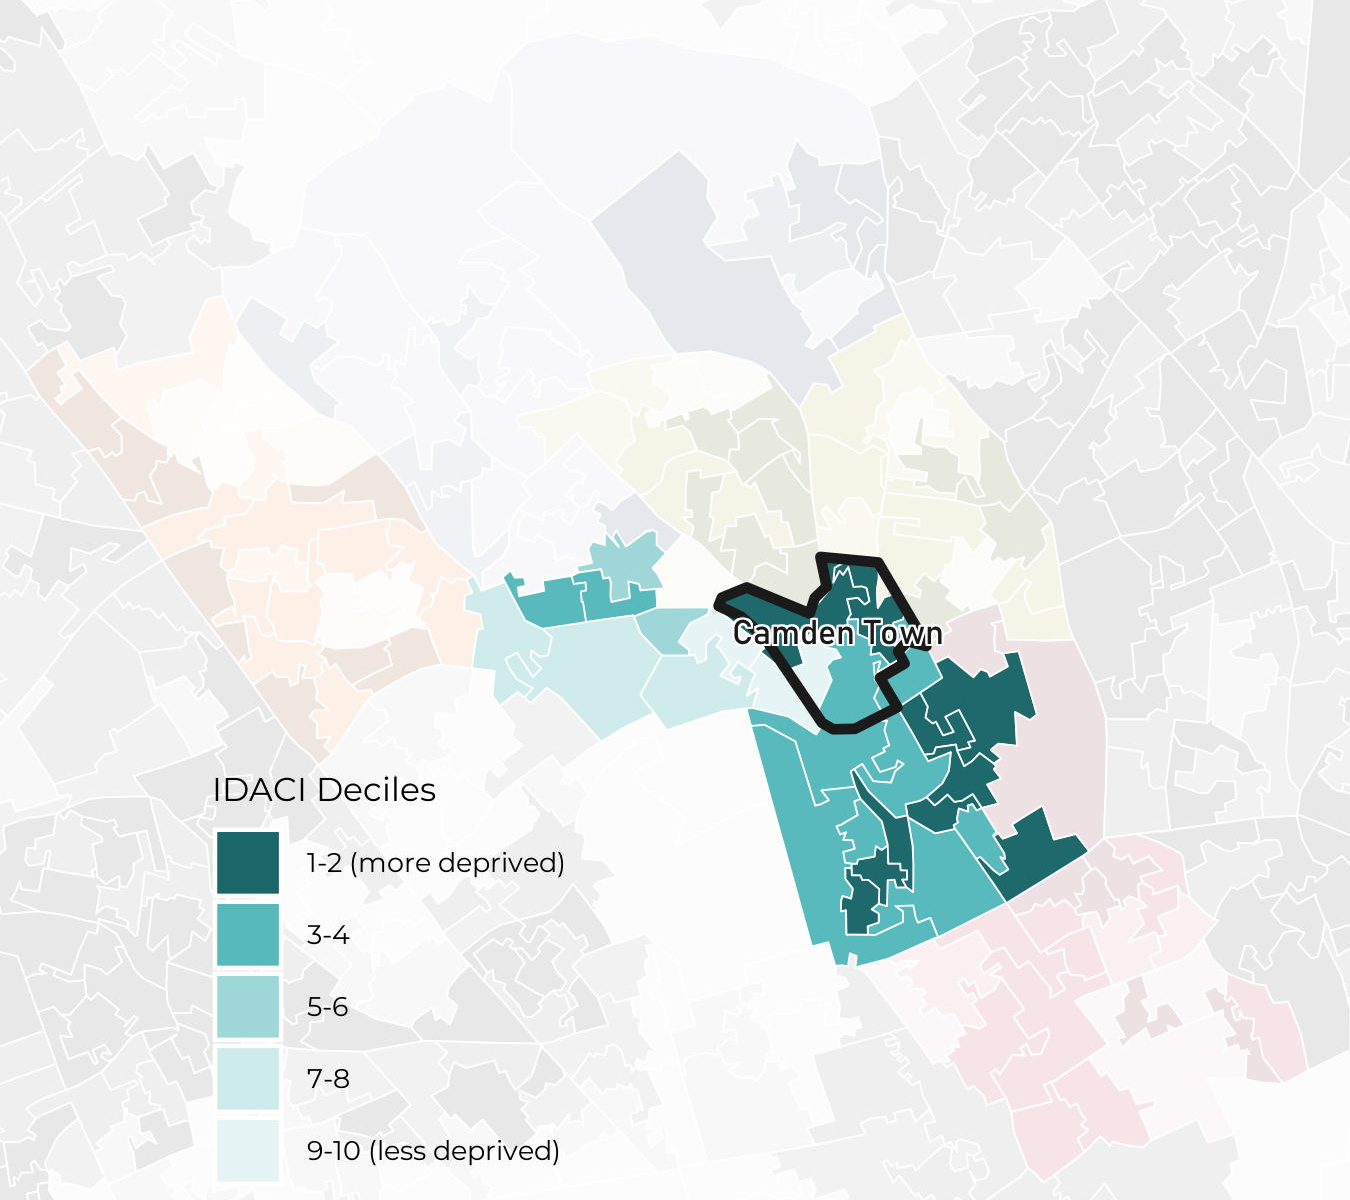
Camden Town ward has IDACI (Income Deprivation Affecting Children Index) deciles ranging from decile 1 to decile 4. Note that the least deprived decile is decile 10.

Camden Town ward has IDAOPI (Income Deprivation Affecting Older People Index) deciles ranging from decile 1 to decile 2. Note that the least deprived decile is decile 10.
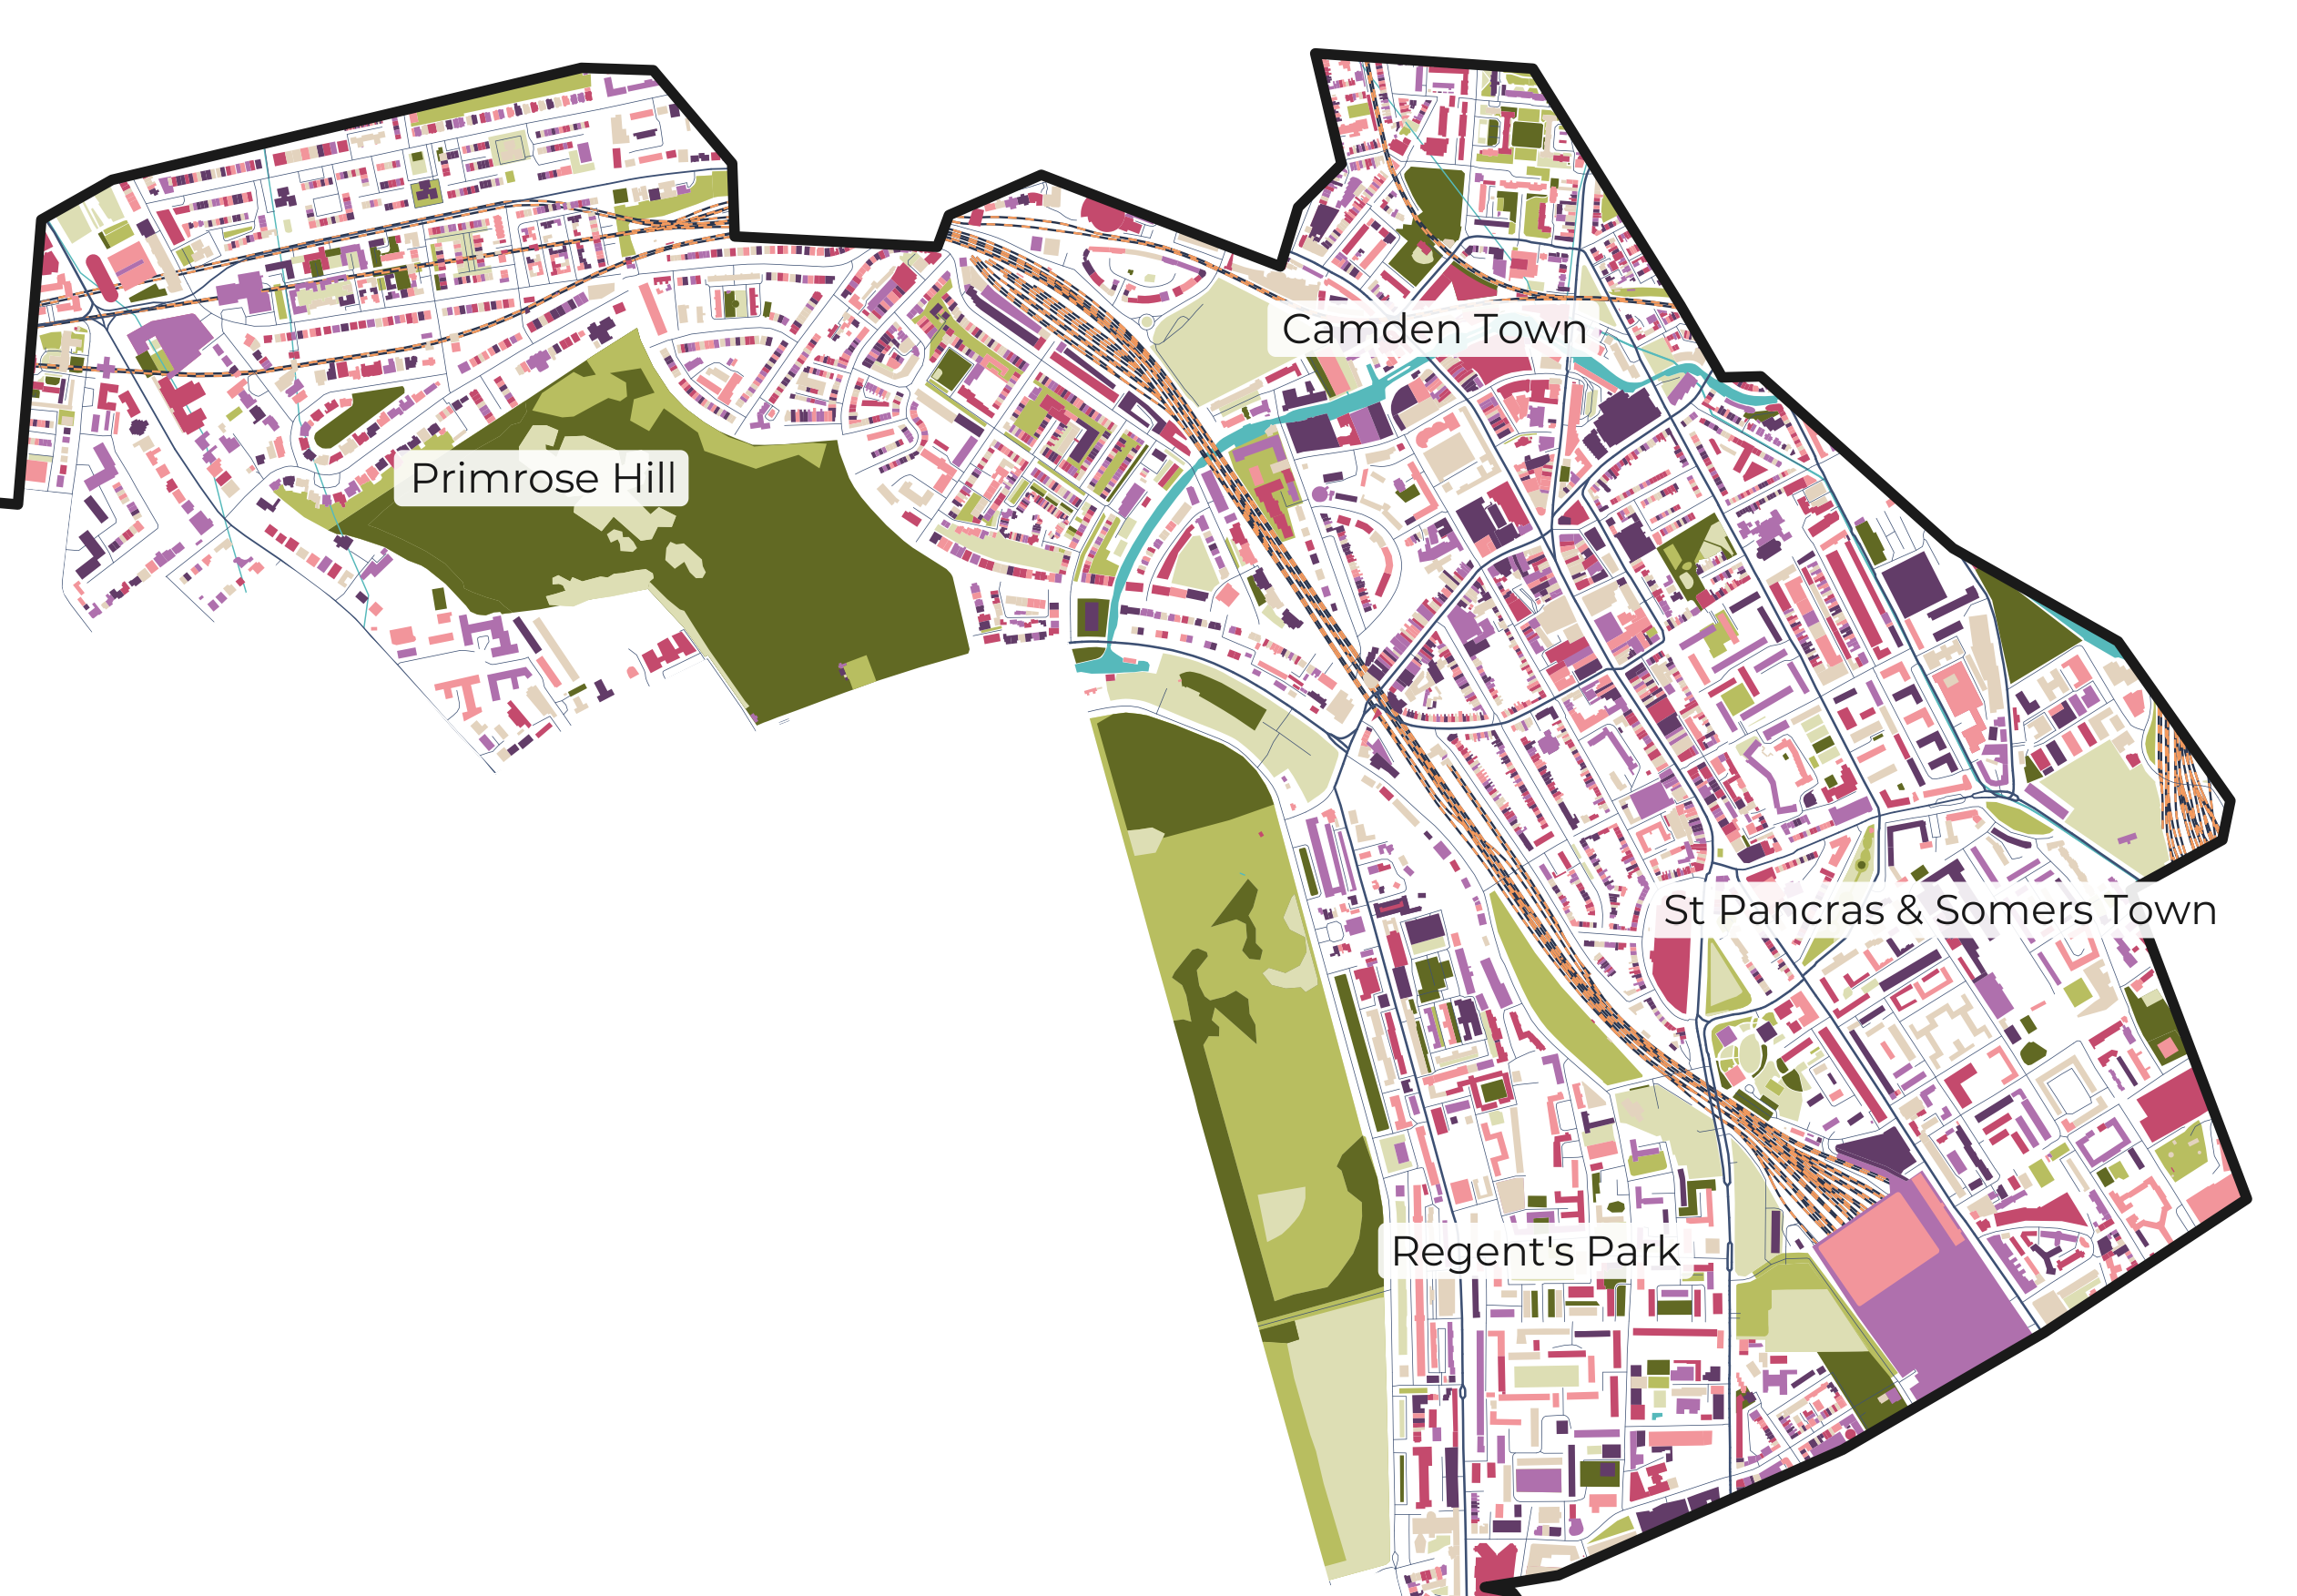
Environment
The place in which we live plays a key role in our health and wellbeing and is an important factor in the wider determinants of health. Access to green spaces and air quality indicators are presented below.
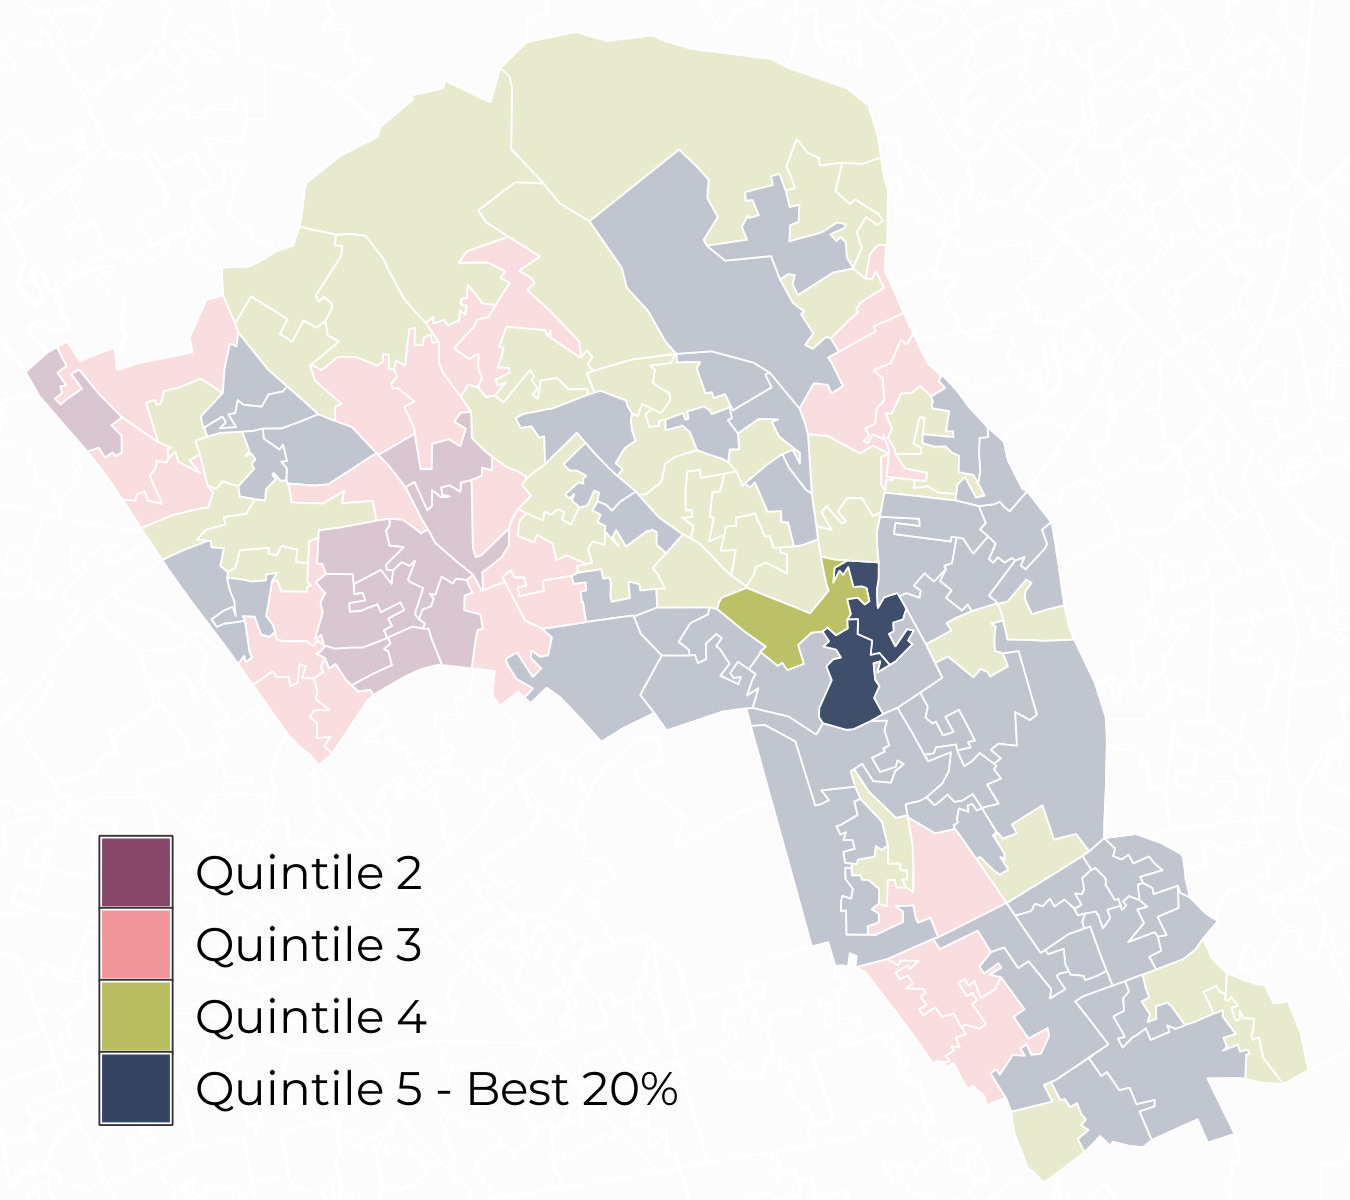
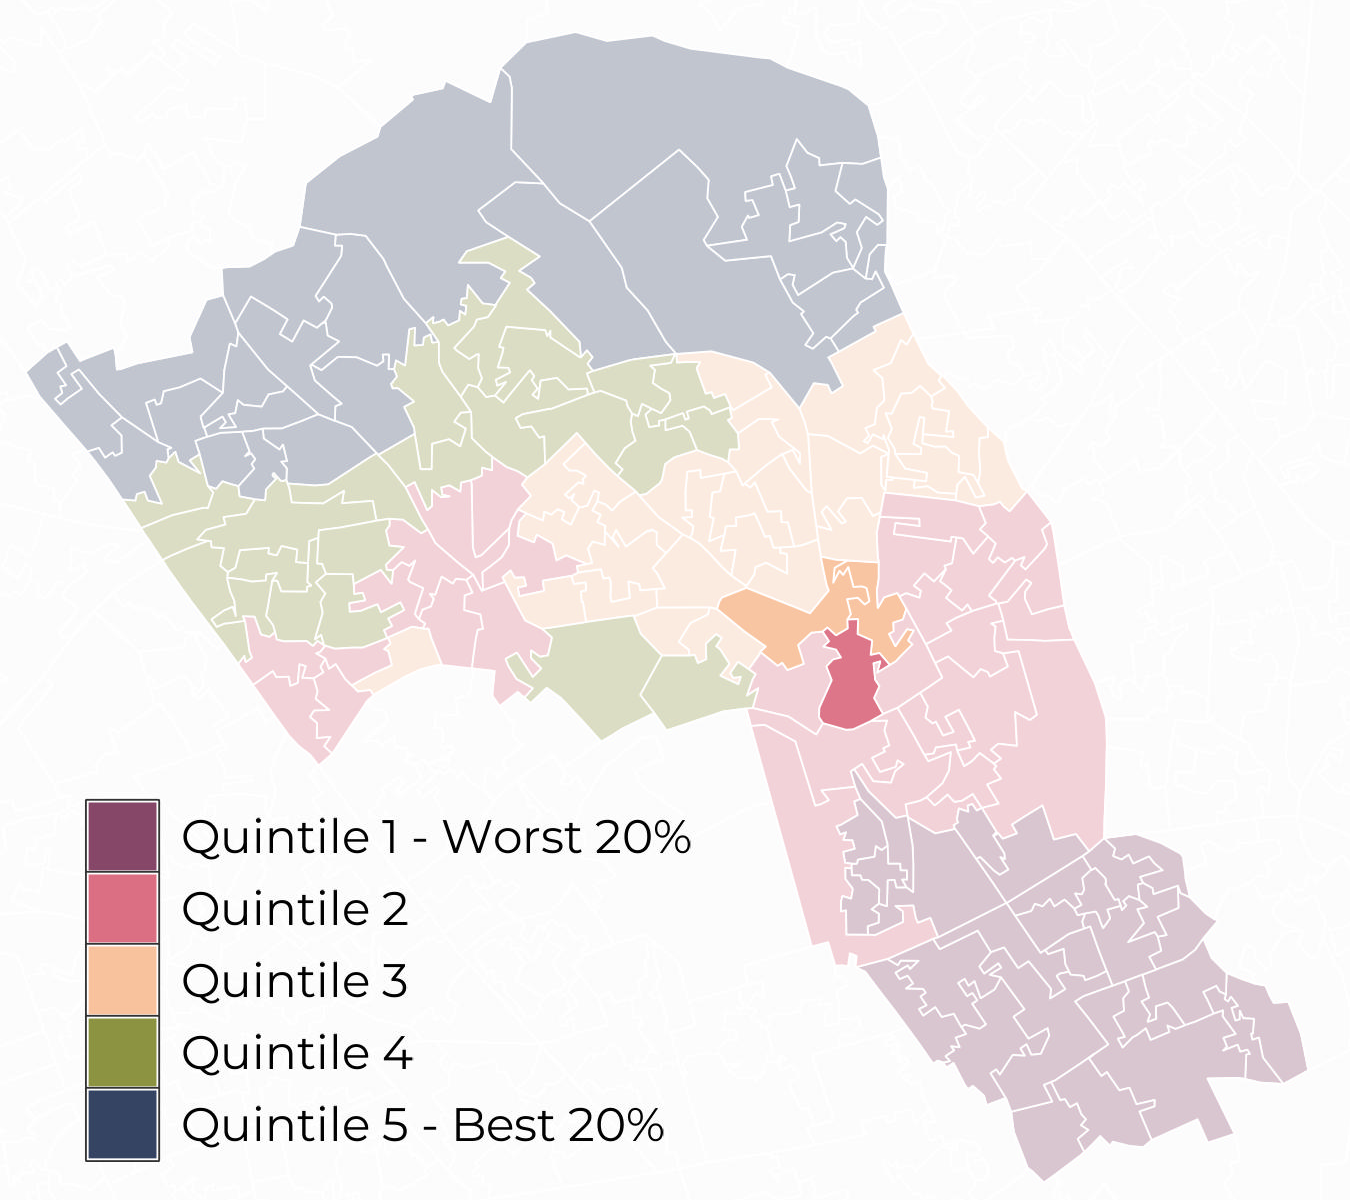
Most Lower Super Output Areas (LSOA) in Camden Town sit within Quintile 5 for access to green spaces and within Quintile 3 for air quality.
Behavioural risk factors and long-term conditions
Behavioural risk factors
The most prevalent behavioural risk factor in Camden Town is Smoking (19.02%). Camden Town has a statistically significant higher prevalence of Smoking and Obesity compared to the rest of the borough.
Long-term conditions
The most prevalent long-term conditions in Camden Town are Depression (13.42%), Hypertension (9.25%), Diabetes (4.79%), and Asthma (4.71%). Camden Town has statistically significant higher prevalence of Asthma, Depression, Diabetes, and Serious Mental Illness compared to the rest of the borough.
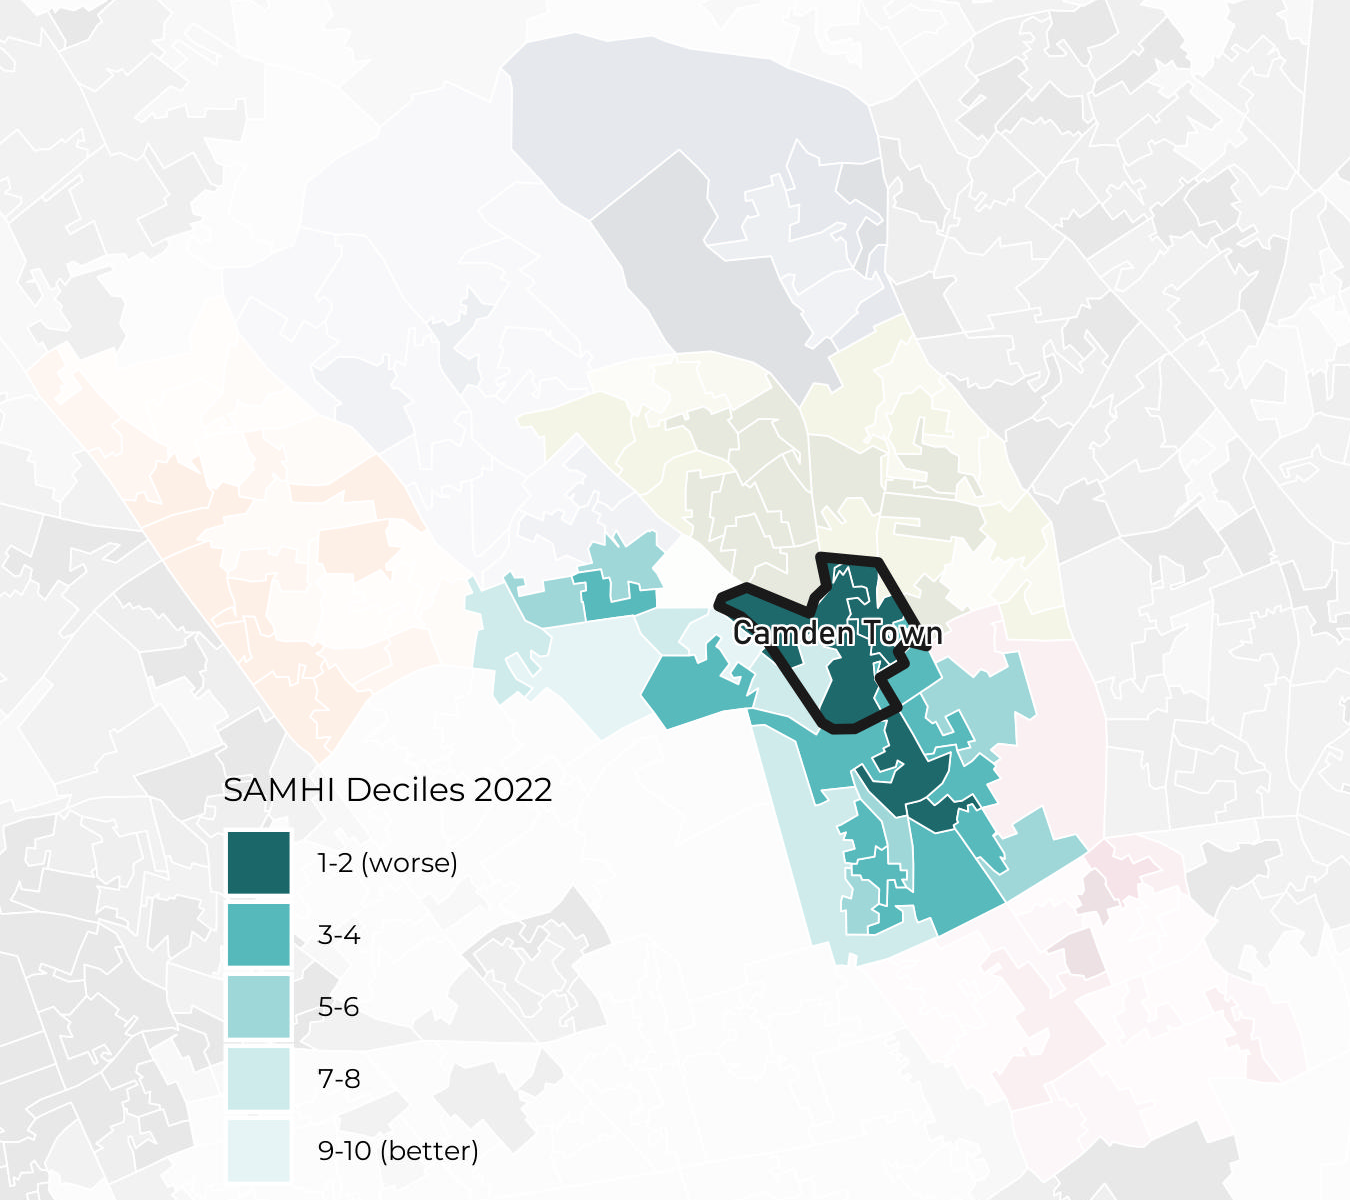
Mental health
In addition to reporting the prevalence of depression and serious mental illness (SMI), the NIHR Small Area Mental Health Index (SAMHI) can be used to examine geographical variation in mental health-related indicators at the LSOA level within the area.
Camden Town ward has SAMHI deciles ranging from decile 1 to decile 2. Note that the best decile is decile 10.