Camden East neighbourhood profile
A summary of the East neighbourhood of Camden comprised of Camden Sqaure, Gospal Oak, Haverstock, Kentish Town North, and Kentish Town South wards
Abstract
The population of Camden is among the most diverse in London and health outcomes vary significantly across its different neighbourhoods. Understanding the impact of environment on resident health is crucial for informed decision-making and the development of interventions. Based on council ward boundaries, the borough can be delineated into five distinct neighbourhoods, each characterised by unique population health needs - North, East, South, Central, and West. This area profile focuses on the East neighbourhood of Camden.
The East neighbourhood is comprised of Camden Sqaure, Gospal Oak, Haverstock, Kentish Town North, and Kentish Town South wards.
Introduction
This is a summary profile of Camden’s East neighbourhood which comprises of five wards - Camden Sqaure, Gospel Oak, Haverstock, Kentish Town North, and Kentish Town South. It includes data on the neighbourhood’s demography, levels of deprivation, and key health indicators such as life expectancy and prevalence of long-term conditions.
The East neighbourhood demonstrates poorer health outcomes across a wide range of health indicators, including childhood and adult obesity, alcohol dependence, smoking prevalence, and prevalence of long-term conditions like hypertension, depression and asthma.
There are also high levels of disability, and perhaps related to this, a high proportion of unpaid carers as well.
The neighbourhood is ethnically diverse with sizable Bangladeshi and Black African populations.
Ward level profiles are available in the following pages:
Demography
Population
The London Borough of Camden has approximately 219,900 residents according to the latest population projections. Of this total, 50,000 reside in the East neighbourhood, making it the neighbourhood with the highest number of residents. There are 27,100 female residents and 22,900 male residents in the East neighbourhood.
Age
Children and young people (0-24 years old) make up 29.47% of the population of the East neighbourhood which is less than Camden overall (30.85%). Additionally, the percentage of older adults aged 65+ years is 12.16% compared to 12.02%.
Ethnicity
The following data uses the Office of National Statistics (ONS) ethnicity classifications. When looking at the broader ethnicities (e.g. ‘Asian’ instead of ‘Asian: Indian’), the most frequently reported ethnicity in the East neighbourhood is White (61.95%), which is higher than Camden (59.52%). Additionally, this neighbourhood exhibits higher proportions of residents identifying as Black, and Mixed.
This ward has a similar ethnicity profile to Camden.
Wider Determinants of Health
Index of Multiple Deprivation
Deprivation levels vary widely within the neighbourhood.
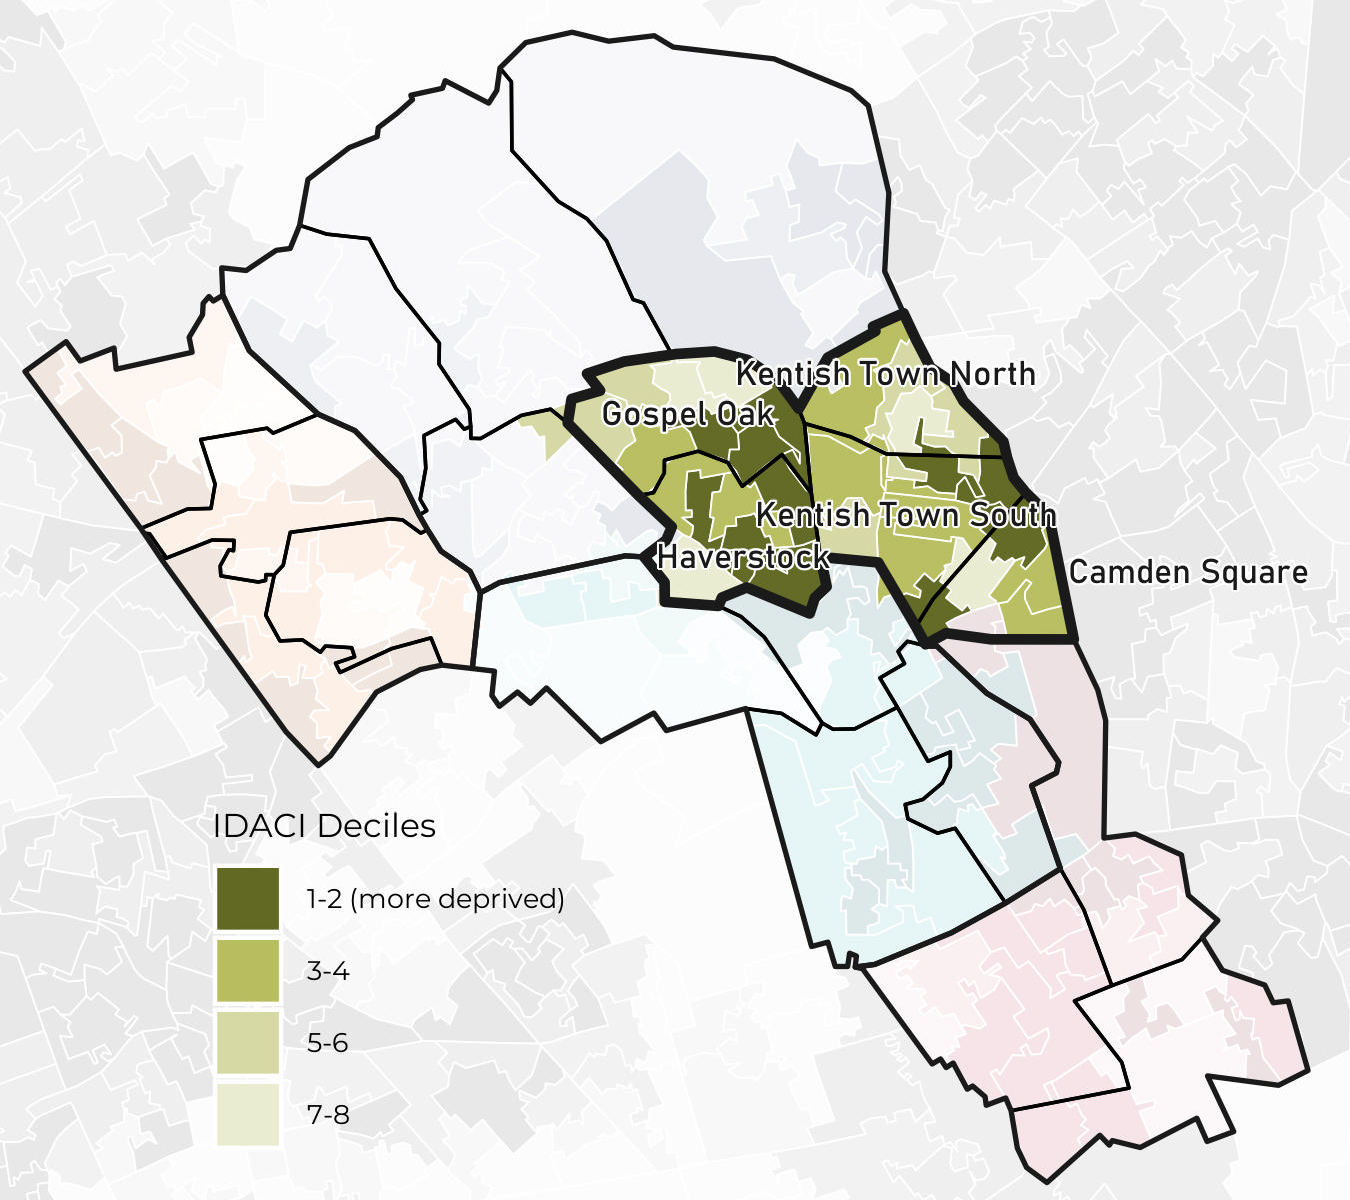
The East neighbourhood has higher deprivation when looking at the Income Deprivation Affecting Children Index (IDACI) and the Income Deprivation Affecting Older People Index (IDAOPI) compared to generalised IMD which may indicate health inequities among children and older adults in this area, especially in Gospel Oak and Haverstock wards.
The most deprived LSOAs in the East neighbourhood neighbourhood according to IMD deciles are in Haverstock, Camden Square, and Gospel Oak (decile 2) while the least deprived LSOAs are in Haverstock, and Gospel Oak (decile 8).

The most deprived LSOAs in the East neighbourhood neighbourhood according to IDACI (Income Deprivation Affecting Children Index) deciles are in Haverstock, Gospel Oak, and Camden Square (decile 1) while the least deprived LSOAs are in Haverstock (decile 8).

The most deprived LSOAs in the East neighbourhood neighbourhood according to IDAOPI (Income Deprivation Affecting Older People Index) deciles are in Kentish Town South, Haverstock, Camden Square, and Gospel Oak (decile 1) while the least deprived LSOAs are in Gospel Oak (decile 6).
Environment
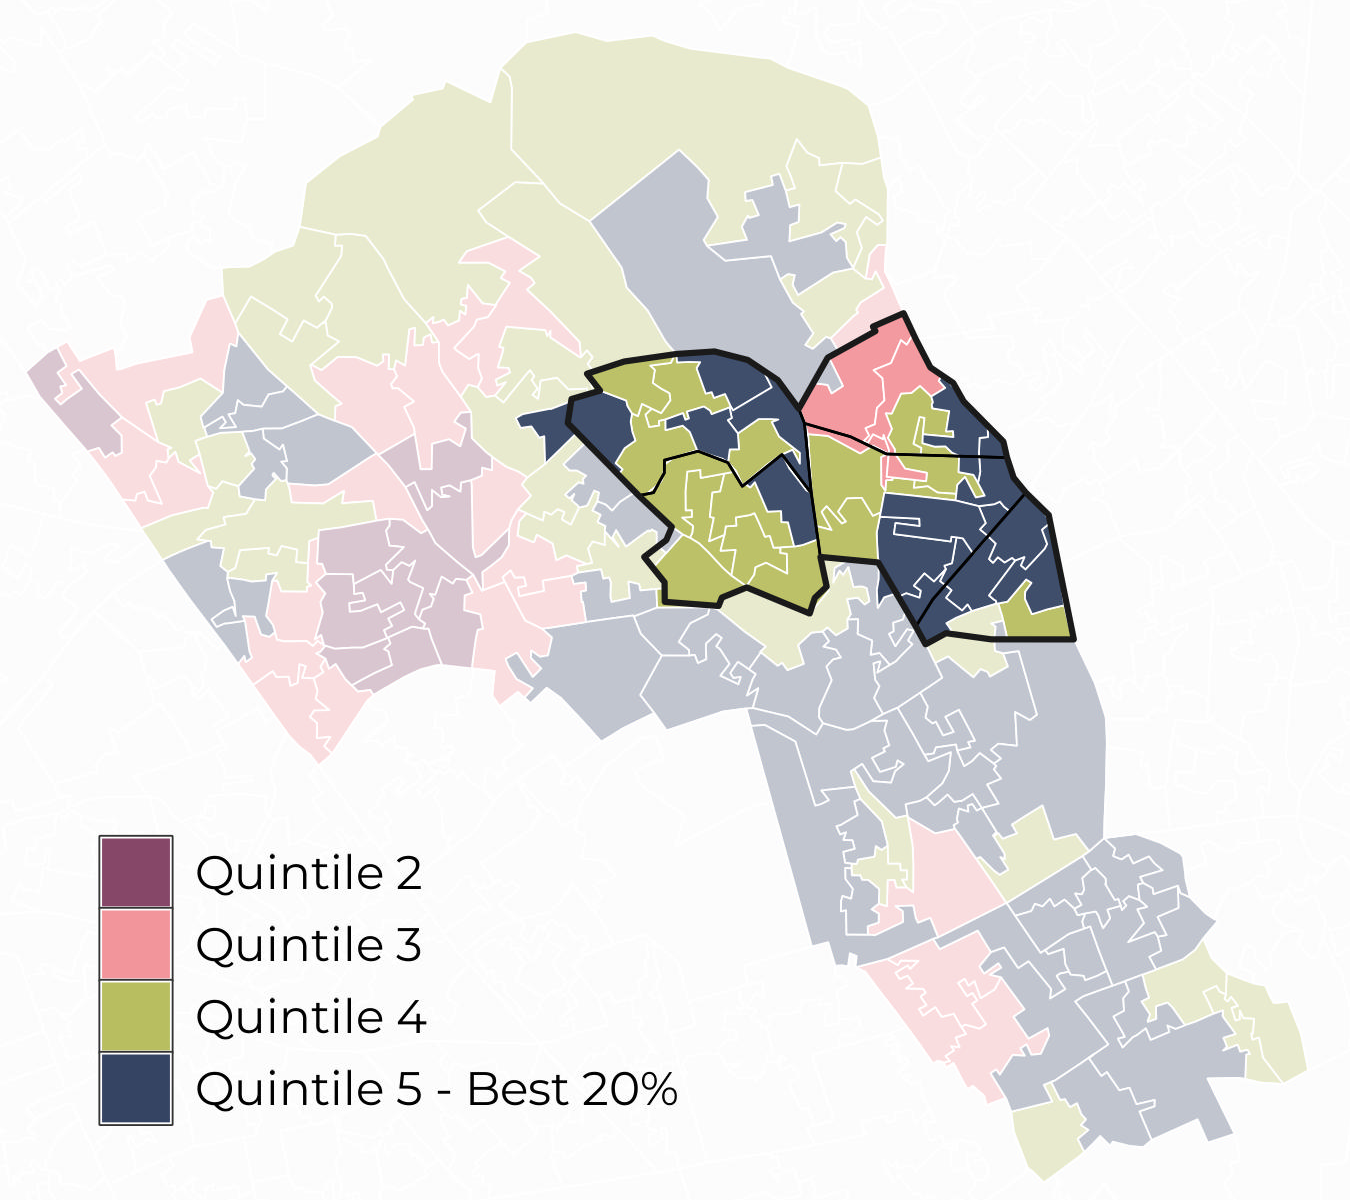
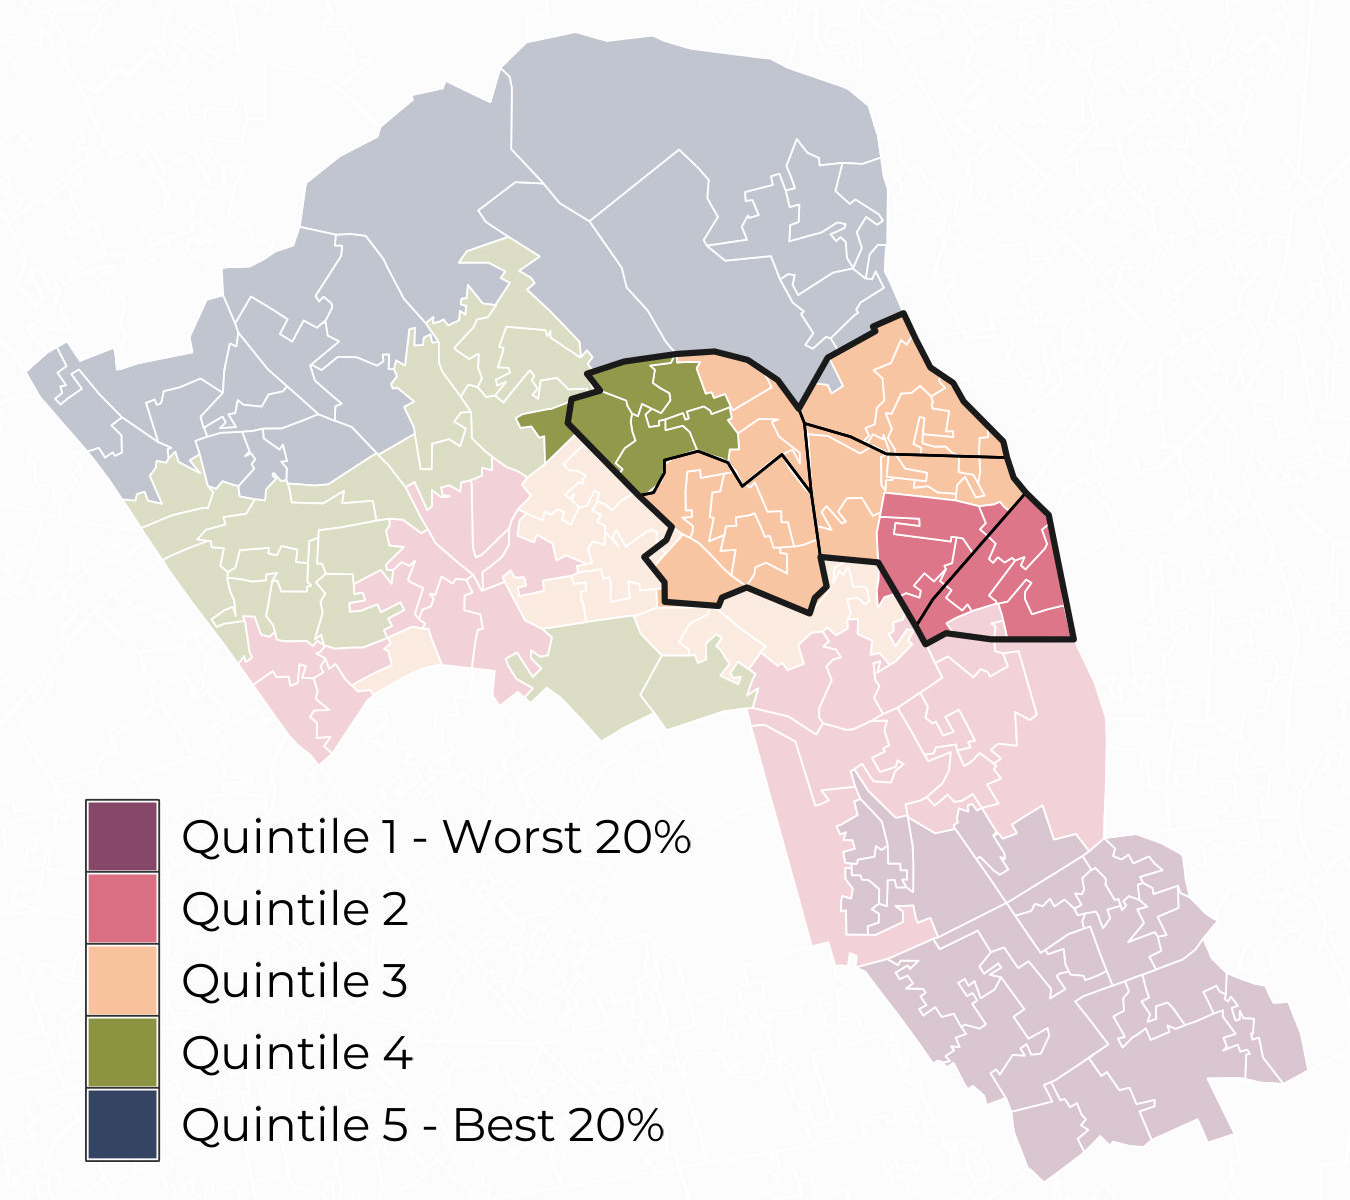
The place in which we live plays a key role in our health and wellbeing and is an important factor in the wider determinants of health. Access to green spaces and air quality indicators are presented below.
Most Lower Super Output Areas (LSOA) in the East neighbourhood sit within Quintile 4 for access to green spaces and within Quintile 3 for air quality.
Behavioural risk factors and long-term conditions
Behavioural risk factors
The most prevalent behavioural risk factor in the East neighbourhood is Smoking (17.74%). The East neighbourhood has a statistically significant higher prevalence of Alcohol Abuse or Dependence, Smoking and Obesity compared to the rest of the borough.
Long-term conditions
The most prevalent long-term conditions in the East neighbourhood are Depression (12.84%), Hypertension (10.26%), Asthma (5.01%), and Diabetes (4.5%). The East neighbourhood has statistically significant higher prevalence of Asthma, Cancer, Chronic Obstructive Pulmonary Disease, Dementia, Depression, Diabetes, Epilepsy, Hypertension, Palliative Care, Peripheral Arterial Disease, Serious Mental Illness, and Stroke and TIA compared to the rest of the borough.
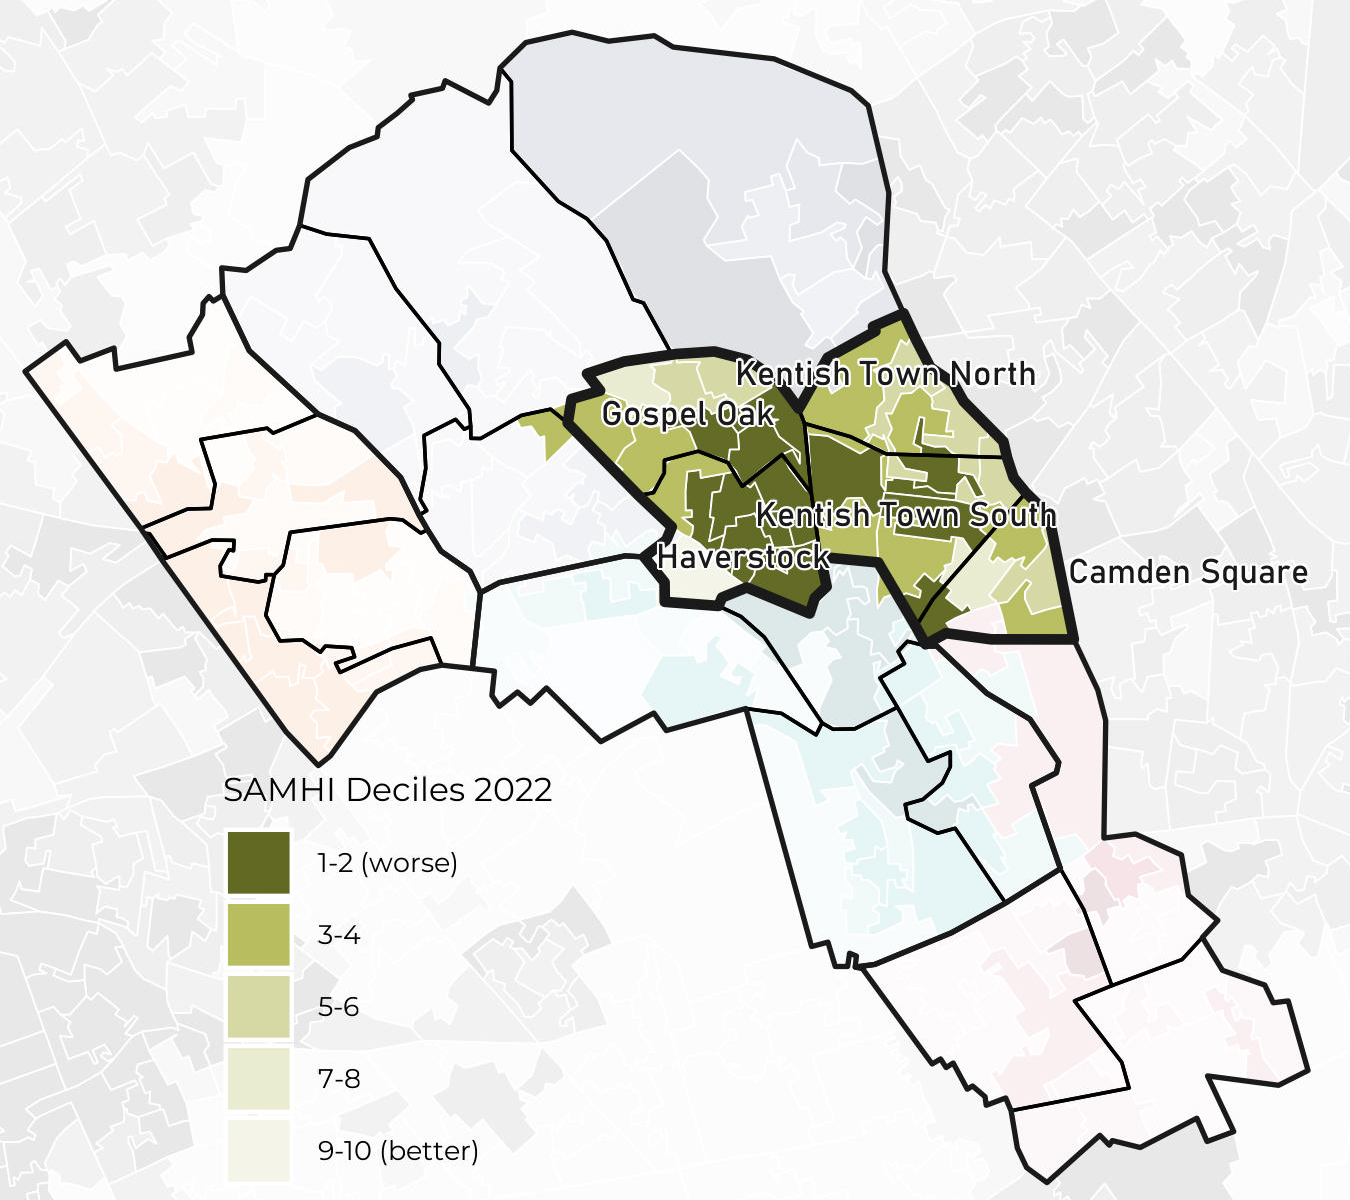
Mental health
In addition to reporting the prevalence of depression and serious mental illness (SMI), the NIHR Small Area Mental Health Index (SAMHI) can be used to examine geographical variation in mental health-related indicators at the LSOA level within the area.
The worst LSOAs in the East neighbourhood neighbourhood according to SAMHI deciles are in Haverstock, Gospel Oak, and Kentish Town South (decile 1) while the best LSOAs are in Haverstock (decile 9).