Camden North neighbourhood profile
A summary of the North neighbourhood of Camden comprised of Belsize, Frognal, Hampstead Town, and Highgate wards
Abstract
The population of Camden is among the most diverse in London and health outcomes vary significantly across its different neighbourhoods. Understanding the impact of environment on resident health is crucial for informed decision-making and the development of interventions. Based on council ward boundaries, the borough can be delineated into five distinct neighbourhoods, each characterised by unique population health needs - North, East, South, Central, and West. This area profile focuses on the North neighbourhood of Camden.
The North neighbourhood is comprised of Belsize, Frognal, Hampstead Town, and Highgate wards.
Introduction
This is a summary profile of Camden’s North neighbourhood which comprises of four wards - Highgate, Frognal, Hampstead Town, and Belsize. It includes data on the neighbourhood’s demography, levels of deprivation, and key health indicators such as life expectancy and prevalence of long-term conditions.
The North neighbourhood has the lowest levels of ill health across a wide range of outcomes and the highest levels of affluence of Camden’s neighbourhoods.
All wards follow this trend apart from Highgate, which has high levels of alcohol dependence, depression, hypertension and asthma – demonstrating a pocket of need and highlighting the importance of granular data analysis.
The North of the borough also has better air quality and relatively good access to green space.
There are, however, higher numbers of residents over age 66 who live alone, which can contribute to social isolation, and higher prevalence of hypertension, again reflective of the age demographic.
Life expectancy is generally higher, and despite the older age demographic, there are lower levels of disability and unpaid care.
Ward level profiles are available in the following pages:
Demography
Population
The London Borough of Camden has approximately 219,900 residents according to the latest population projections. Of this total, 39,100 reside in the North neighbourhood, making it the neighbourhood with the fourth most number of residents. There are 20,800 female residents and 18,300 male residents in the North neighbourhood.
Age
Children and young people (0-24 years old) make up 25.53% of the population of the North neighbourhood which is less than Camden overall (30.85%). Additionally, the percentage of older adults aged 65+ years is 16.39% compared to 12.02%.
Overall the North neighbourhood has an older age profile compared to Camden. There are lower proportions of young adults in their twenties which is prevalent in the other neighbourhoods and significantly more older adults aged 65 and over.
Ethnicity
The following data uses the Office of National Statistics (ONS) ethnicity classifications. When looking at the broader ethnicities (e.g. ‘Asian’ instead of ‘Asian: Indian’), the most frequently reported ethnicity in the North neighbourhood is White (72.86%), which is higher than Camden (59.52%).
This ward has a similar ethnicity profile to Camden.
Wider Determinants of Health
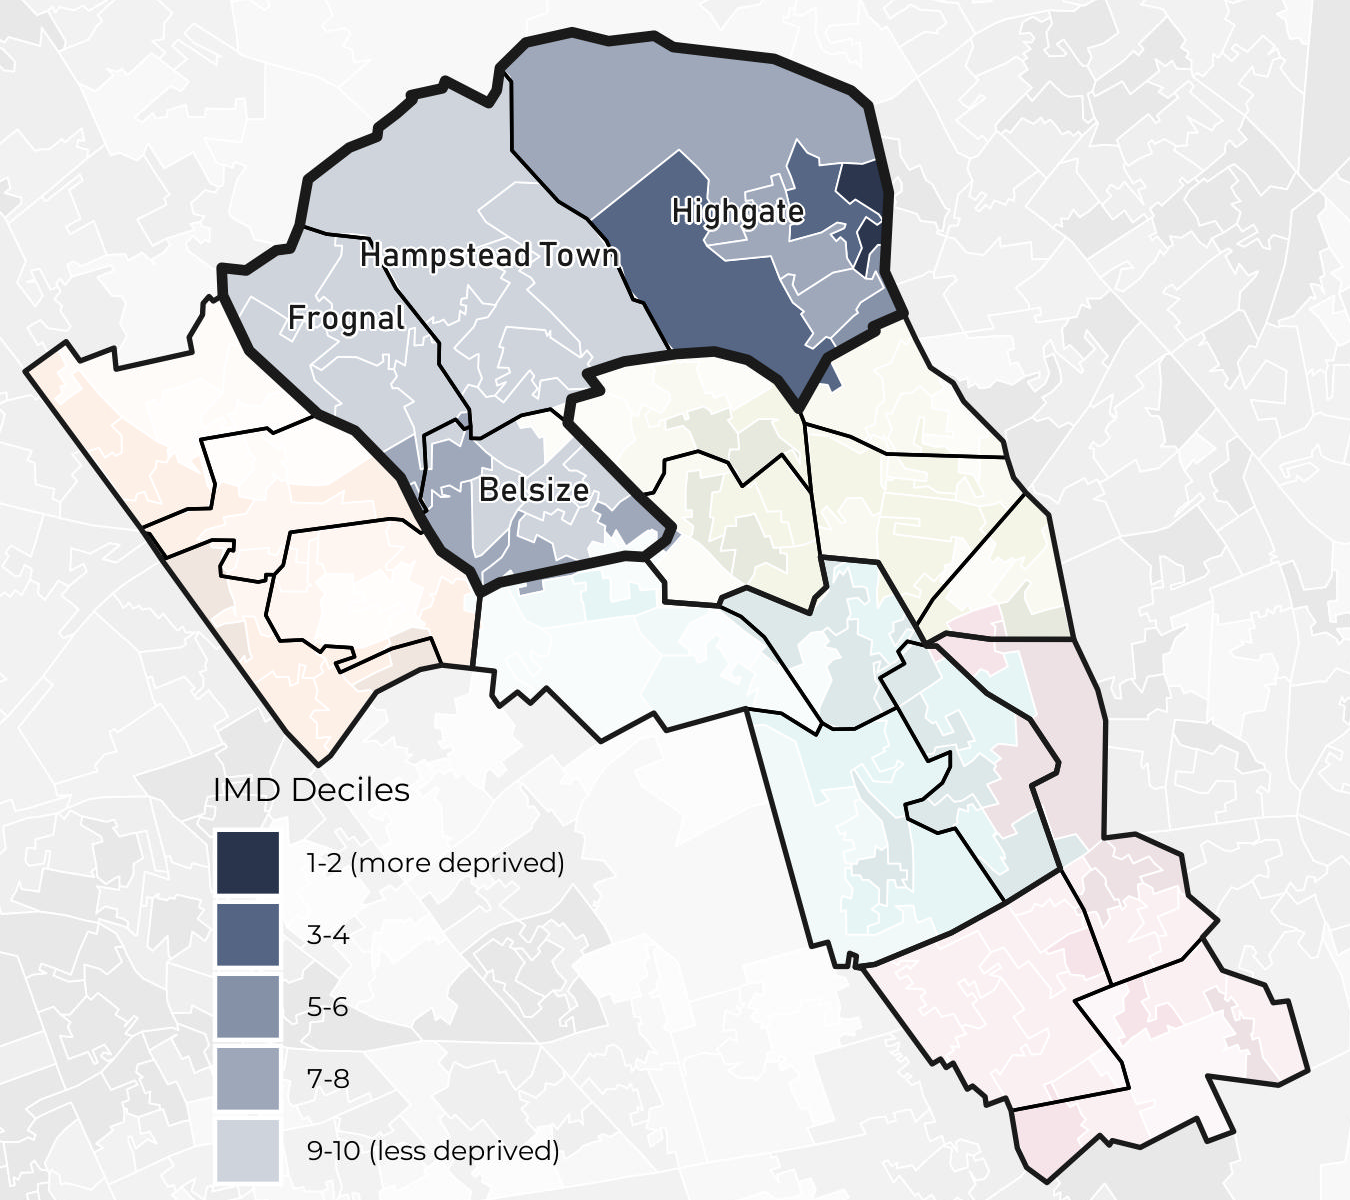
Index of Multiple Deprivation
The most deprived LSOAs within the neighbourhood sit within Highgate.
The most deprived LSOAs in the North neighbourhood neighbourhood according to IMD deciles are in Highgate (decile 2) while the least deprived LSOAs are in Hampstead Town, Frognal, and Belsize (decile 10).
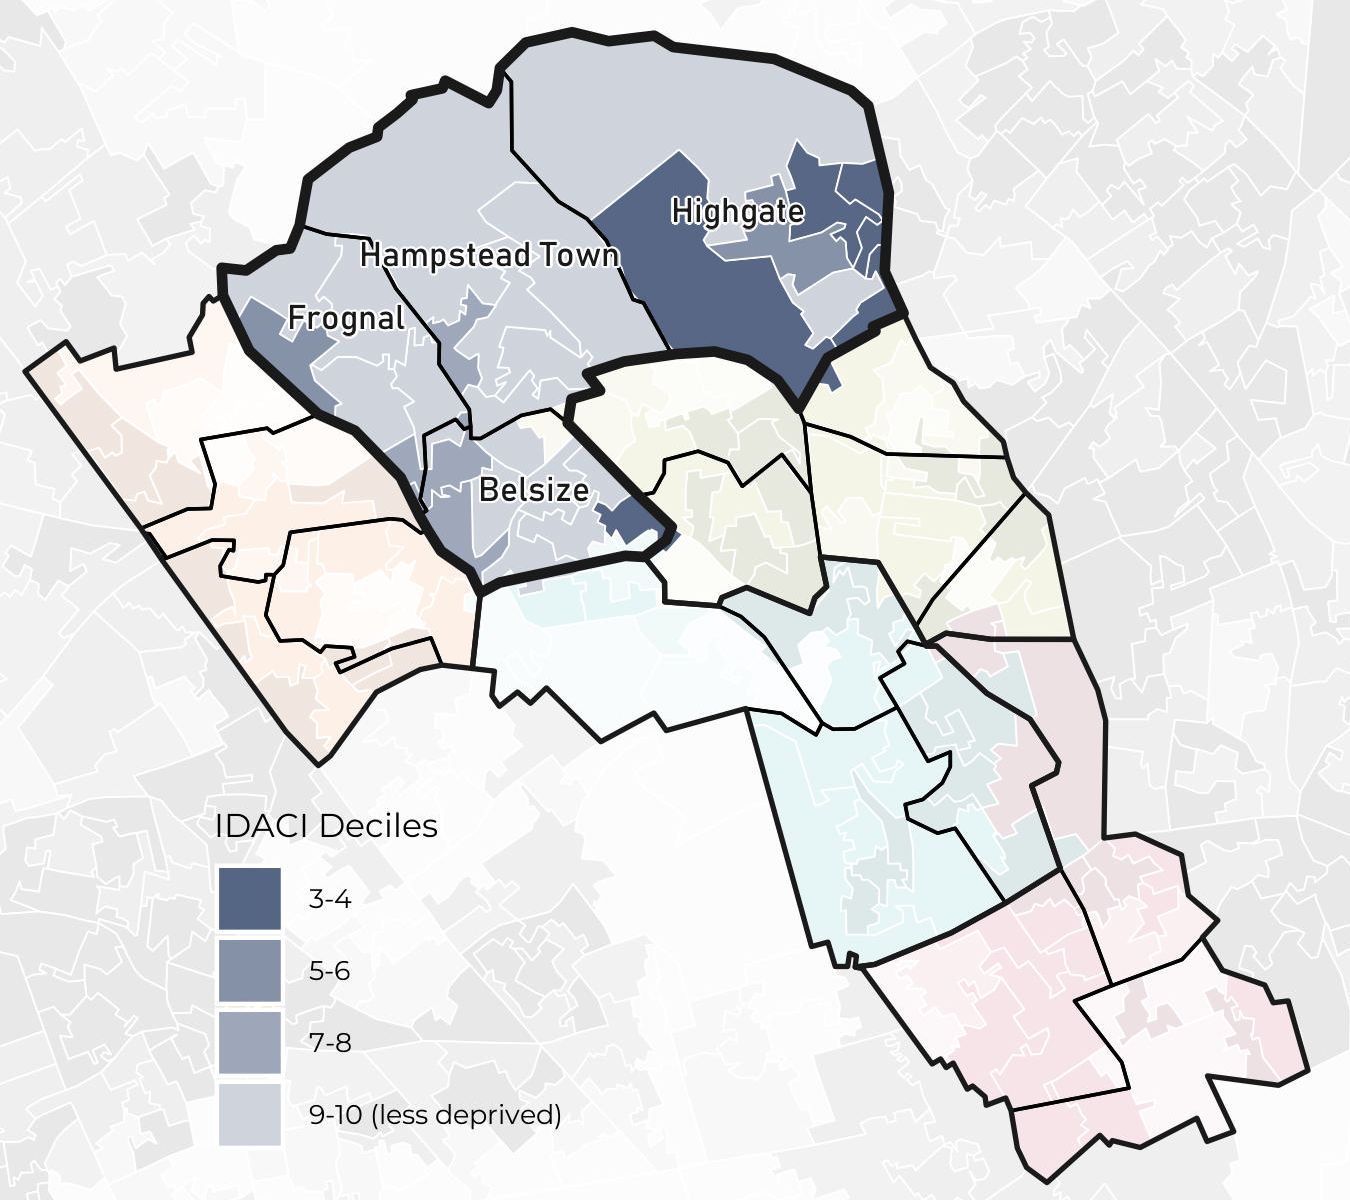
The most deprived LSOAs in the North neighbourhood neighbourhood according to IDACI (Income Deprivation Affecting Children Index) deciles are in Highgate (decile 3) while the least deprived LSOAs are in Hampstead Town, Belsize, Frognal, and Highgate (decile 10).

The most deprived LSOAs in the North neighbourhood neighbourhood according to IDAOPI (Income Deprivation Affecting Older People Index) deciles are in Highgate (decile 2) while the least deprived LSOAs are in Hampstead Town, Highgate, and Frognal (decile 10).
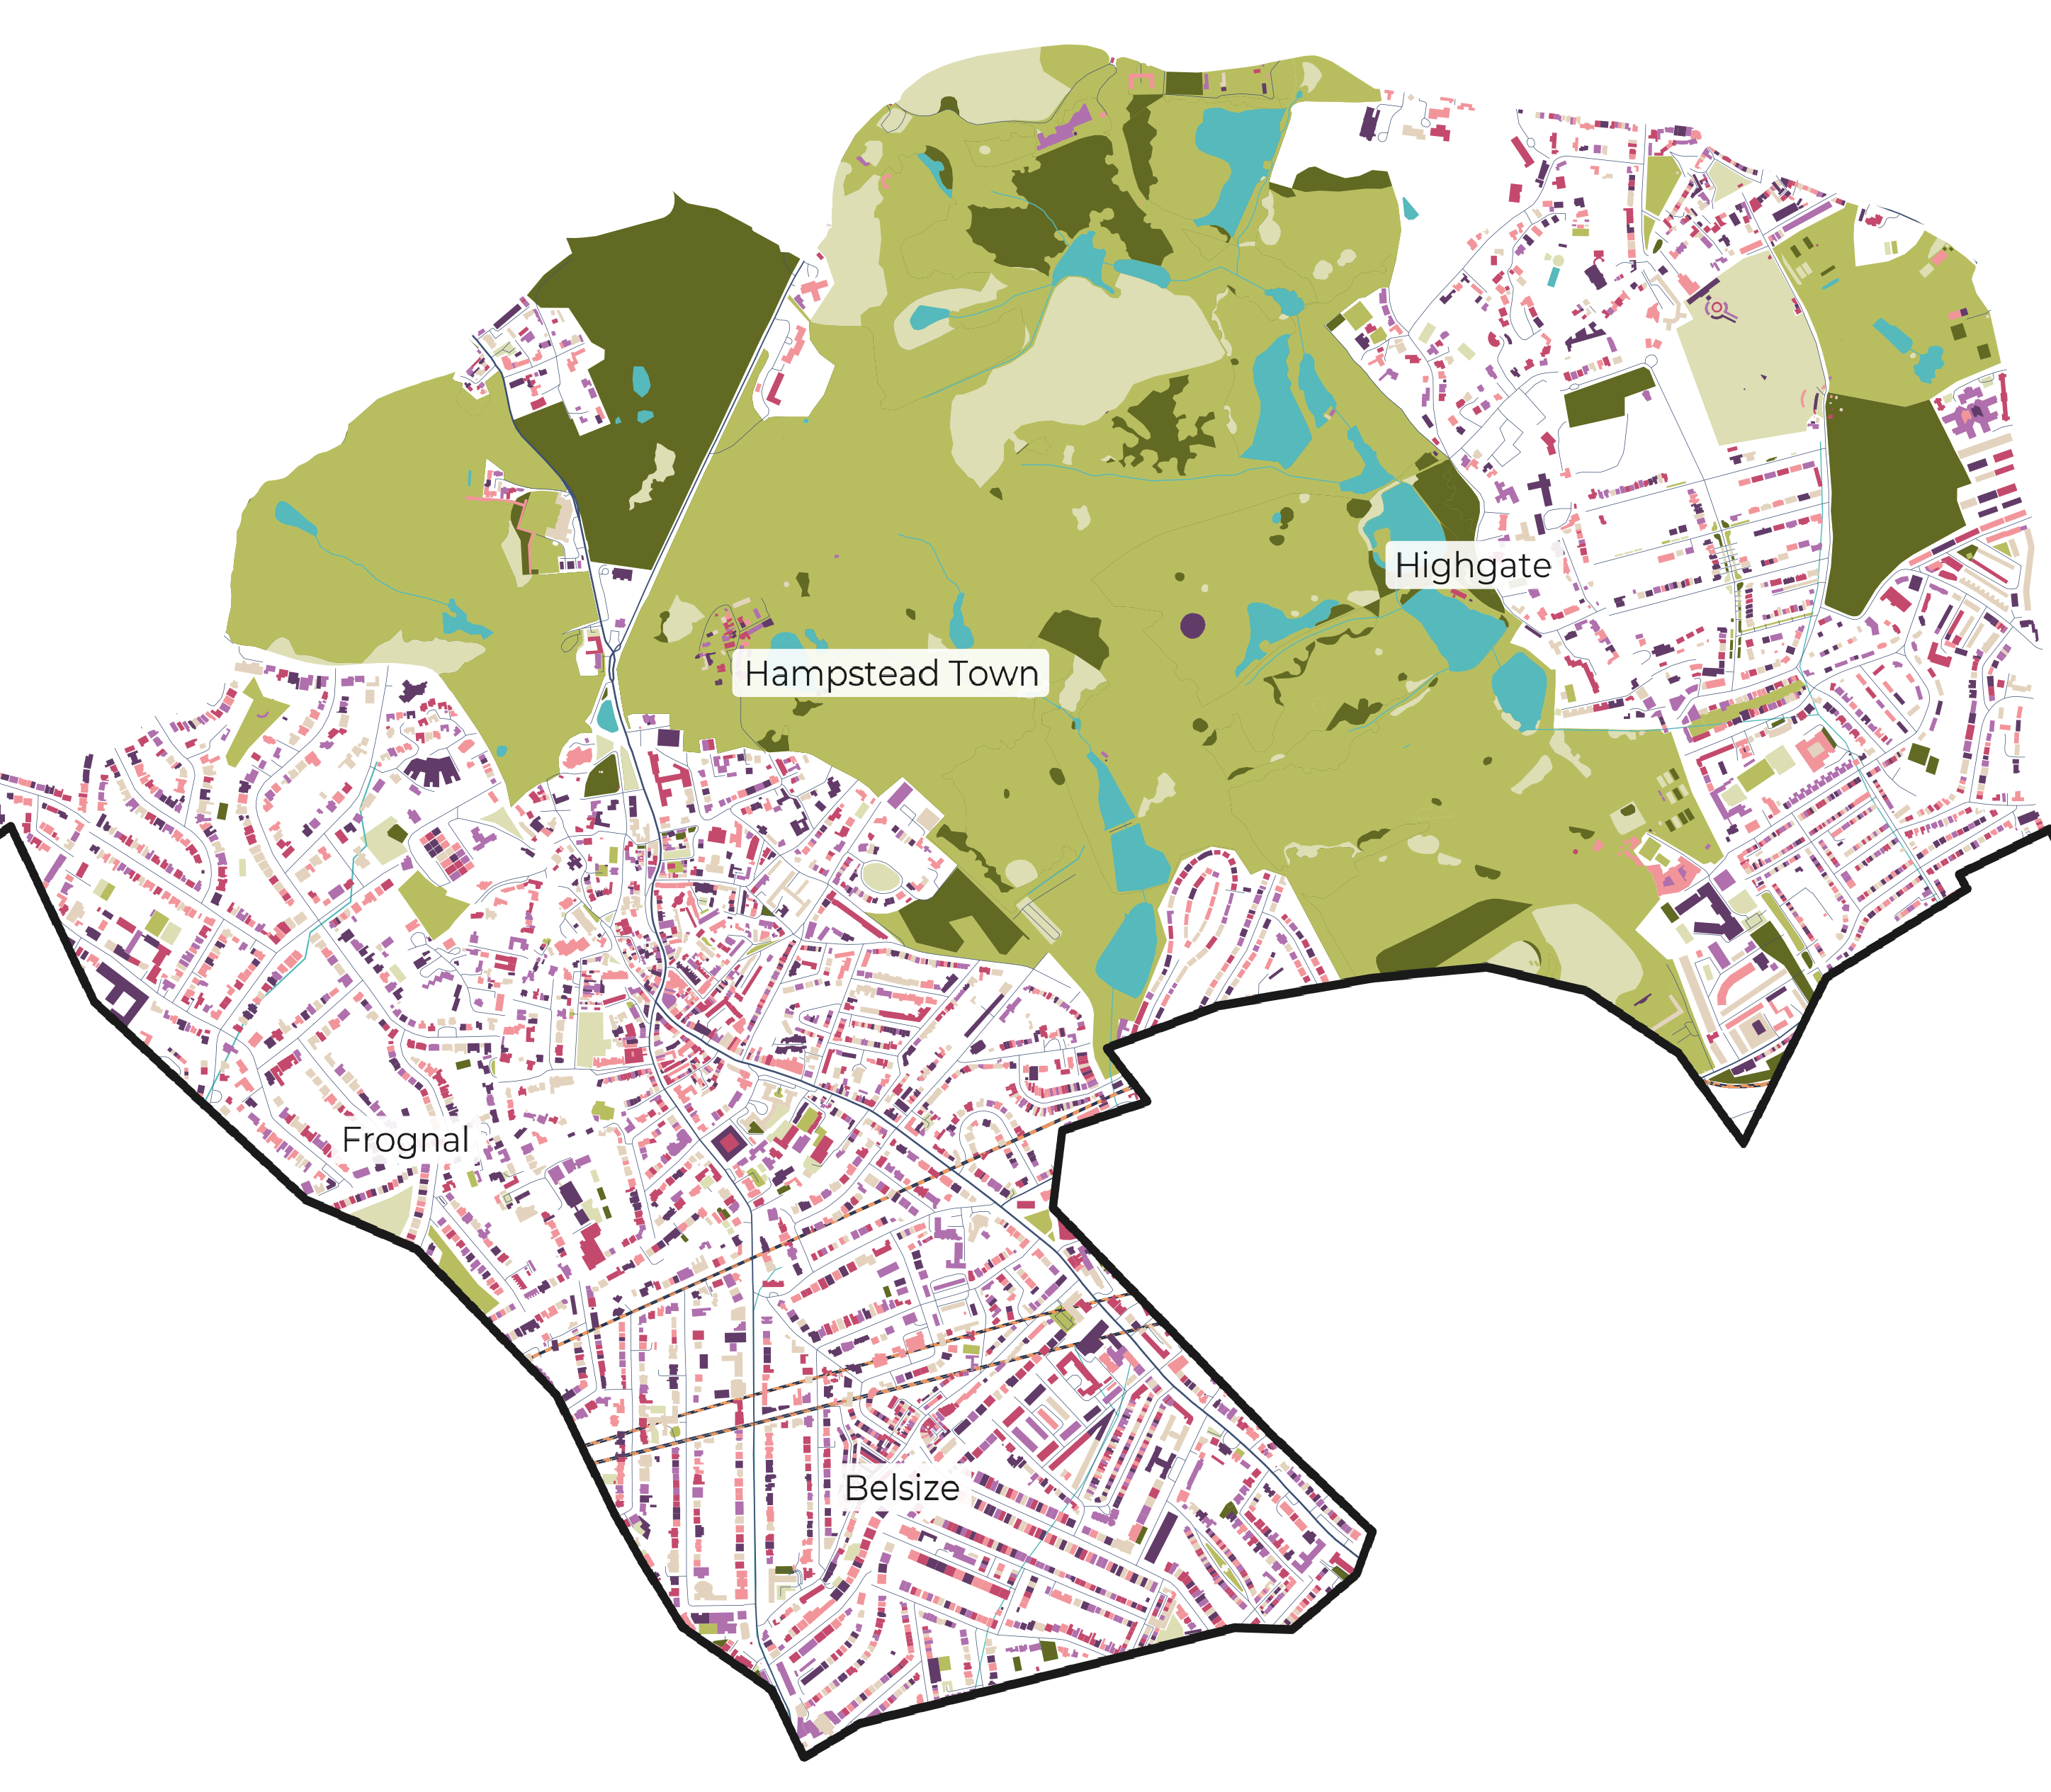
Environment
The place in which we live plays a key role in our health and wellbeing and is an important factor in the wider determinants of health. Access to green spaces and air quality indicators are presented below.
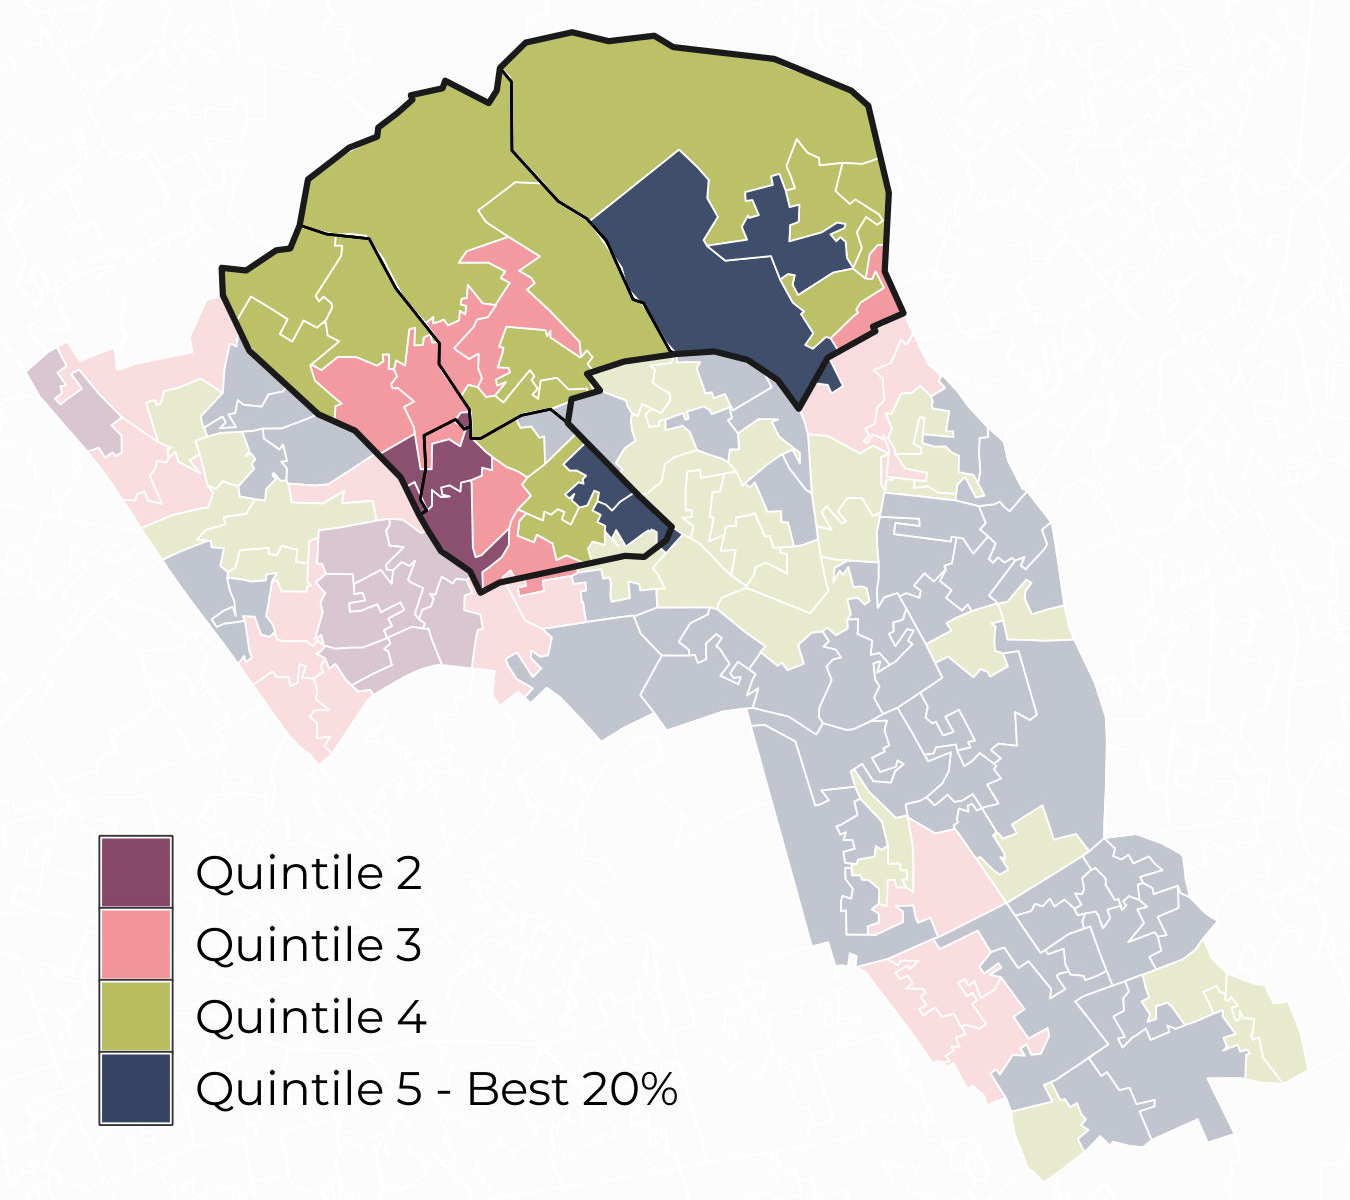
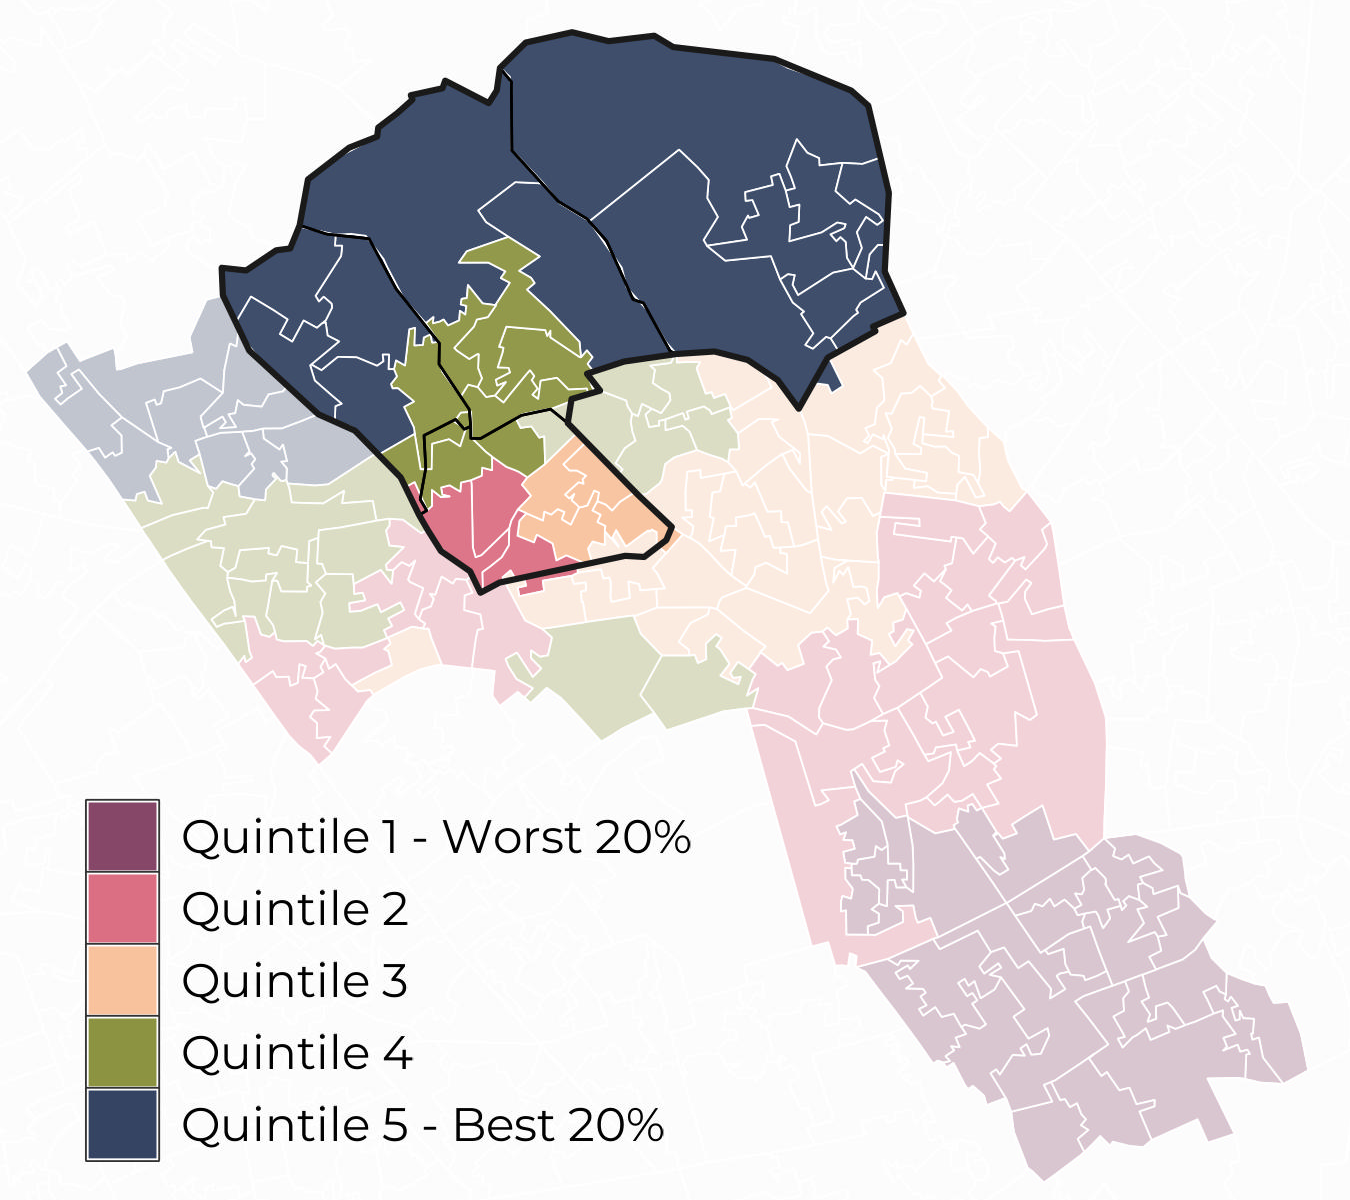
Most Lower Super Output Areas (LSOA) in the North neighbourhood sit within Quintile 4 for access to green spaces and within Quintile 5 for air quality.
Behavioural risk factors and long-term conditions
Behavioural risk factors
The most prevalent behavioural risk factor in the North neighbourhood is Smoking (11.86%). The North neighbourhood has a statistically significant lower prevalence of Smoking and Obesity compared to the rest of the borough.
Long-term conditions
The most prevalent long-term conditions in the North neighbourhood are Hypertension (10.17%), Depression (9.89%), Cancer (3.8%), and Asthma (3.68%). The North neighbourhood has statistically significant higher prevalence of Atrial Fibrillation, Cancer, Chronic Kidney Disease, Coronary Heart Disease, Dementia, and Hypertension compared to the rest of the borough.
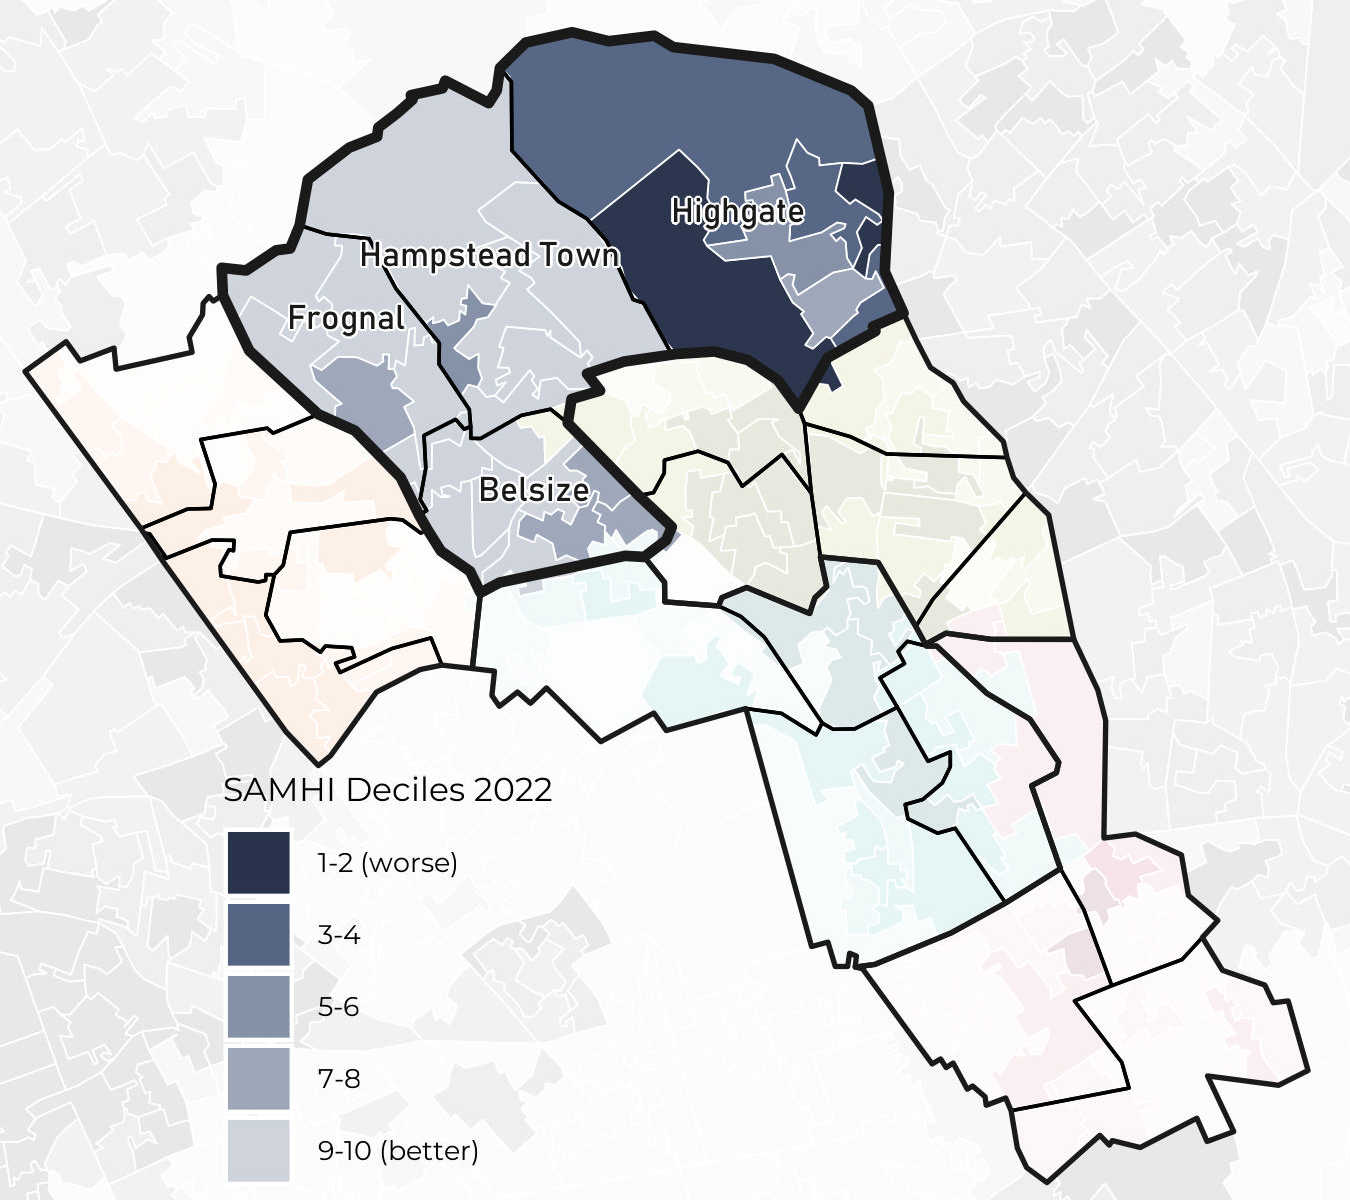
Mental health
In addition to reporting the prevalence of depression and serious mental illness (SMI), the NIHR Small Area Mental Health Index (SAMHI) can be used to examine geographical variation in mental health-related indicators at the LSOA level within the area.
The worst LSOAs in the North neighbourhood neighbourhood according to SAMHI deciles are in Highgate (decile 1) while the best LSOAs are in Belsize, and Hampstead Town (decile 10).