Camden South neighbourhood profile
A summary of the South neighbourhood of Camden comprised of Bloomsbury, Holborn & Covent Garden and King’s Cross wards
Abstract
The population of Camden is among the most diverse in London and health outcomes vary significantly across its different neighbourhoods. Understanding the impact of environment on resident health is crucial for informed decision-making and the development of interventions. Based on council ward boundaries, the borough can be delineated into five distinct neighbourhoods, each characterised by unique population health needs - North, East, South, Central, and West. This area profile focuses on the South neighbourhood of Camden.
The South neighbourhood is comprised of Bloomsbury, Holborn & Covent Garden and King’s Cross wards.
Introduction
This is a summary profile of Camden’s South neighbourhood which comprises of three wards - Bloomsbury, Holborn & Covent Garden and King’s Cross. It includes data on the neighbourhood’s demography, levels of deprivation, and key health indicators such as life expectancy and prevalence of long-term conditions.
The South neighbourhood has high levels of economic inactivity, which may be reflective of the large student population living in this part of the borough.
It also has relatively high levels of overcrowded housing. Despite generally good access to green spaces, the South of the borough experiences the highest exposure to air pollution.
The South neighbourhood has the highest proportions of households with children living in relative poverty.
In addition to large Bangladeshi populations in Holborn & Covent Garden and Kings Cross, there are significant Chinese populations in Bloomsbury and King’s Cross.
Ward level profiles are available in the following pages:
Demography
Population
The London Borough of Camden has approximately 219,900 residents according to the latest population projections. Of this total, 36,700 reside in the South neighbourhood, making it the neighbourhood with the lowest number of residents. There are 18,900 female residents and 17,700 male residents in the South neighbourhood.
Age
Children and young people (0-24 years old) make up 40.28% of the population of the South neighbourhood which is more than Camden overall (30.85%). Additionally, the percentage of older adults aged 65+ years is 9.3% compared to 12.02%.
Overall the South neighbourhood has significantly higher proportions of working age young people in their twenties, possibly due to the substantial student population in this area. Although this makes it appear that the age profile of this neighbourhood is younger, there are lower percentages of children and young people compared to Camden.
Ethnicity
The following data uses the Office of National Statistics (ONS) ethnicity classifications. When looking at the broader ethnicities (e.g. ‘Asian’ instead of ‘Asian: Indian’), the most frequently reported ethnicity in the South neighbourhood is White (50.41%), which is lower than Camden (59.52%). Additionally, this neighbourhood exhibits higher proportions of residents identifying as Asian, and Mixed.
This ward has a similar ethnicity profile to Camden.
Wider Determinants of Health
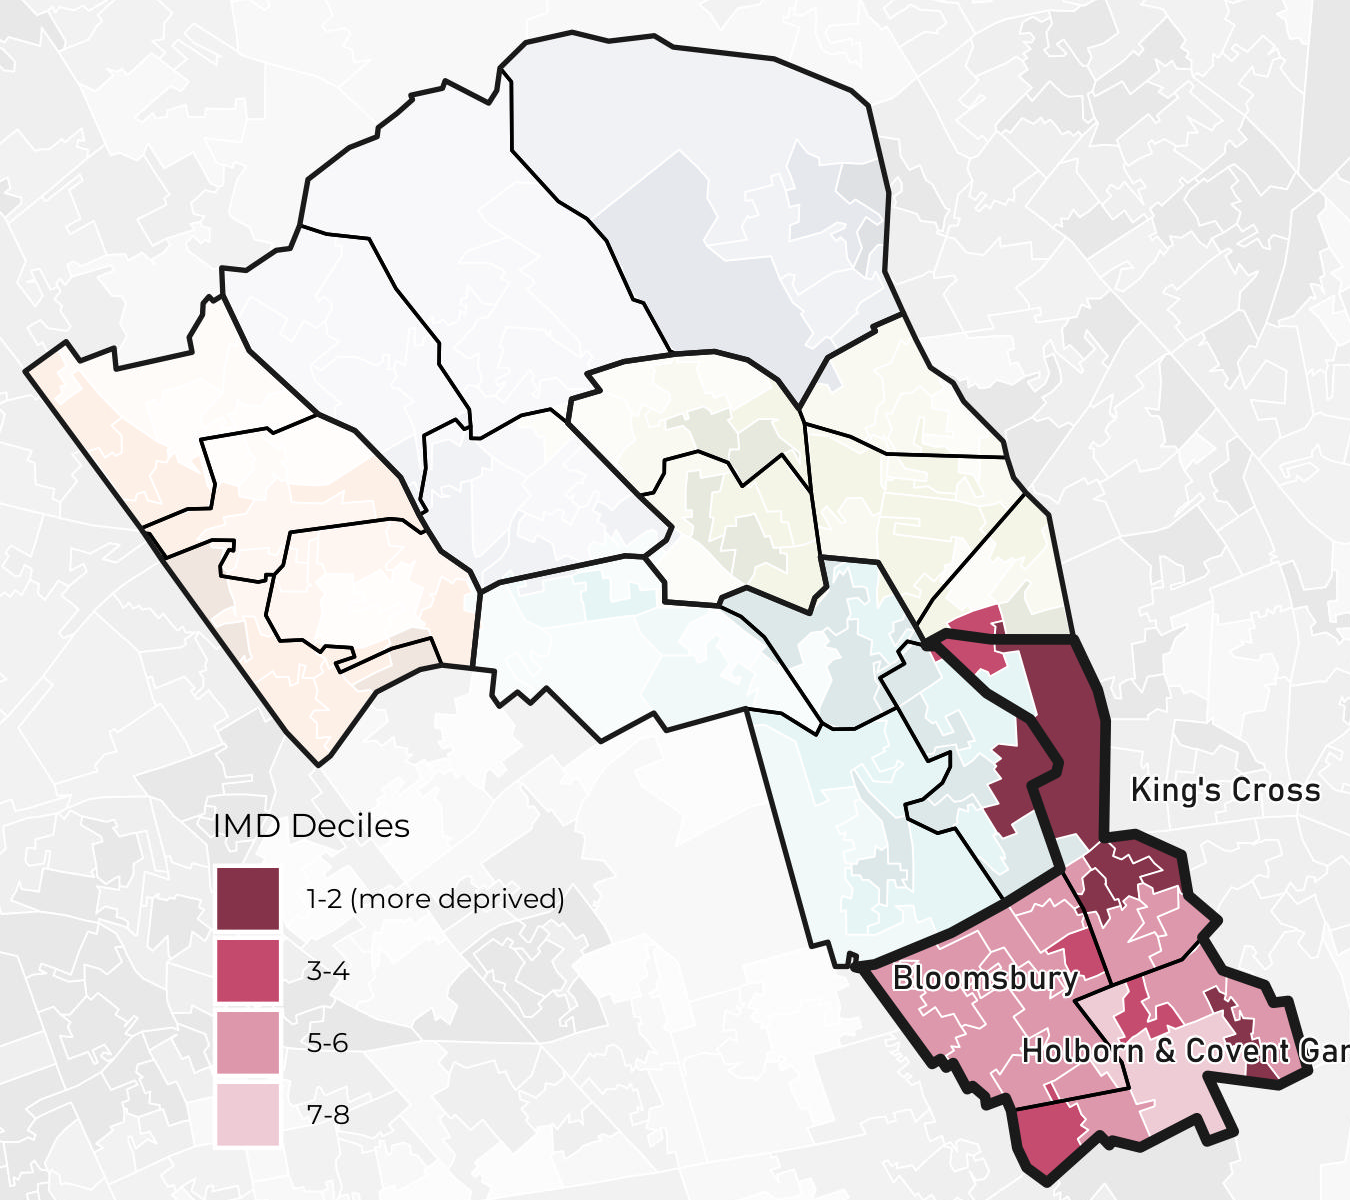
Index of Multiple Deprivation
King’s Cross ward has higher deprivation compared to other wards in the neighbourhood while Holborn & Covent Garden has the most variability between LSOAs.
The most deprived LSOAs in the South neighbourhood neighbourhood according to IMD deciles are in King’s Cross, and Holborn & Covent Garden (decile 2) while the least deprived LSOAs are in Holborn & Covent Garden (decile 7).
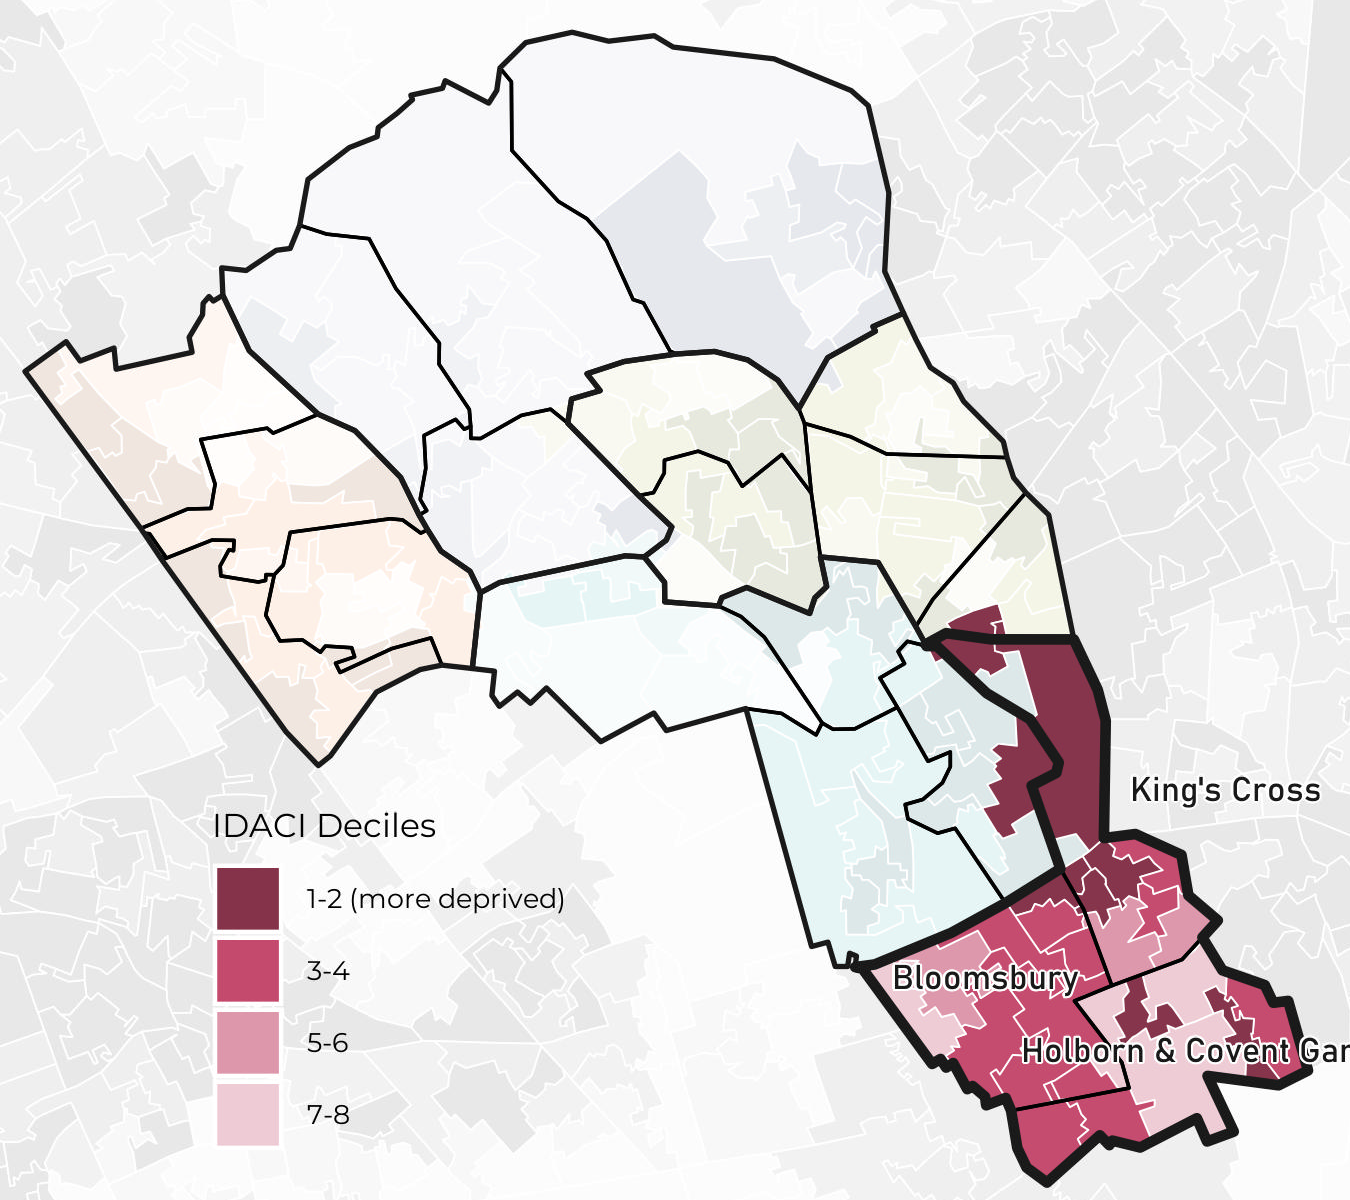
The most deprived LSOAs in the South neighbourhood neighbourhood according to IDACI (Income Deprivation Affecting Children Index) deciles are in Holborn & Covent Garden, and King’s Cross (decile 1) while the least deprived LSOAs are in Bloomsbury (decile 8).

The most deprived LSOAs in the South neighbourhood neighbourhood according to IDAOPI (Income Deprivation Affecting Older People Index) deciles are in King’s Cross, Holborn & Covent Garden, and Bloomsbury (decile 1) while the least deprived LSOAs are in Bloomsbury (decile 7).
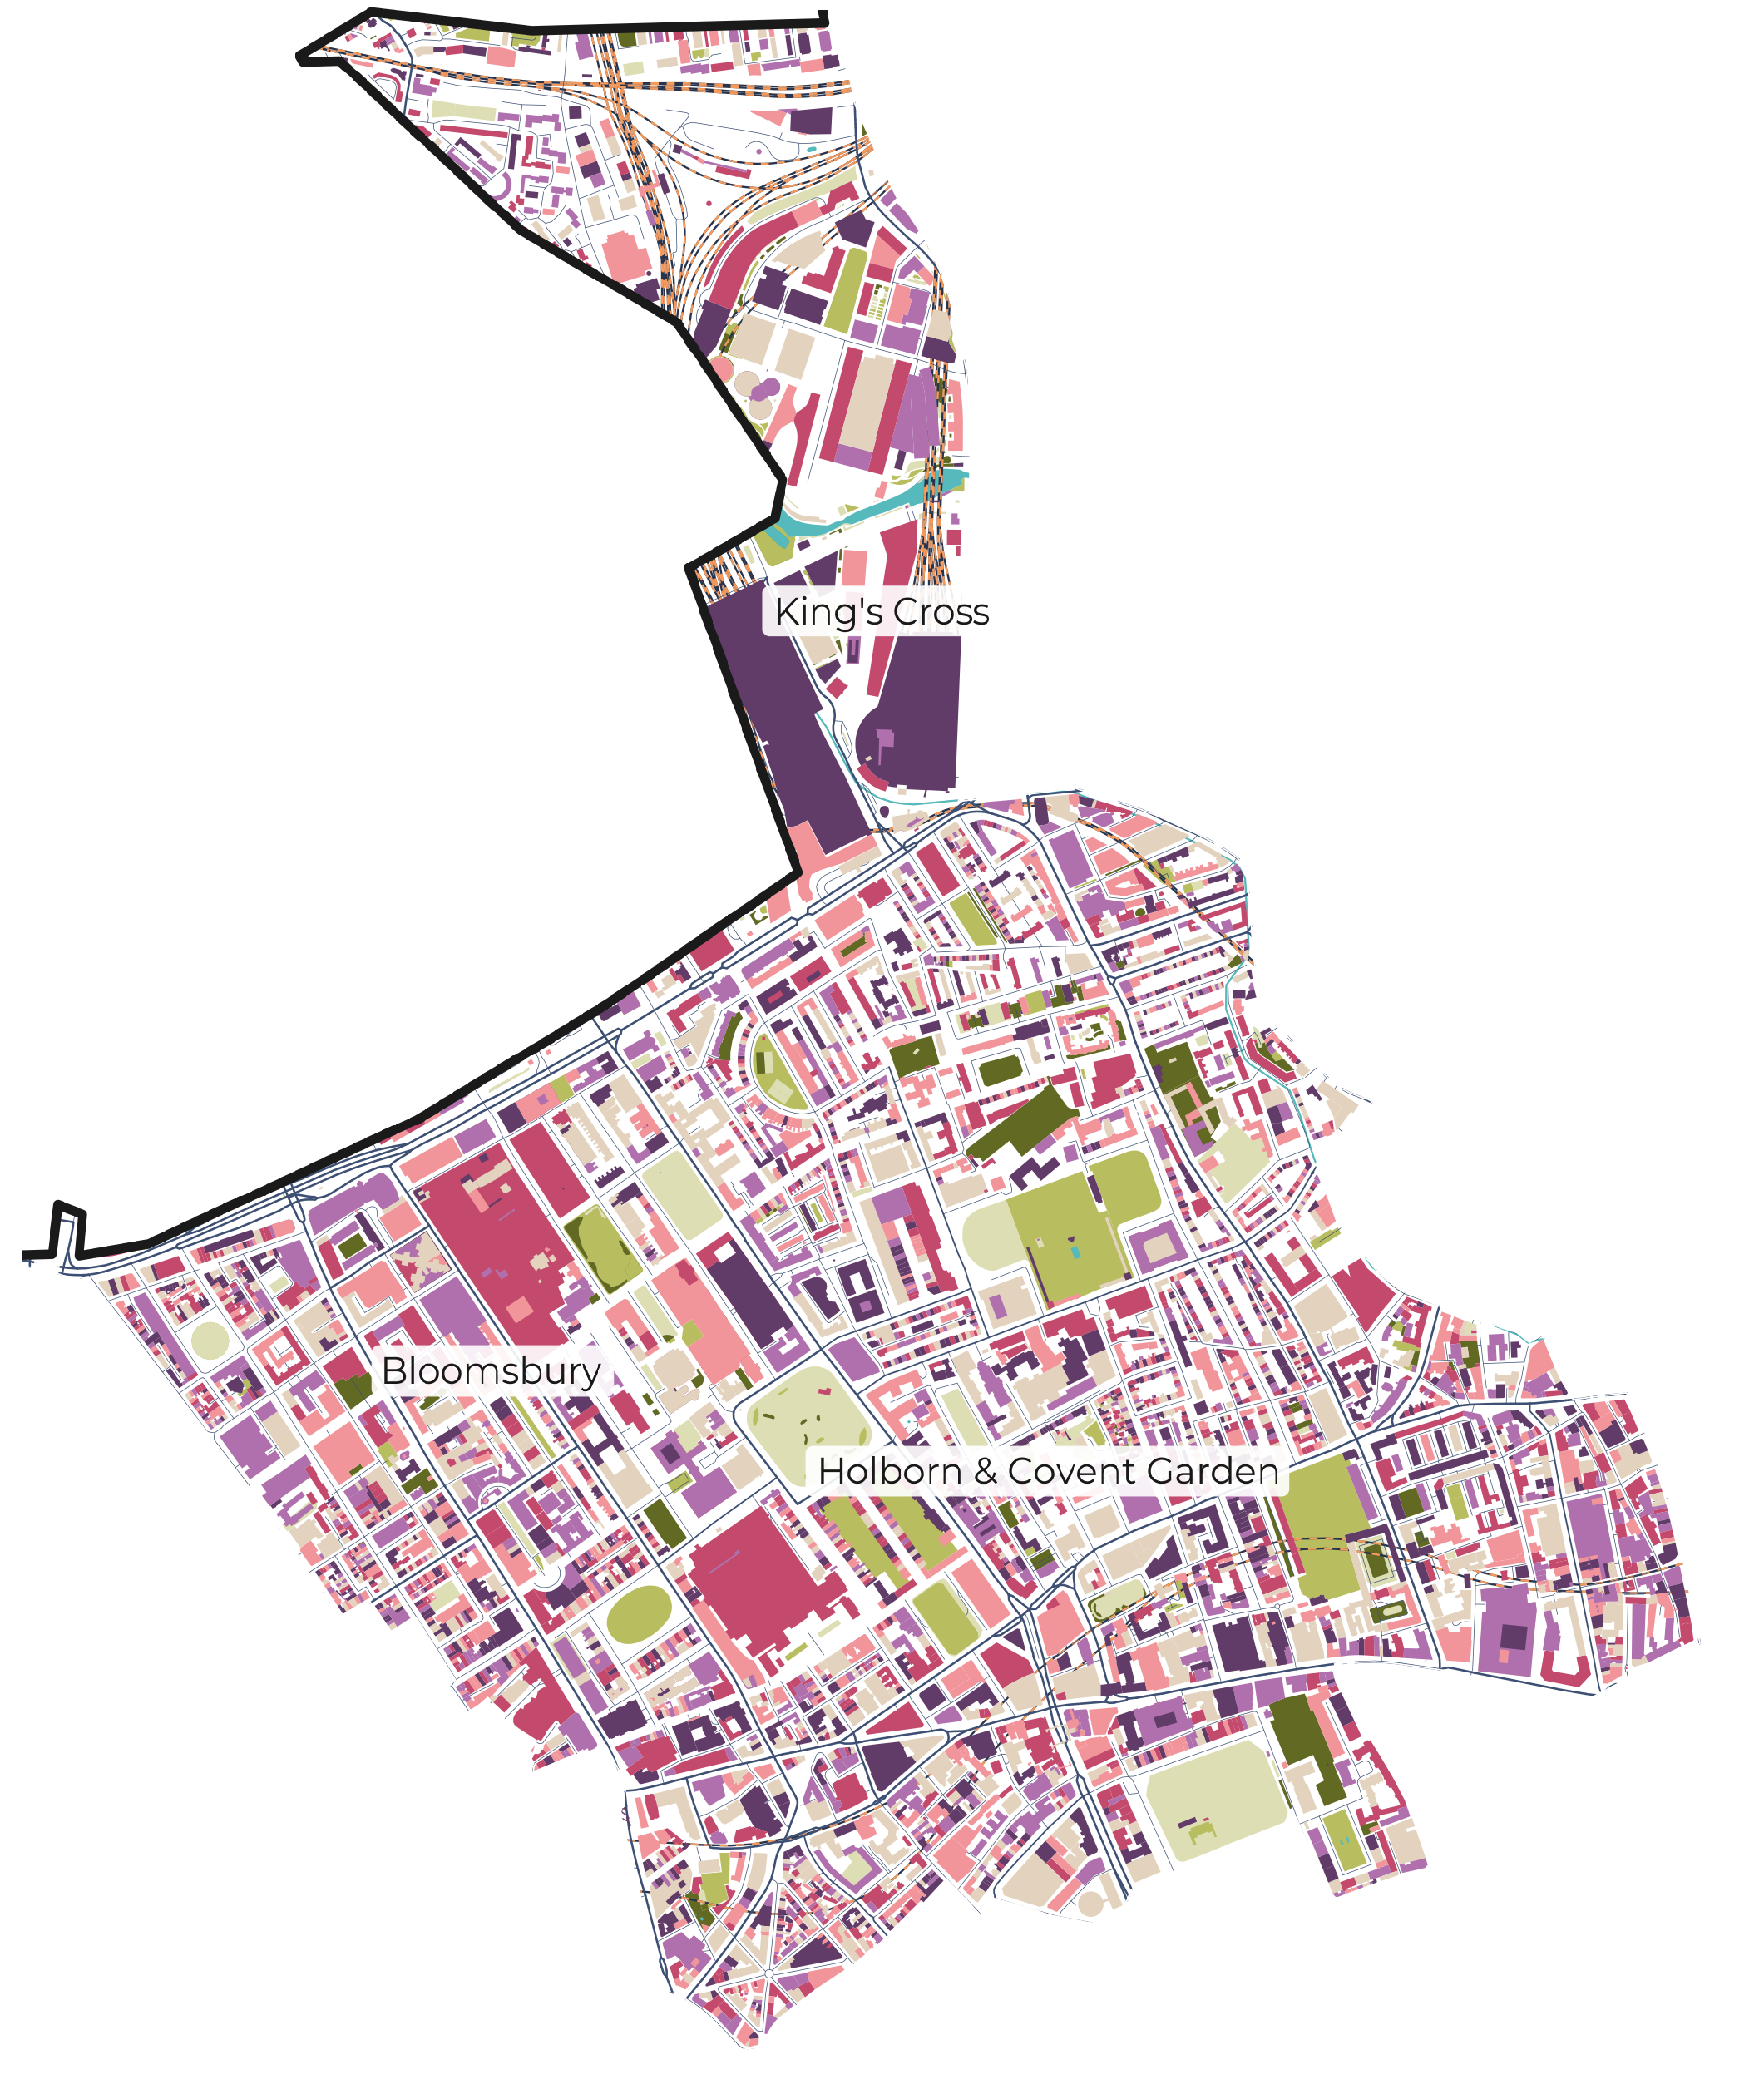
Environment
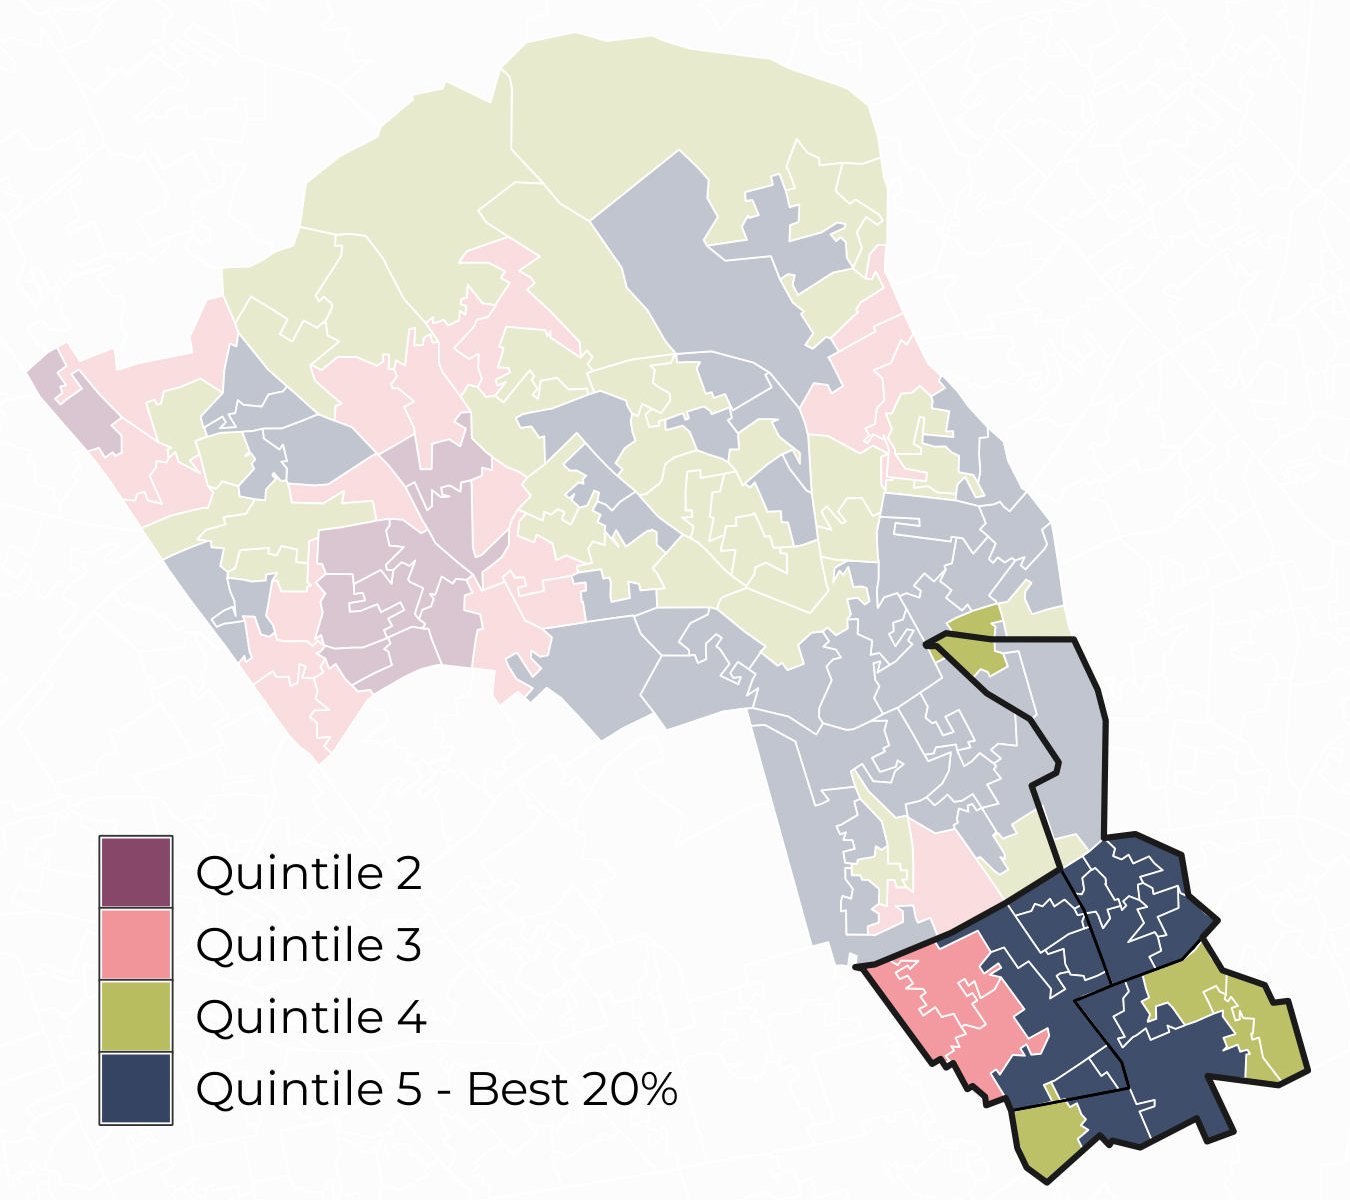
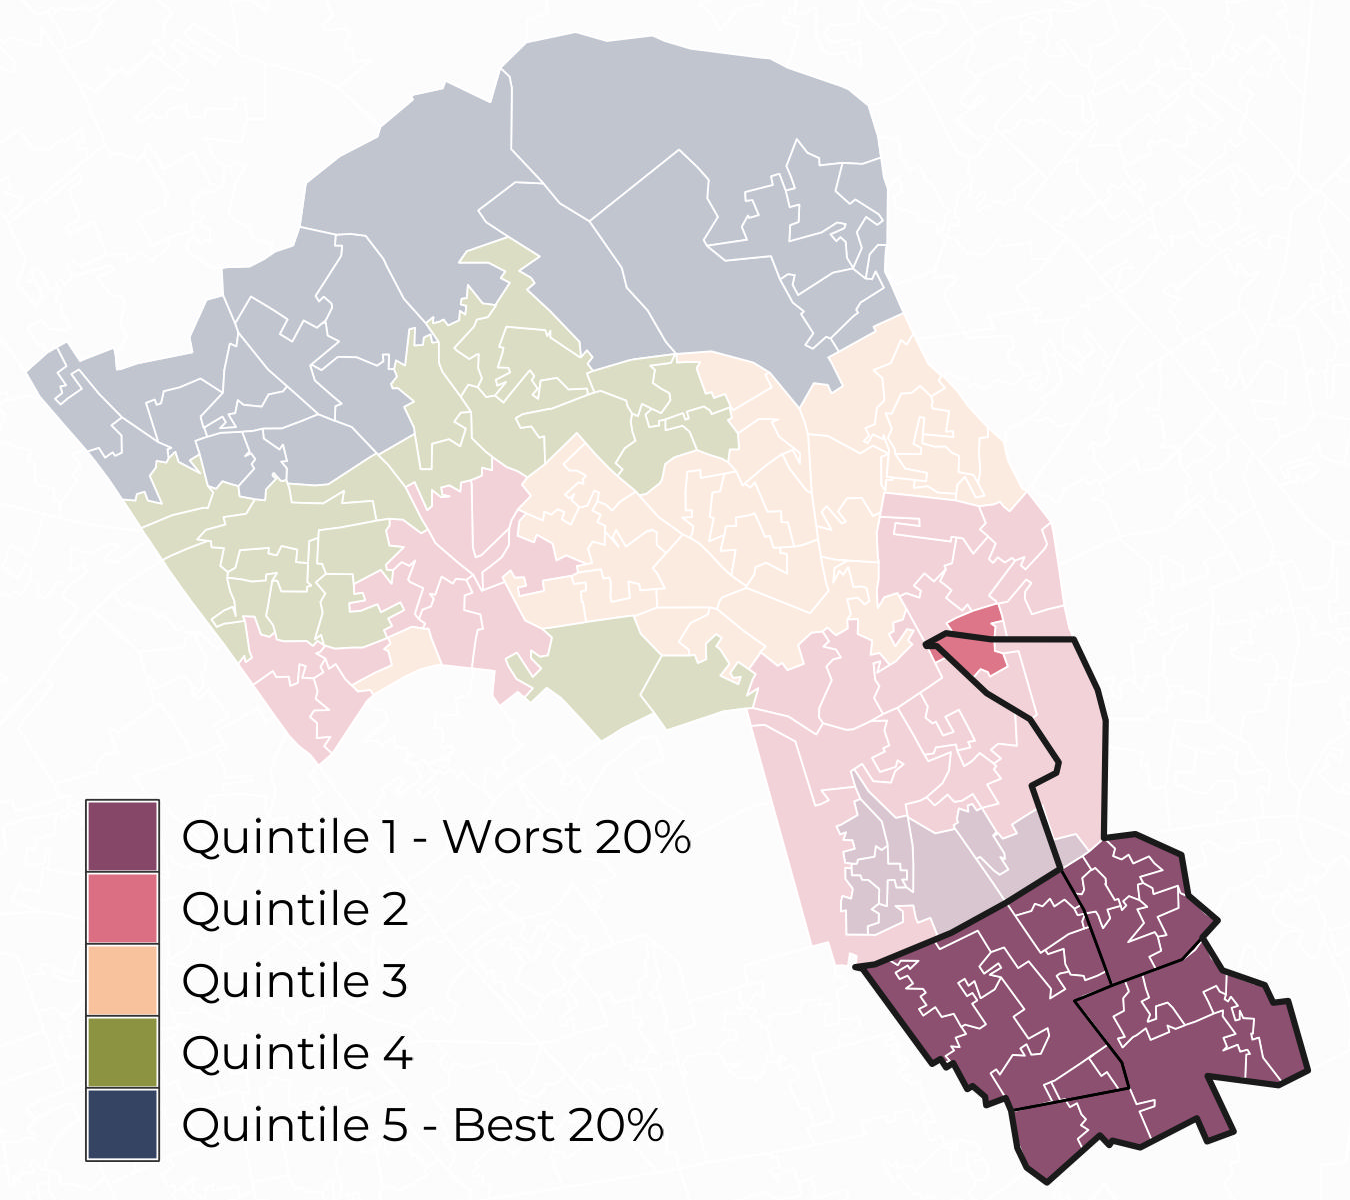
The place in which we live plays a key role in our health and wellbeing and is an important factor in the wider determinants of health. Access to green spaces and air quality indicators are presented below.
Most Lower Super Output Areas (LSOA) in the South neighbourhood sit within Quintile 5 for access to green spaces and within Quintile 1 for air quality.
Behavioural risk factors and long-term conditions
Behavioural risk factors
The most prevalent behavioural risk factor in the South neighbourhood is Smoking (11.68%). The South neighbourhood has a statistically significant lower prevalence of Alcohol Abuse or Dependence, Smoking and Obesity compared to the rest of the borough.
Long-term conditions
The most prevalent long-term conditions in the South neighbourhood are Depression (9.87%), Hypertension (6.72%), Diabetes (3.2%), and Asthma (2.76%). The South neighbourhood has statistically significant higher prevalence of compared to the rest of the borough.
Mental health
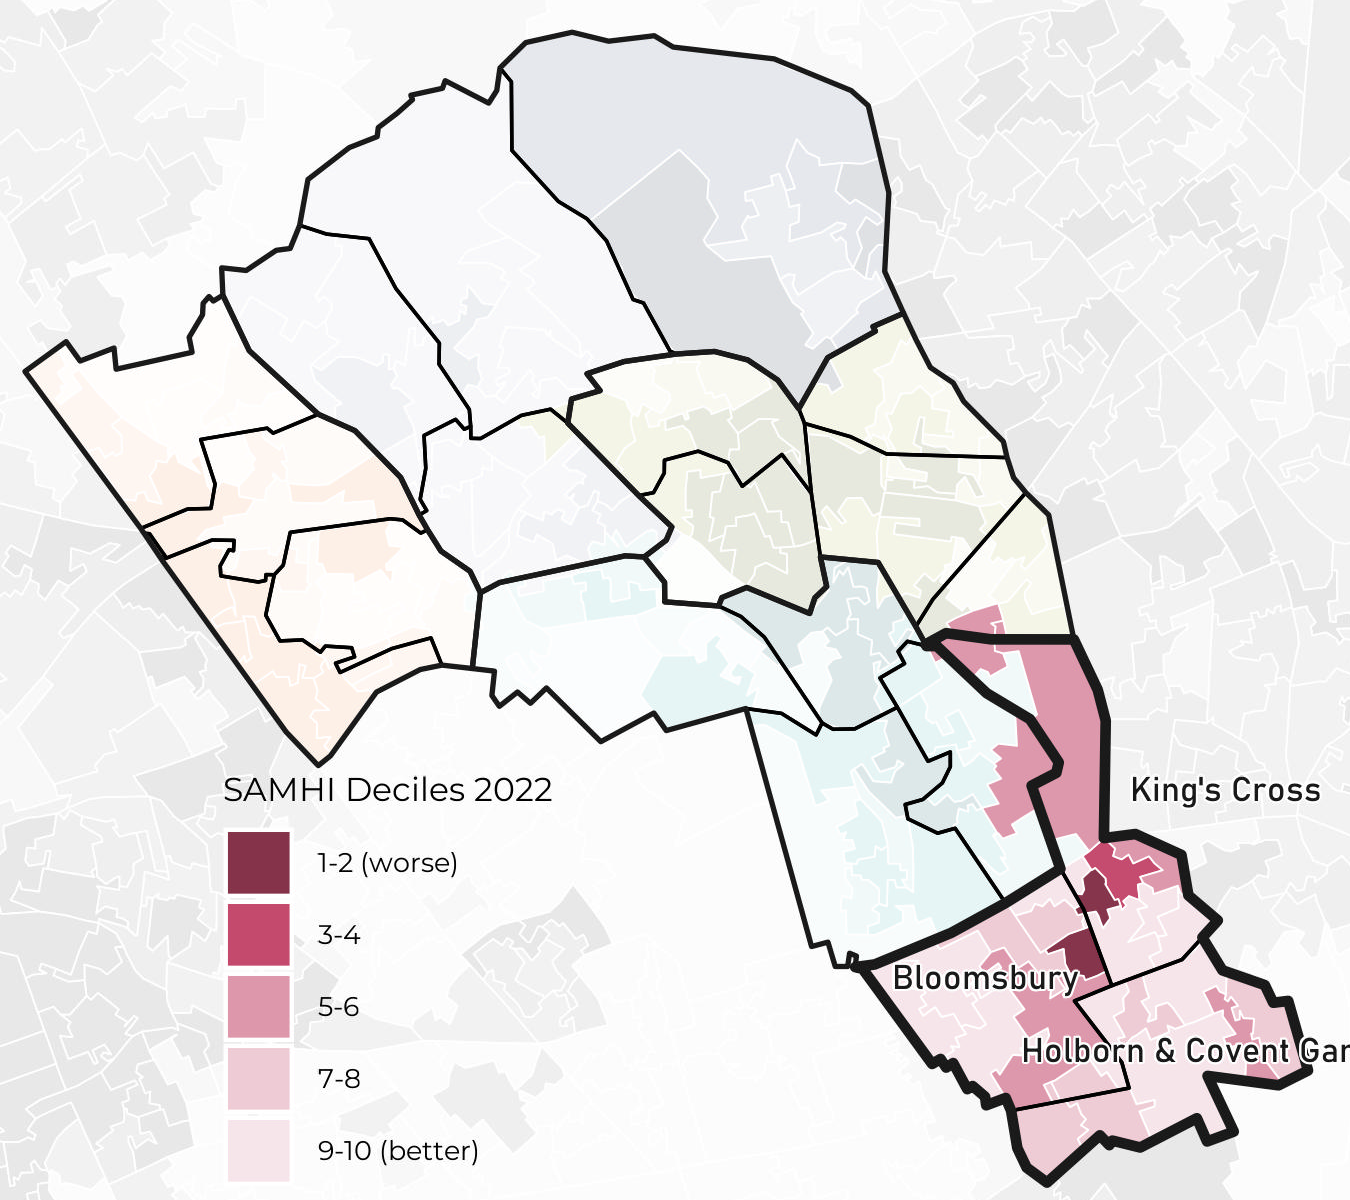
In addition to reporting the prevalence of depression and serious mental illness (SMI), the NIHR Small Area Mental Health Index (SAMHI) can be used to examine geographical variation in mental health-related indicators at the LSOA level within the area.
The South neighbourhood has relatively better SAMHI scores compared to the other neighbourhoods.
The worst LSOAs in the South neighbourhood neighbourhood according to SAMHI deciles are in Bloomsbury (decile 1) while the best LSOAs are in Bloomsbury, and King’s Cross (decile 10).