Introduction
This JSNA Profile provides a concise overview of characteristics of those who live in Camden. It presents data on the size and structure of the population, and a range of groups within it, for example different ethnic groups, as well as projections of how the population may change in the future.
Population
Camden’s population has grown but is expected to stabilise
There are around 219,900 people living in Camden in 2025 based on projections from the Greater London Authority. The population is expected to remain broadly stable in the future.
The south and west of Camden are the most populous areas of the borough
St Pancras & Somers Town, Primrose Hill and Bloomsbury are the wards with the largest population. Camden Town, Kentish Town North and Camden Square are the wards with the smallest population.
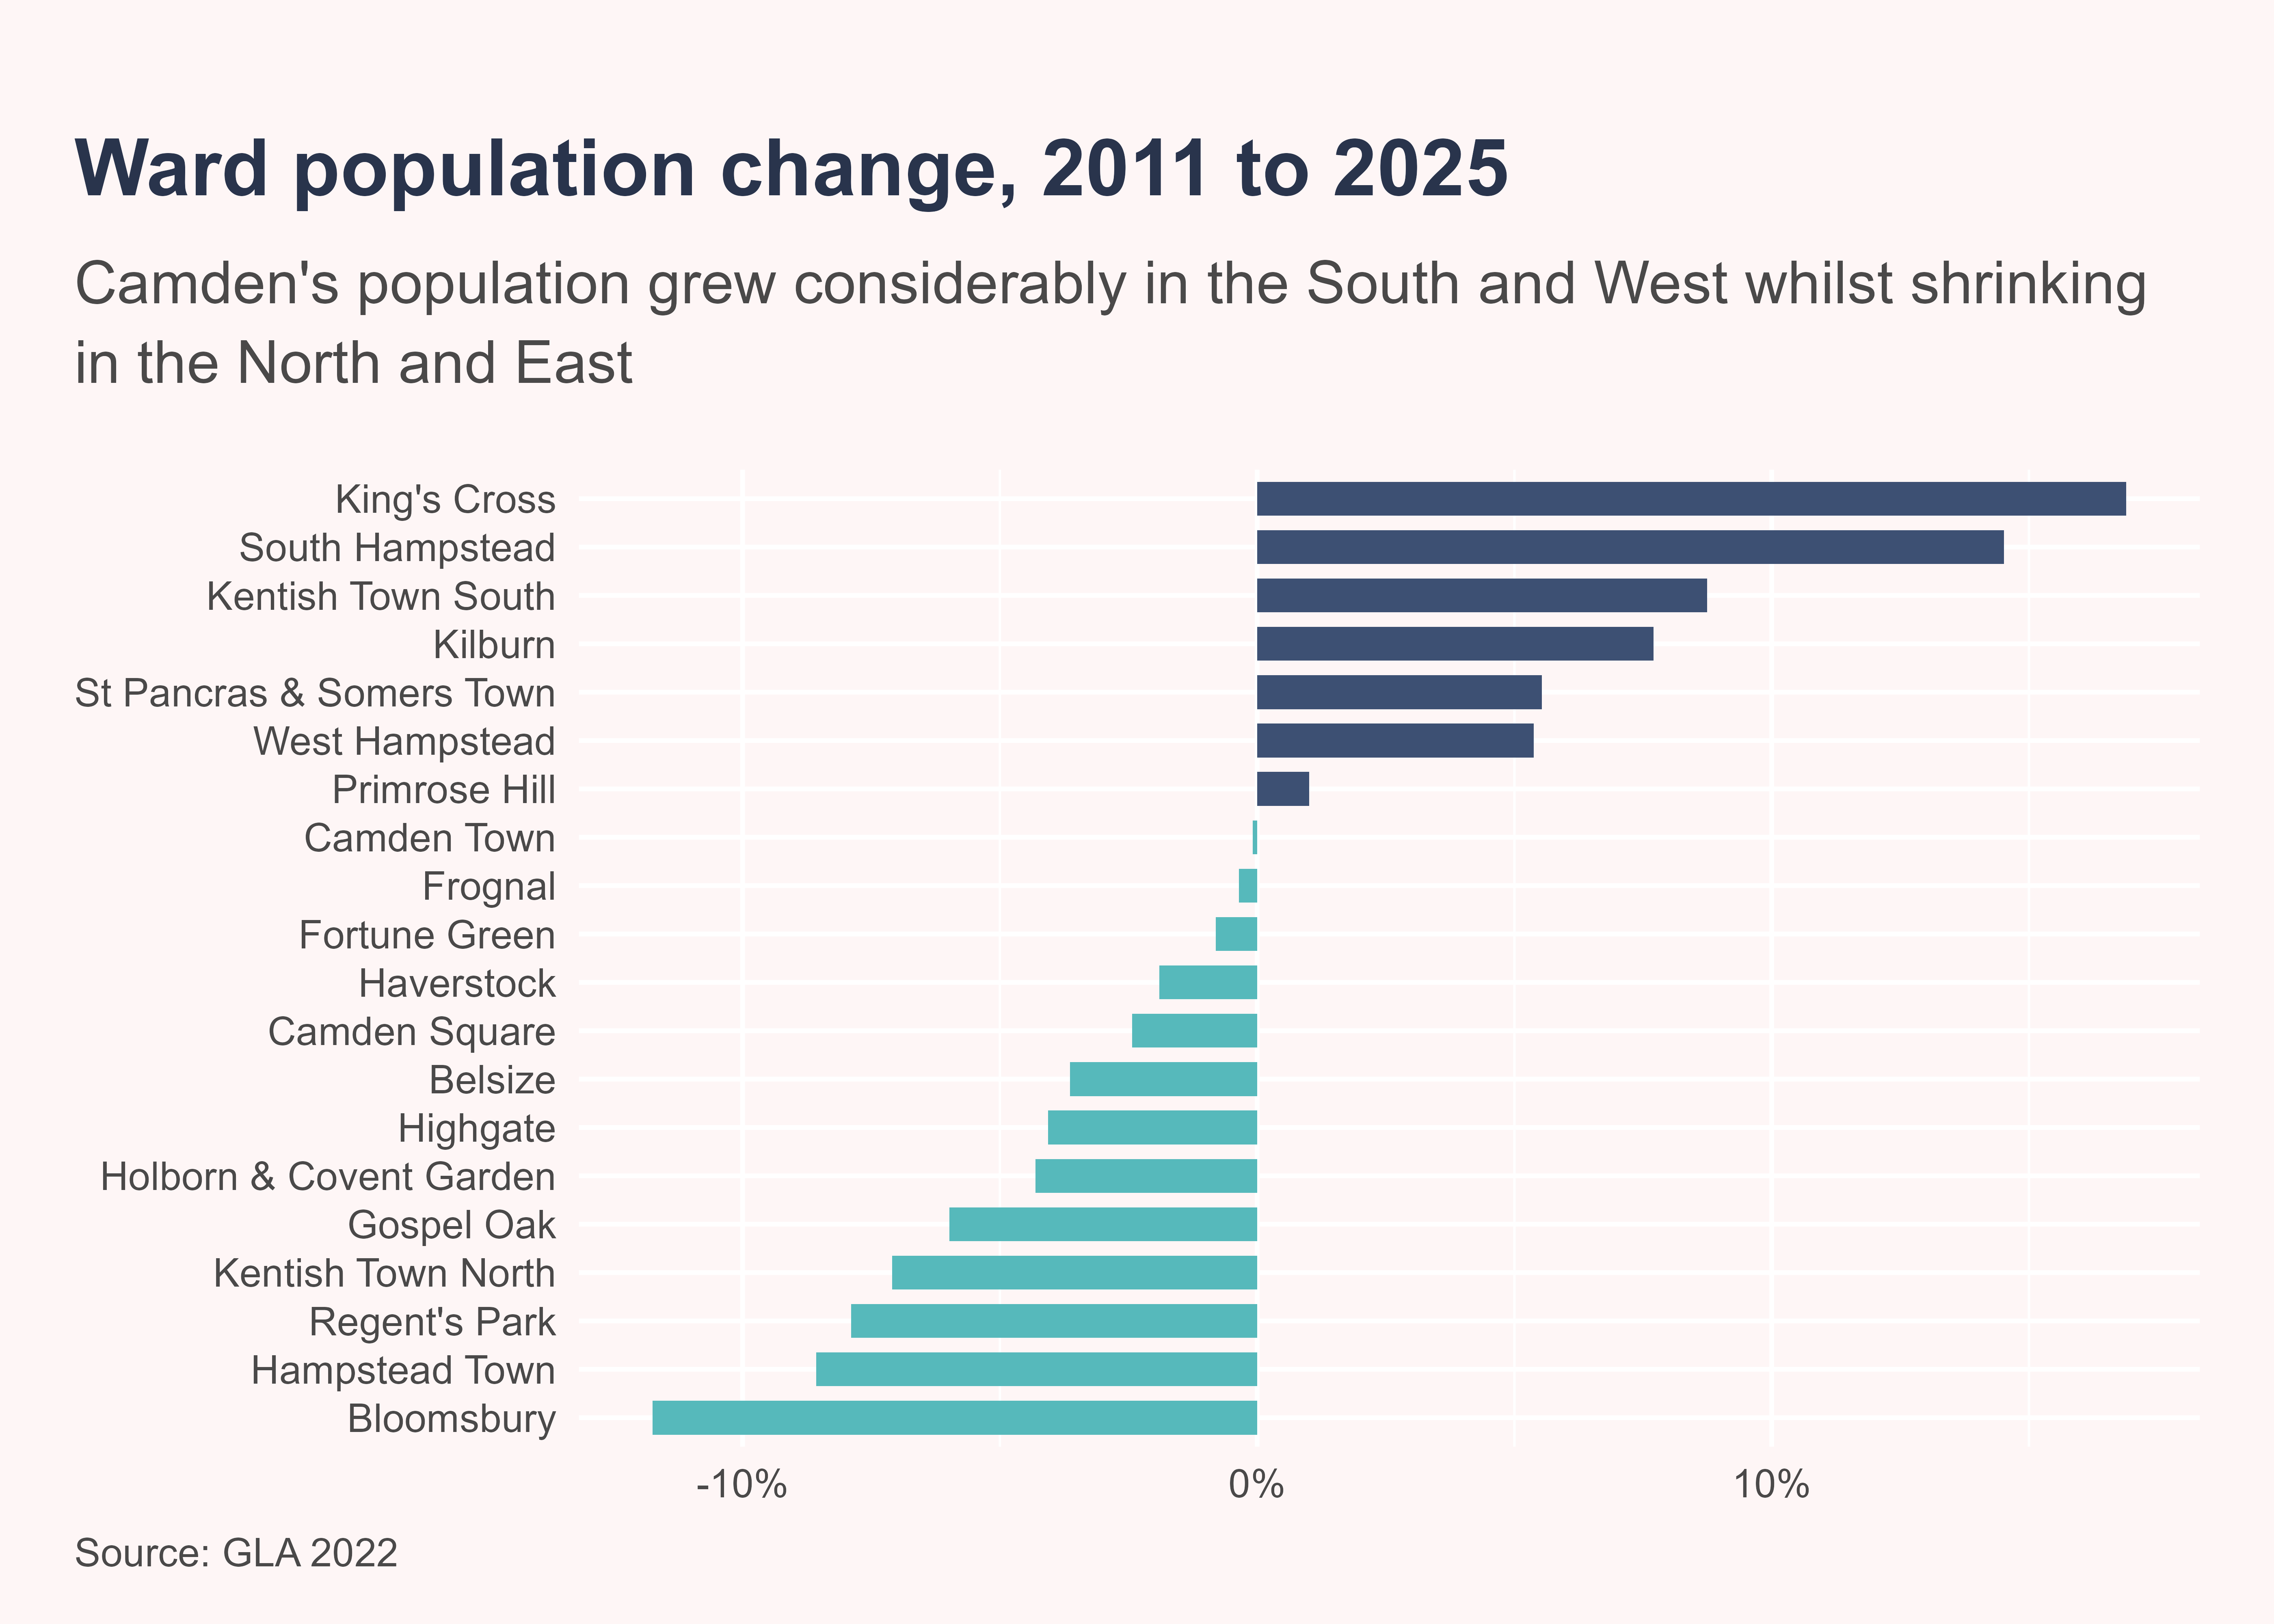
This has been driven by large changes in where people live in Camden
Between 2011 and 2025, the population increased the most in King’s Cross, South Hampstead and Kentish Town South. The population shrunk the most in Bloomsbury, Hampstead Town and Regent’s Park.
Camden’s population is ageing, though young adults will remain the largest group
The composition of Camden’s population has changed considerably and this is expected to continue. Between 2013 and 2023 the proportion of residents aged under 18 fell from 18% to 16% and it is expected to fall further to 13% by 2041. Conversely, the proportion of residents aged 65 and over is expected to rise from 12% in 2023 to 15% by 2041. The proportion of the population of working is age is expected to remain relatively constant.
Ethnicity
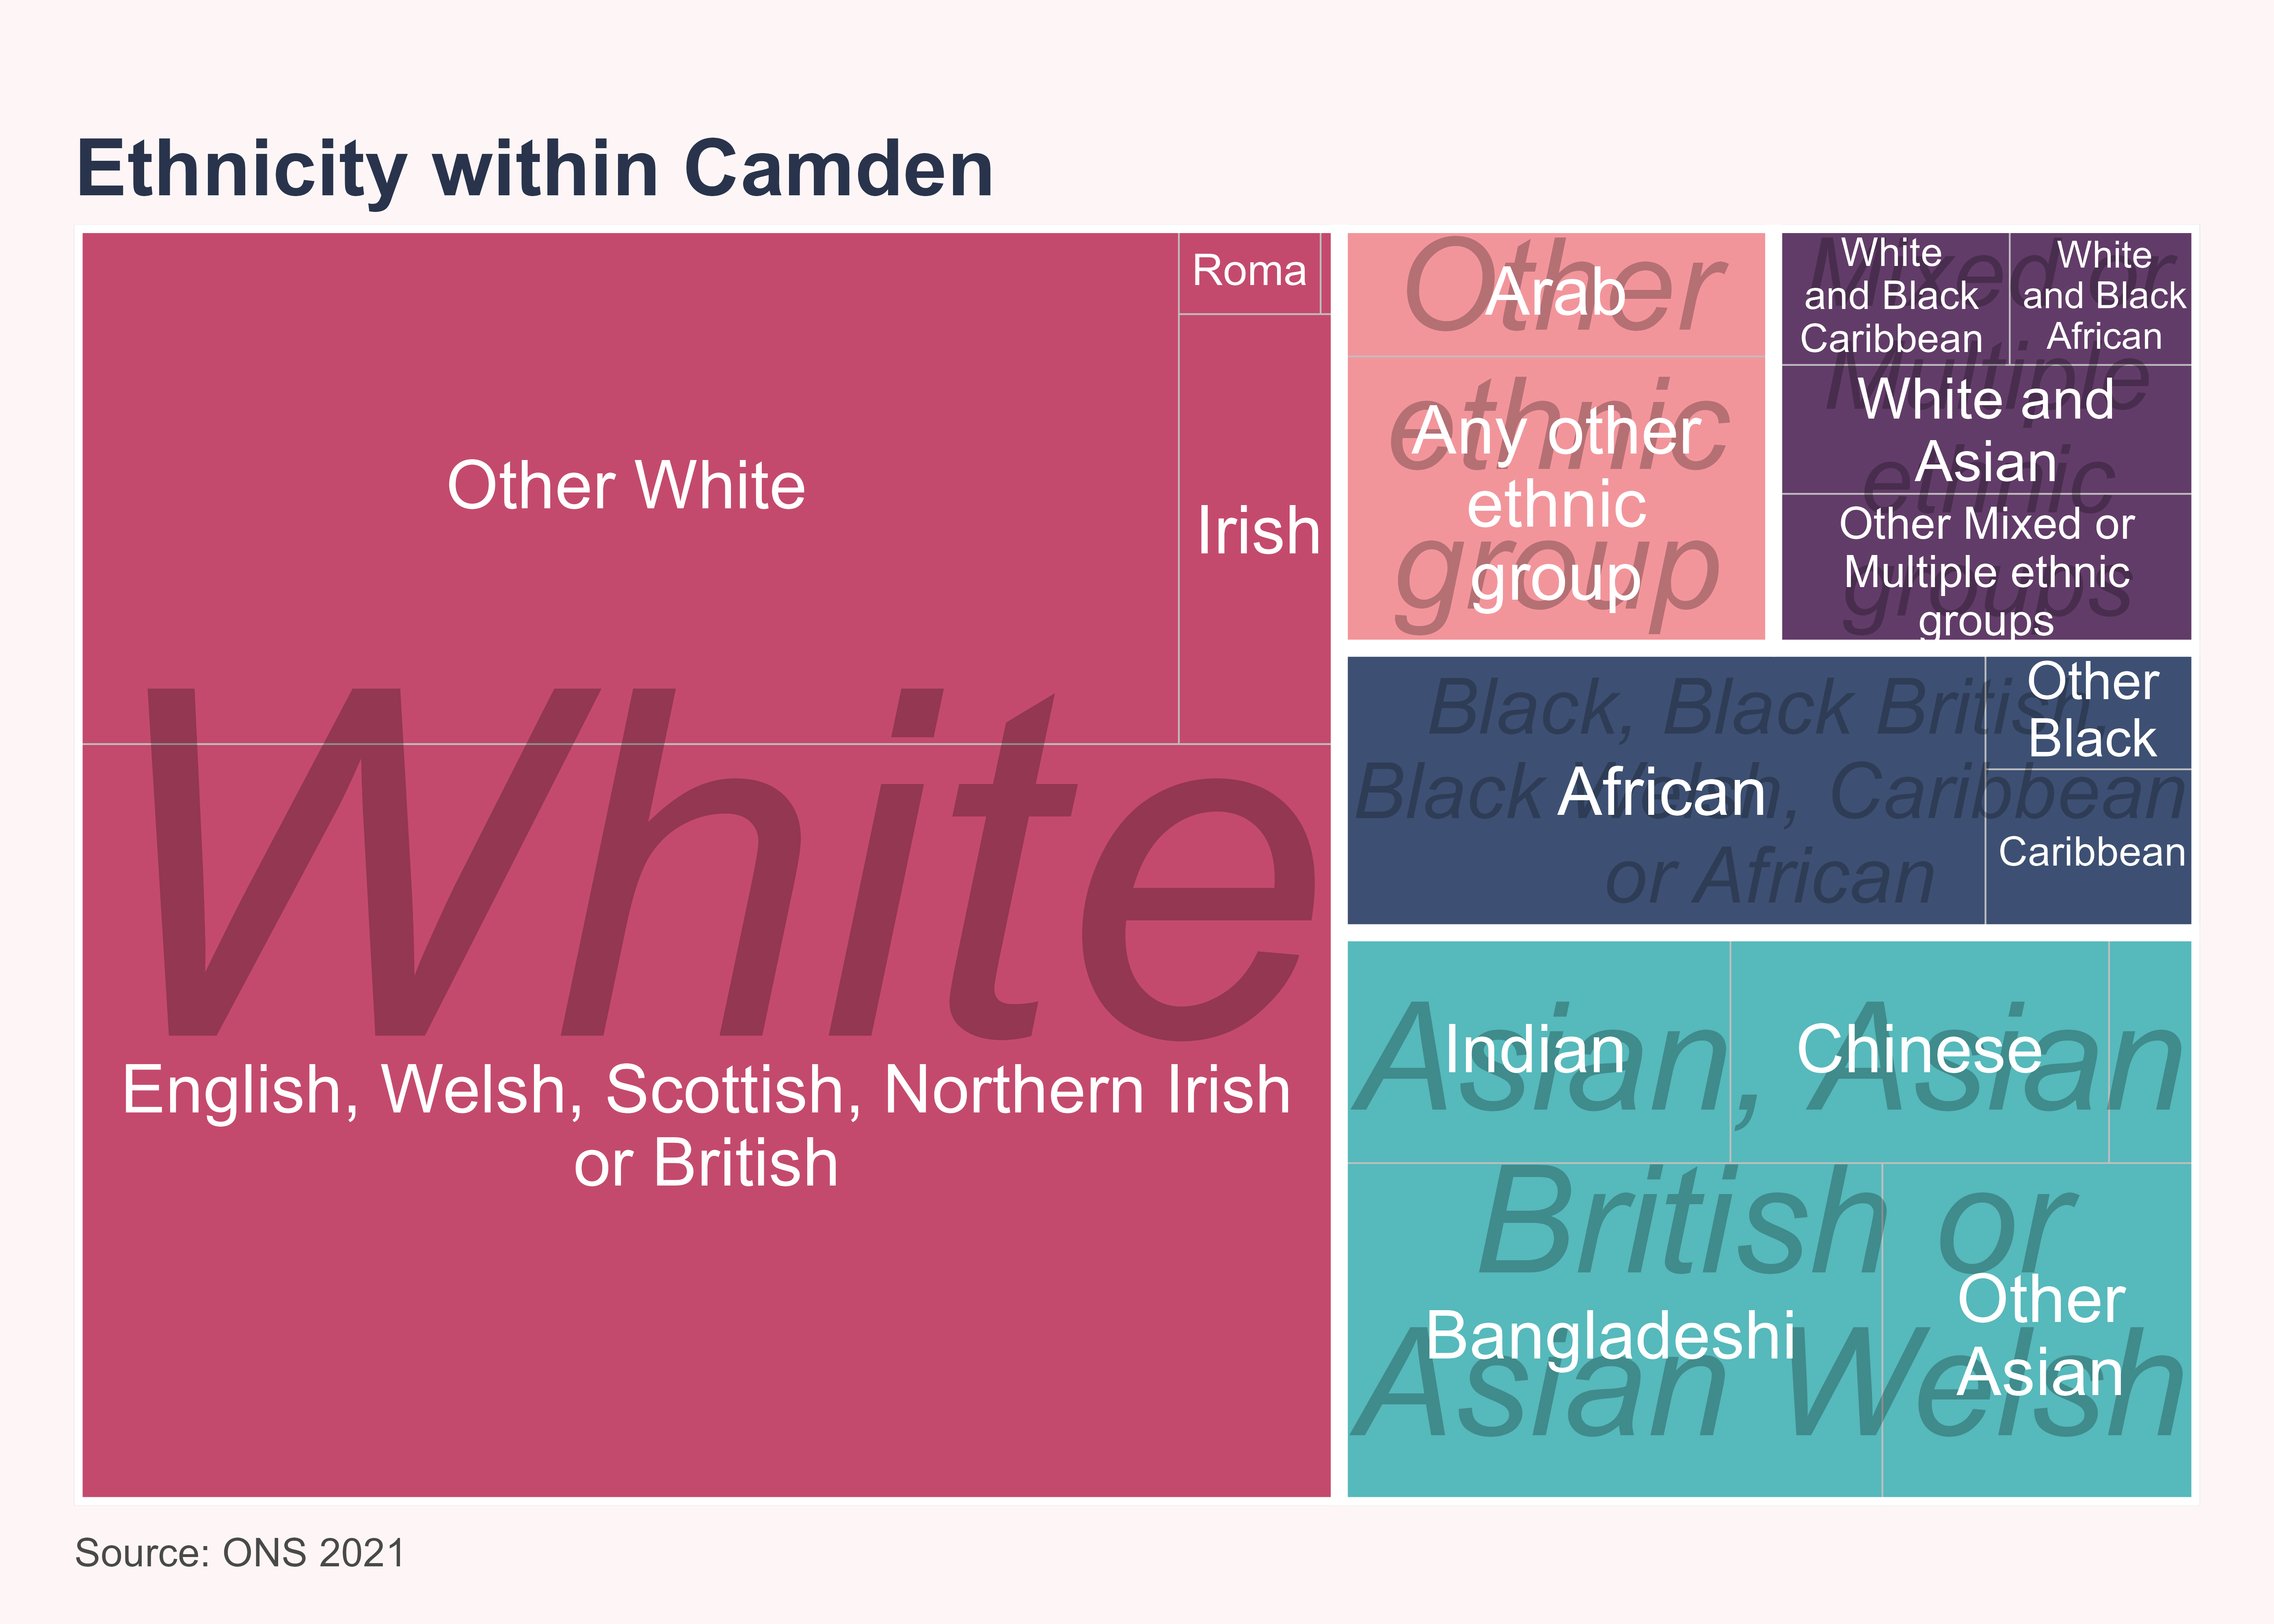
Camden’s is one of the most diverse places in the country, though the majority of the population identify as White
Around 60% of Camden’s population are White, 20% are Asian, Asian British or Asian Welsh, 9% are Black, Black British, Black Welsh, Caribbean or African, 7% have Mixed or Multiple ethnic groups and 7% belong to Other ethnic groups. Within these broad ethnic groups, White British (40%) and White Other (20%) are the largest. Bangladeshi (7%) and African (7%) are other sizeable ethnic groups in Camden.
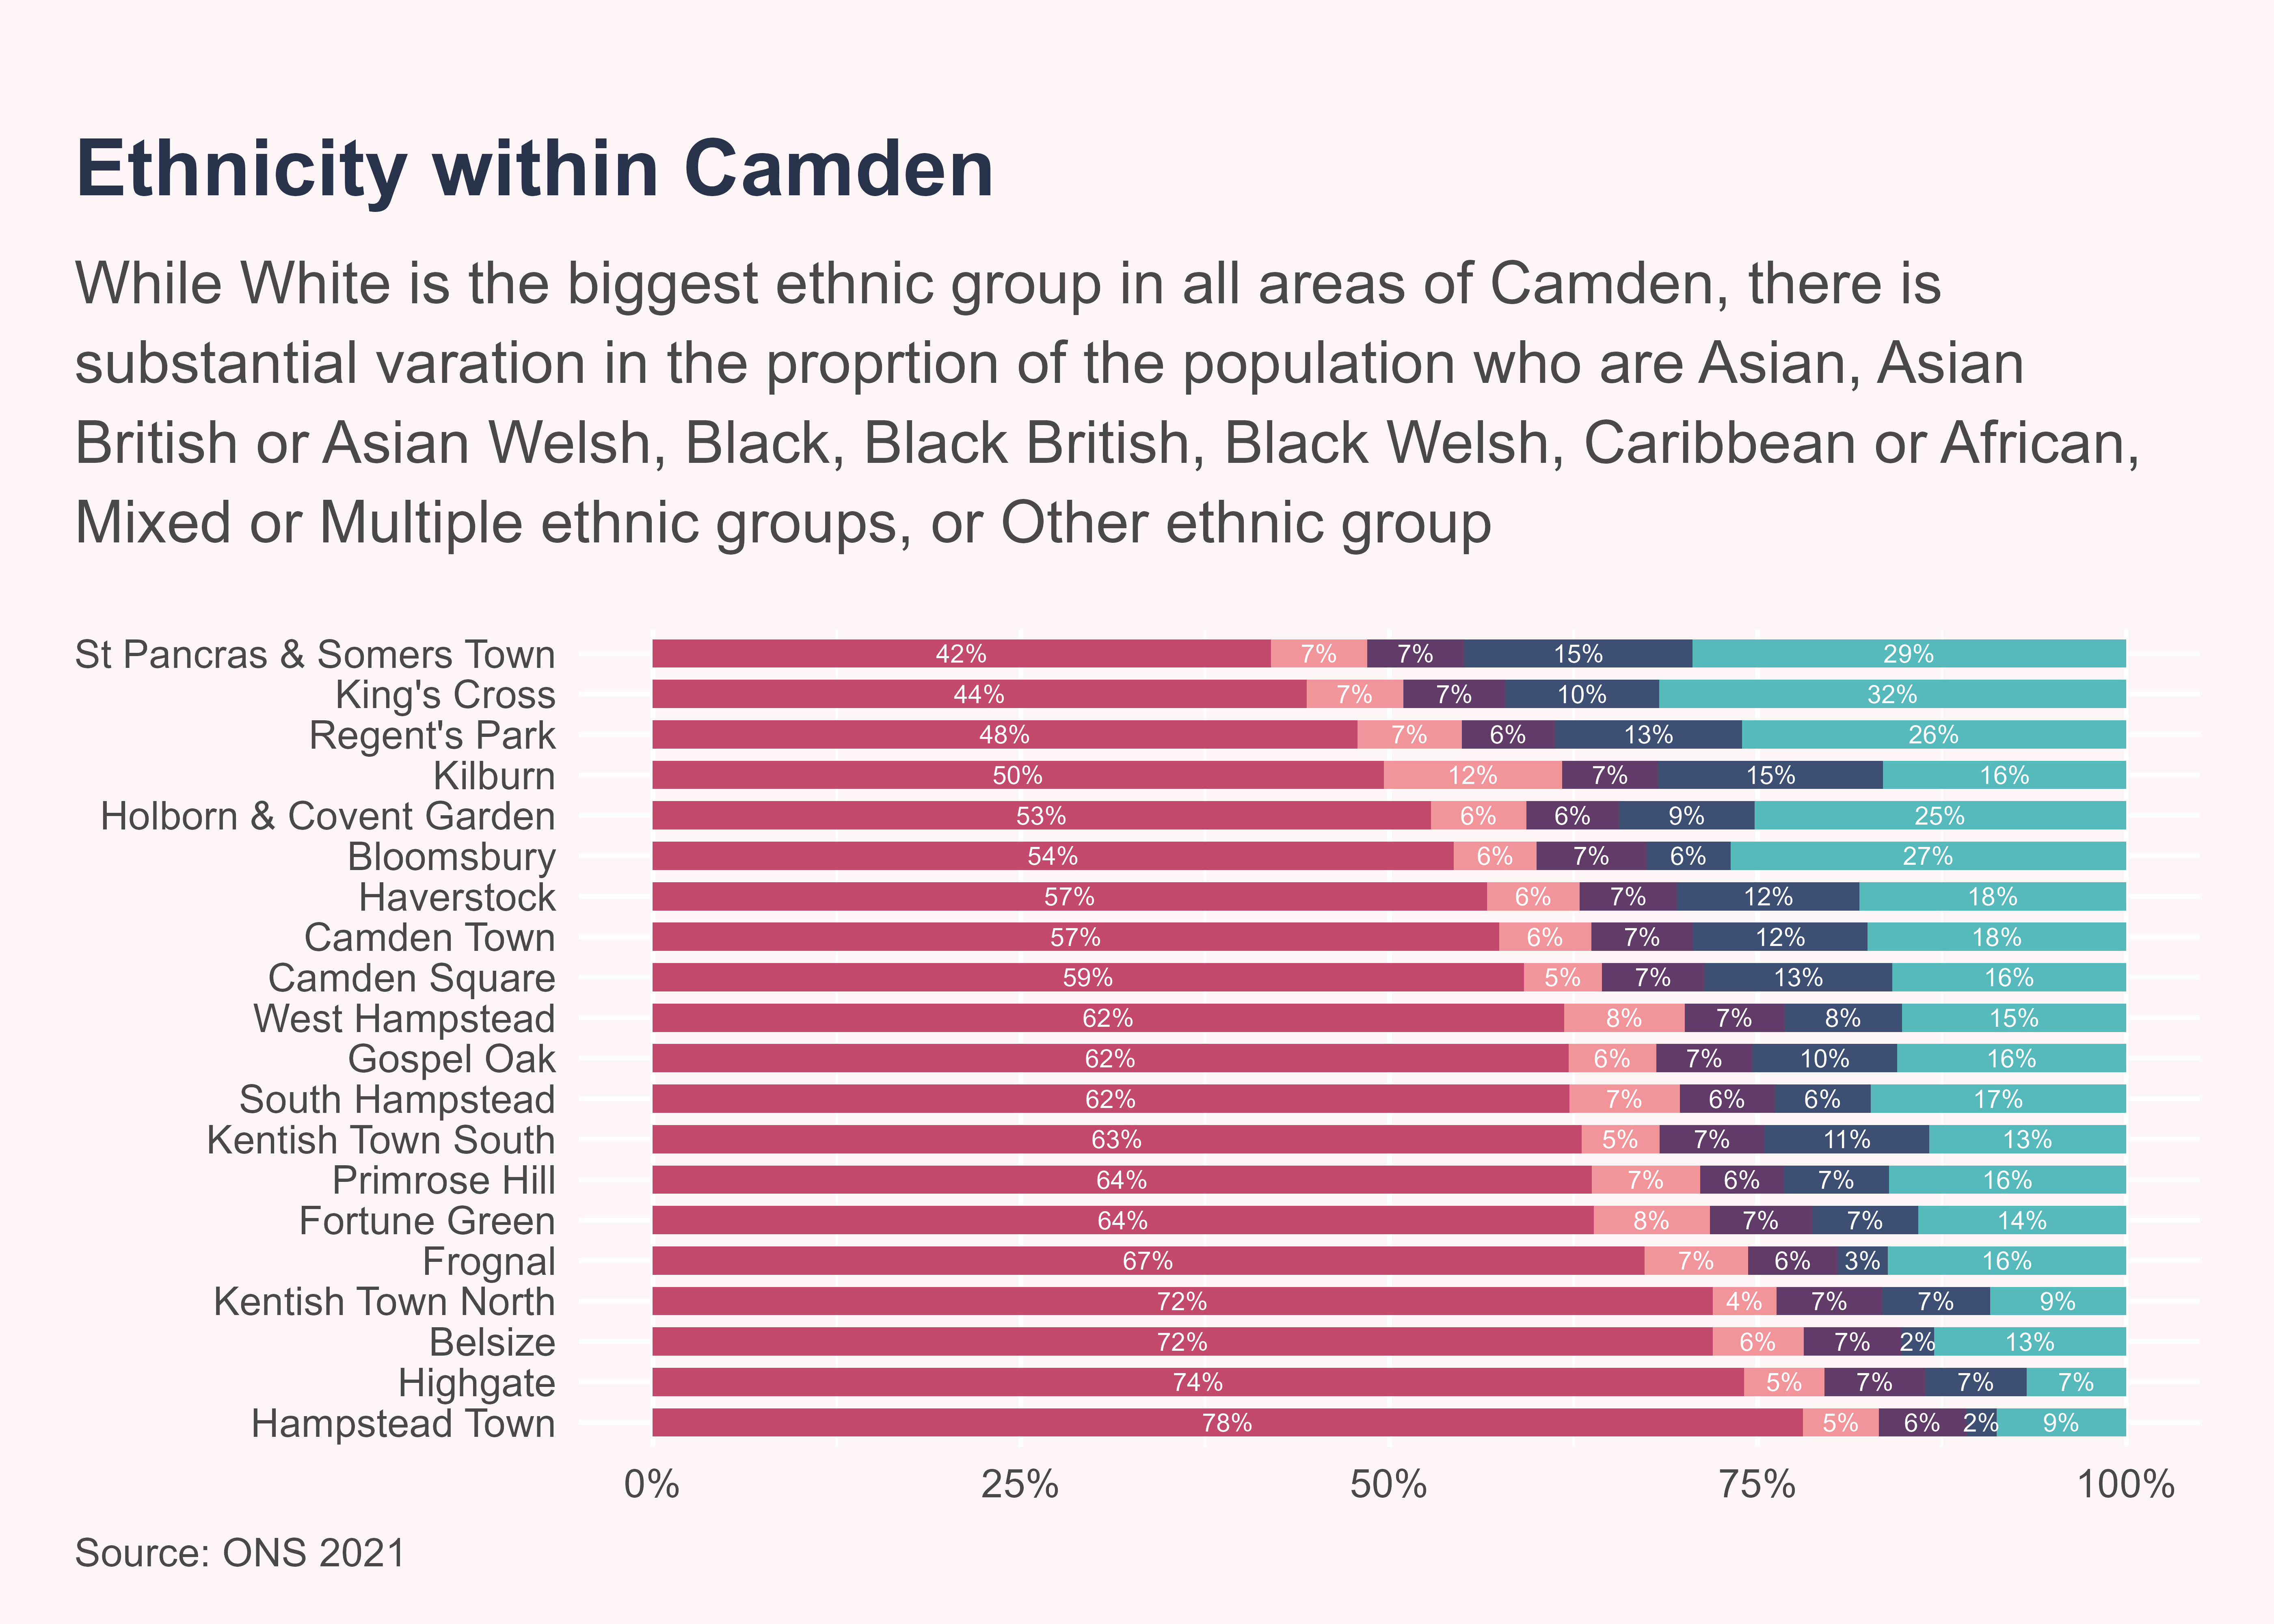
Ethnicity varies substantially within Camden, with some areas being much more diverse than others
Generally wards in the South and West tend to have greater diversity whilst those in the North tend to have a higher proportion of the population identifying as White.
Migration
There is a high population turnover with many people moving in out and of Camden
According to the 2021 Census, 26,376 people moved out of Camden to elsewhere in the UK and 22,549 moved to Camden from within the UK in the year before the Census. Most of the moves within the UK were within London. There were also 8,196 people who moved from outside of the UK to Camden. This compares to 177,355 people who remained in Camden during the period.
The Census does not include information on people who left Camden to move outside of the UK in the last year. The GLA report that net migration is negative, i.e. more people are moving out than in. This is the opposite of the Census, suggesting there may be a substantial number of people moving out of Camden to other countries.
Camden residents come from all around the world
Nearly half (54.6%) of Camden residents were born outside of the UK. This includes 18.1% from Europe, 13.7% from Middle East and Asia, 6.2% from Africa, and 6% from The Americas and the Caribbean.
Language
Many languages are spoken in Camden
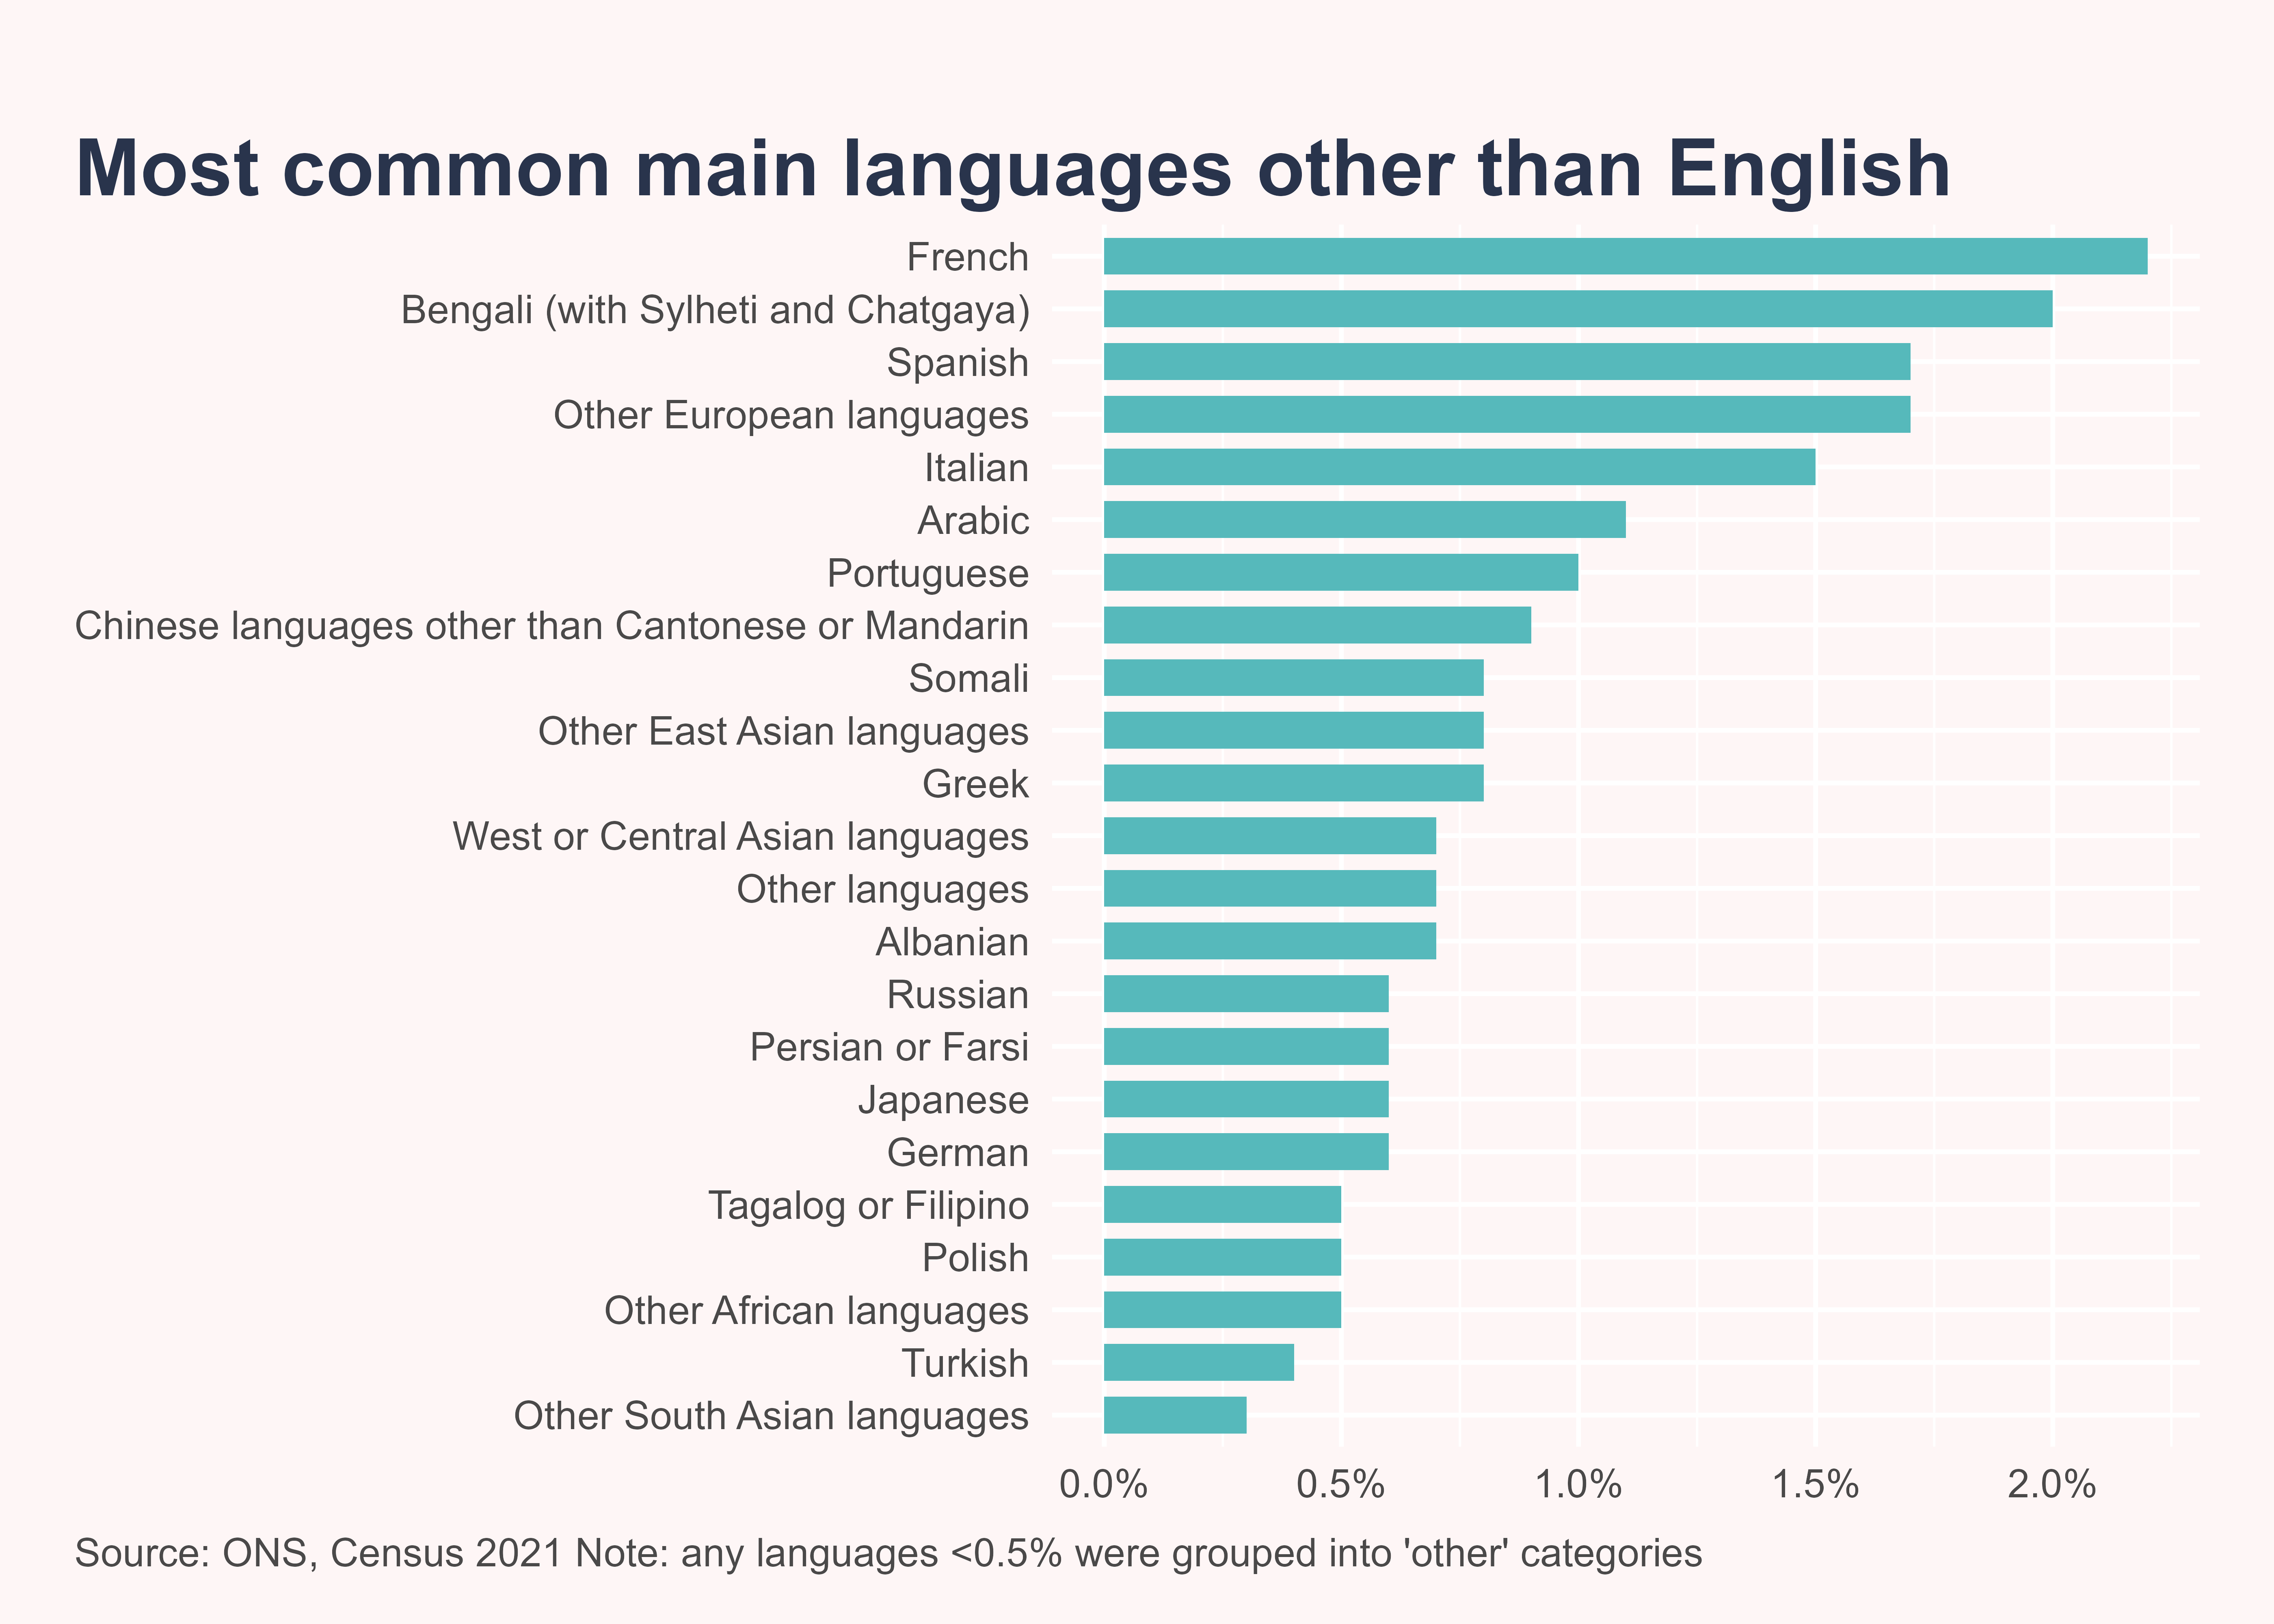
In 2021, 21.3% of people in Camden had a main language other than English. This is similar to the average for North Central London (23%) and all of London (21.6%) but more than twice the average for England (8.9%).
The most common main languages in Camden other than English are French (2.2%), Bengali (with Sylheti and Chatgaya) (2%) and Spanish (1.7%).
Other characteristics
Sexual orientation and marital status
In the 2021 Census, 82.6% residents aged 16 years and over identified as Straight or Heterosexual, 3.7% as Gay or Lesbian, 2.5% as Bisexual and 0.7% as other sexual orientations. 10.5% of residents did not respond to this question.
More than half (55.7%) of Camden residents have never been married or registered a civil partnership. Around 1 in 3 (31.3%) are married or in a registered civil partnership and 13% are either divorced, separated or widowed.
Religion
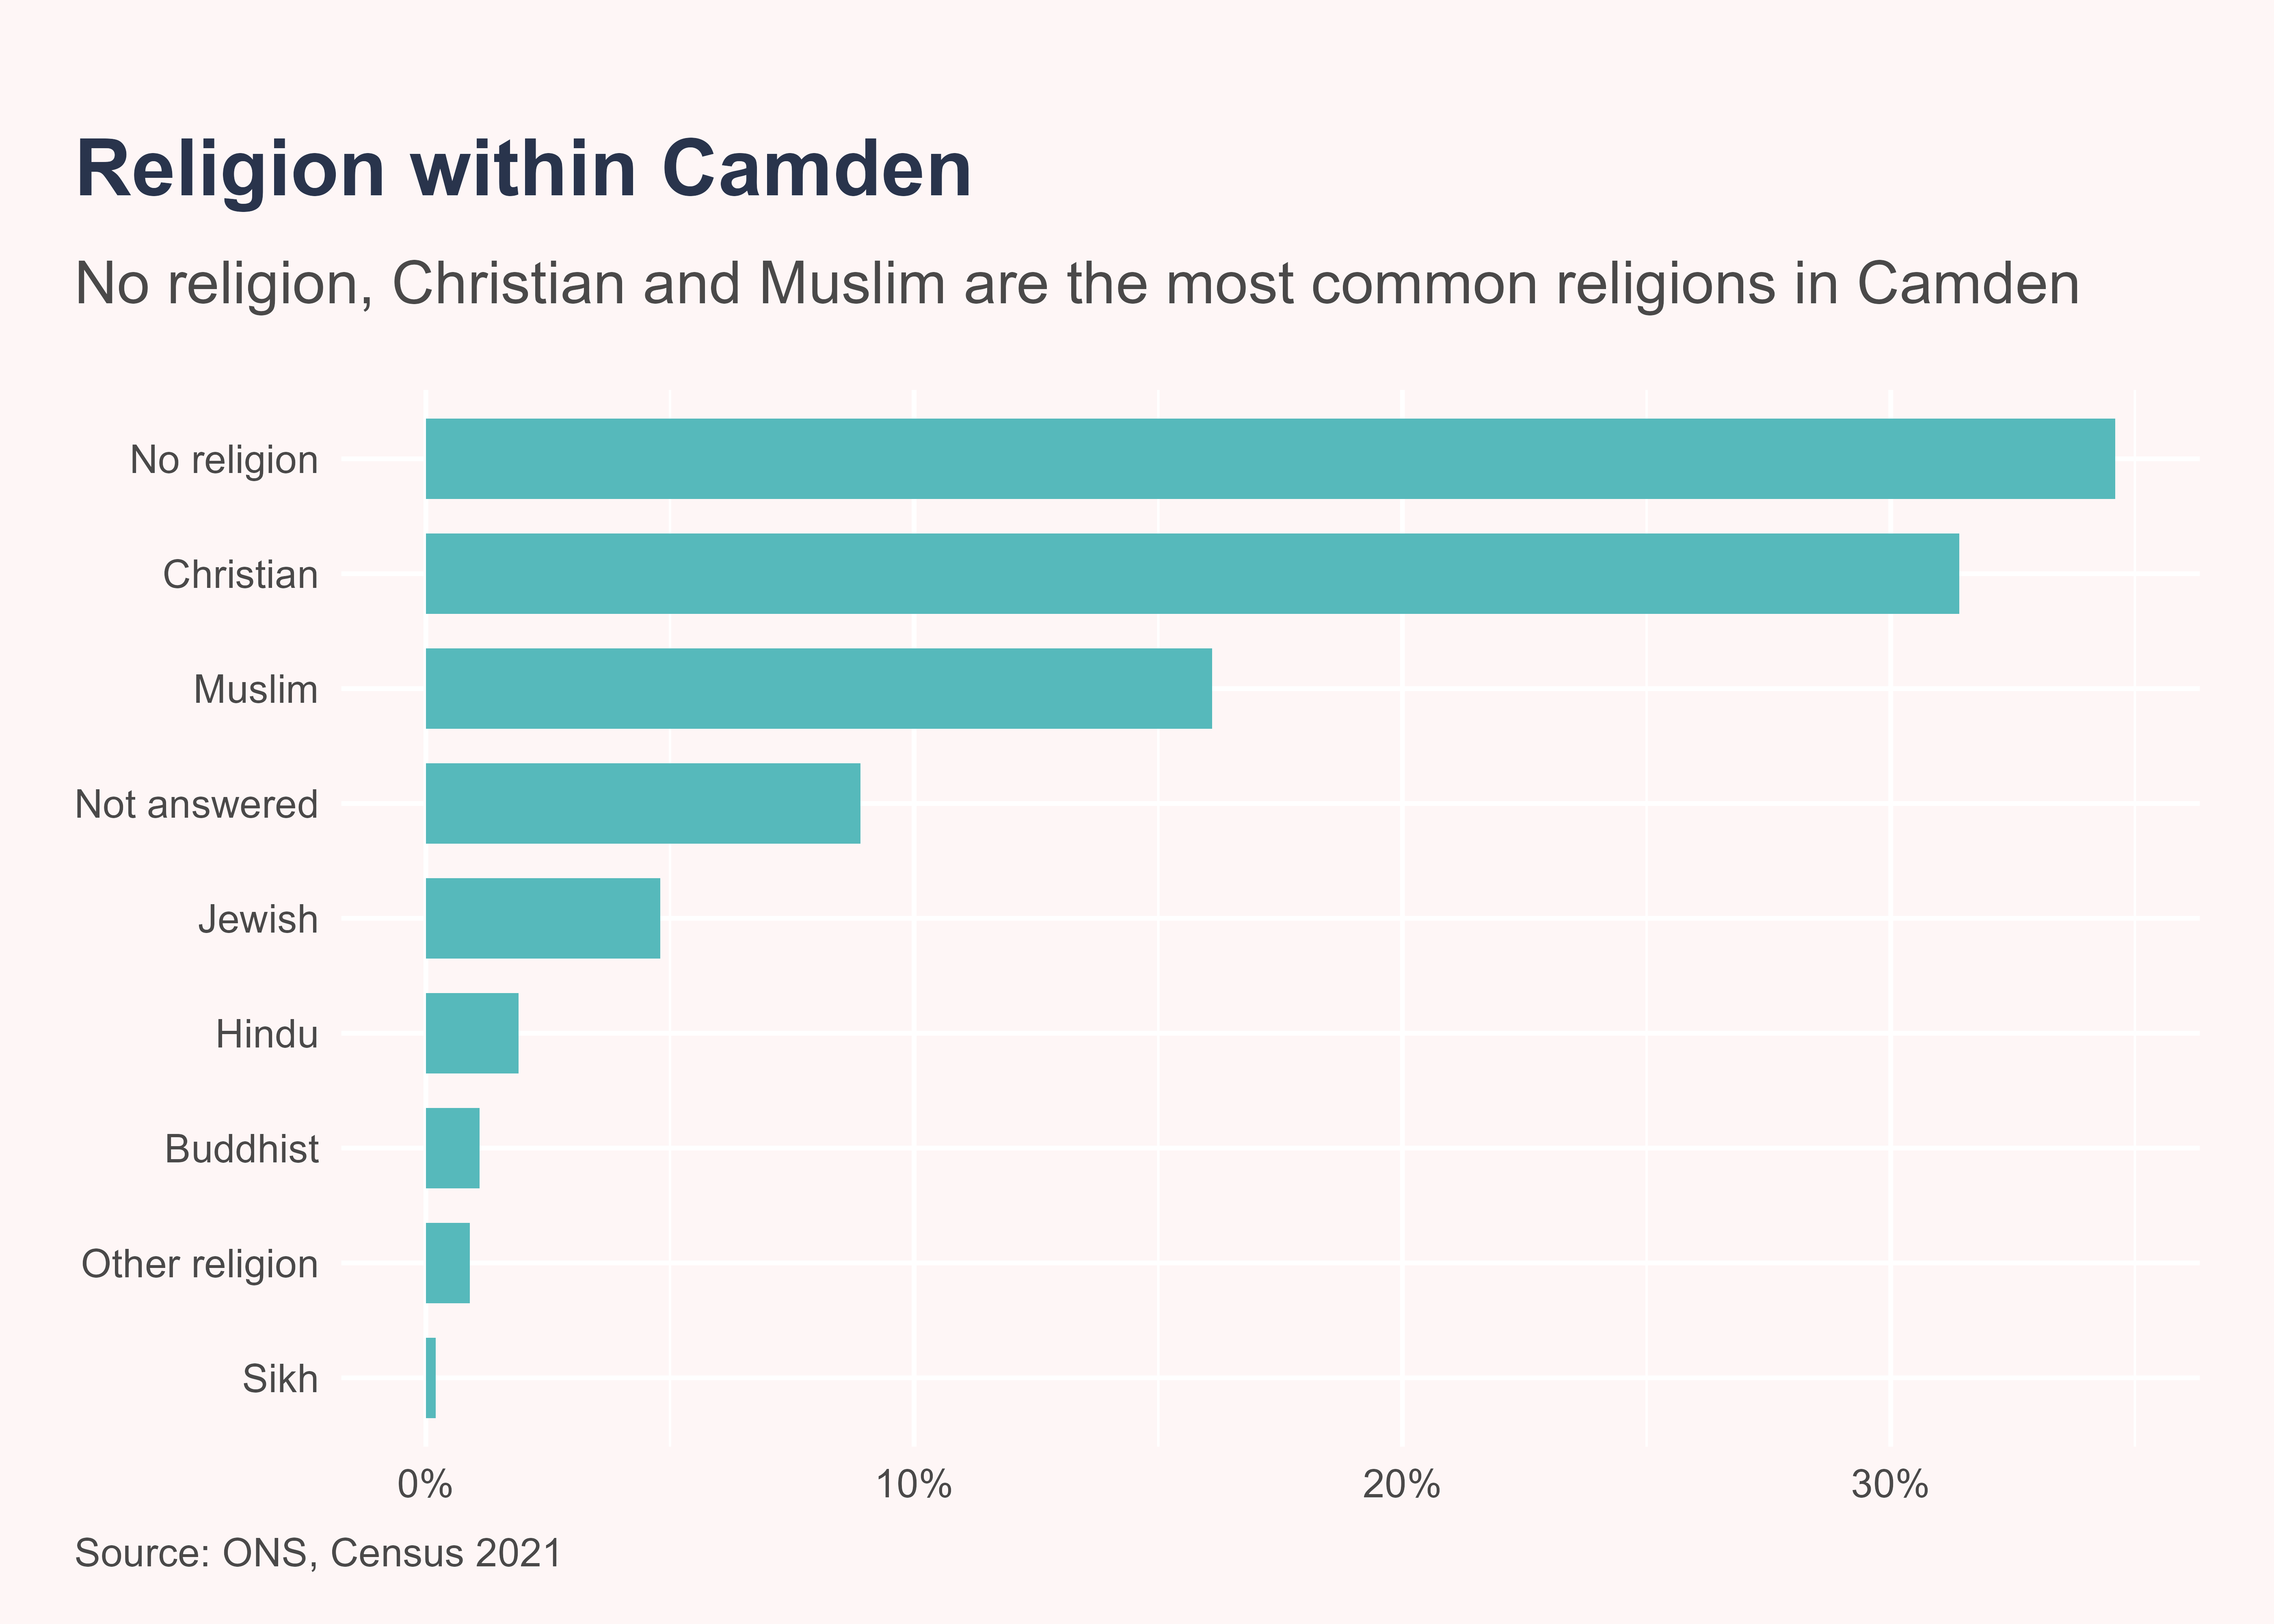
In Camden, 34.6% of people reported having no religion in the 2021 Census compared to 56.4% of people who were religious and 8.9% who did not answer the question. The most common religions were Christianity (31.4%) and Islam (16.1%).
Deprivation
Deprivation varies across Camden, though is generally higher in the South and central areas
Based on the Index of Multiple Deprivation (2019), Kilburn, Camden Town and St Pancras and Somers Town are the most deprived wards in Camden however, there is variation within each ward.