3. Heart Health in Camden: What the Data Shows
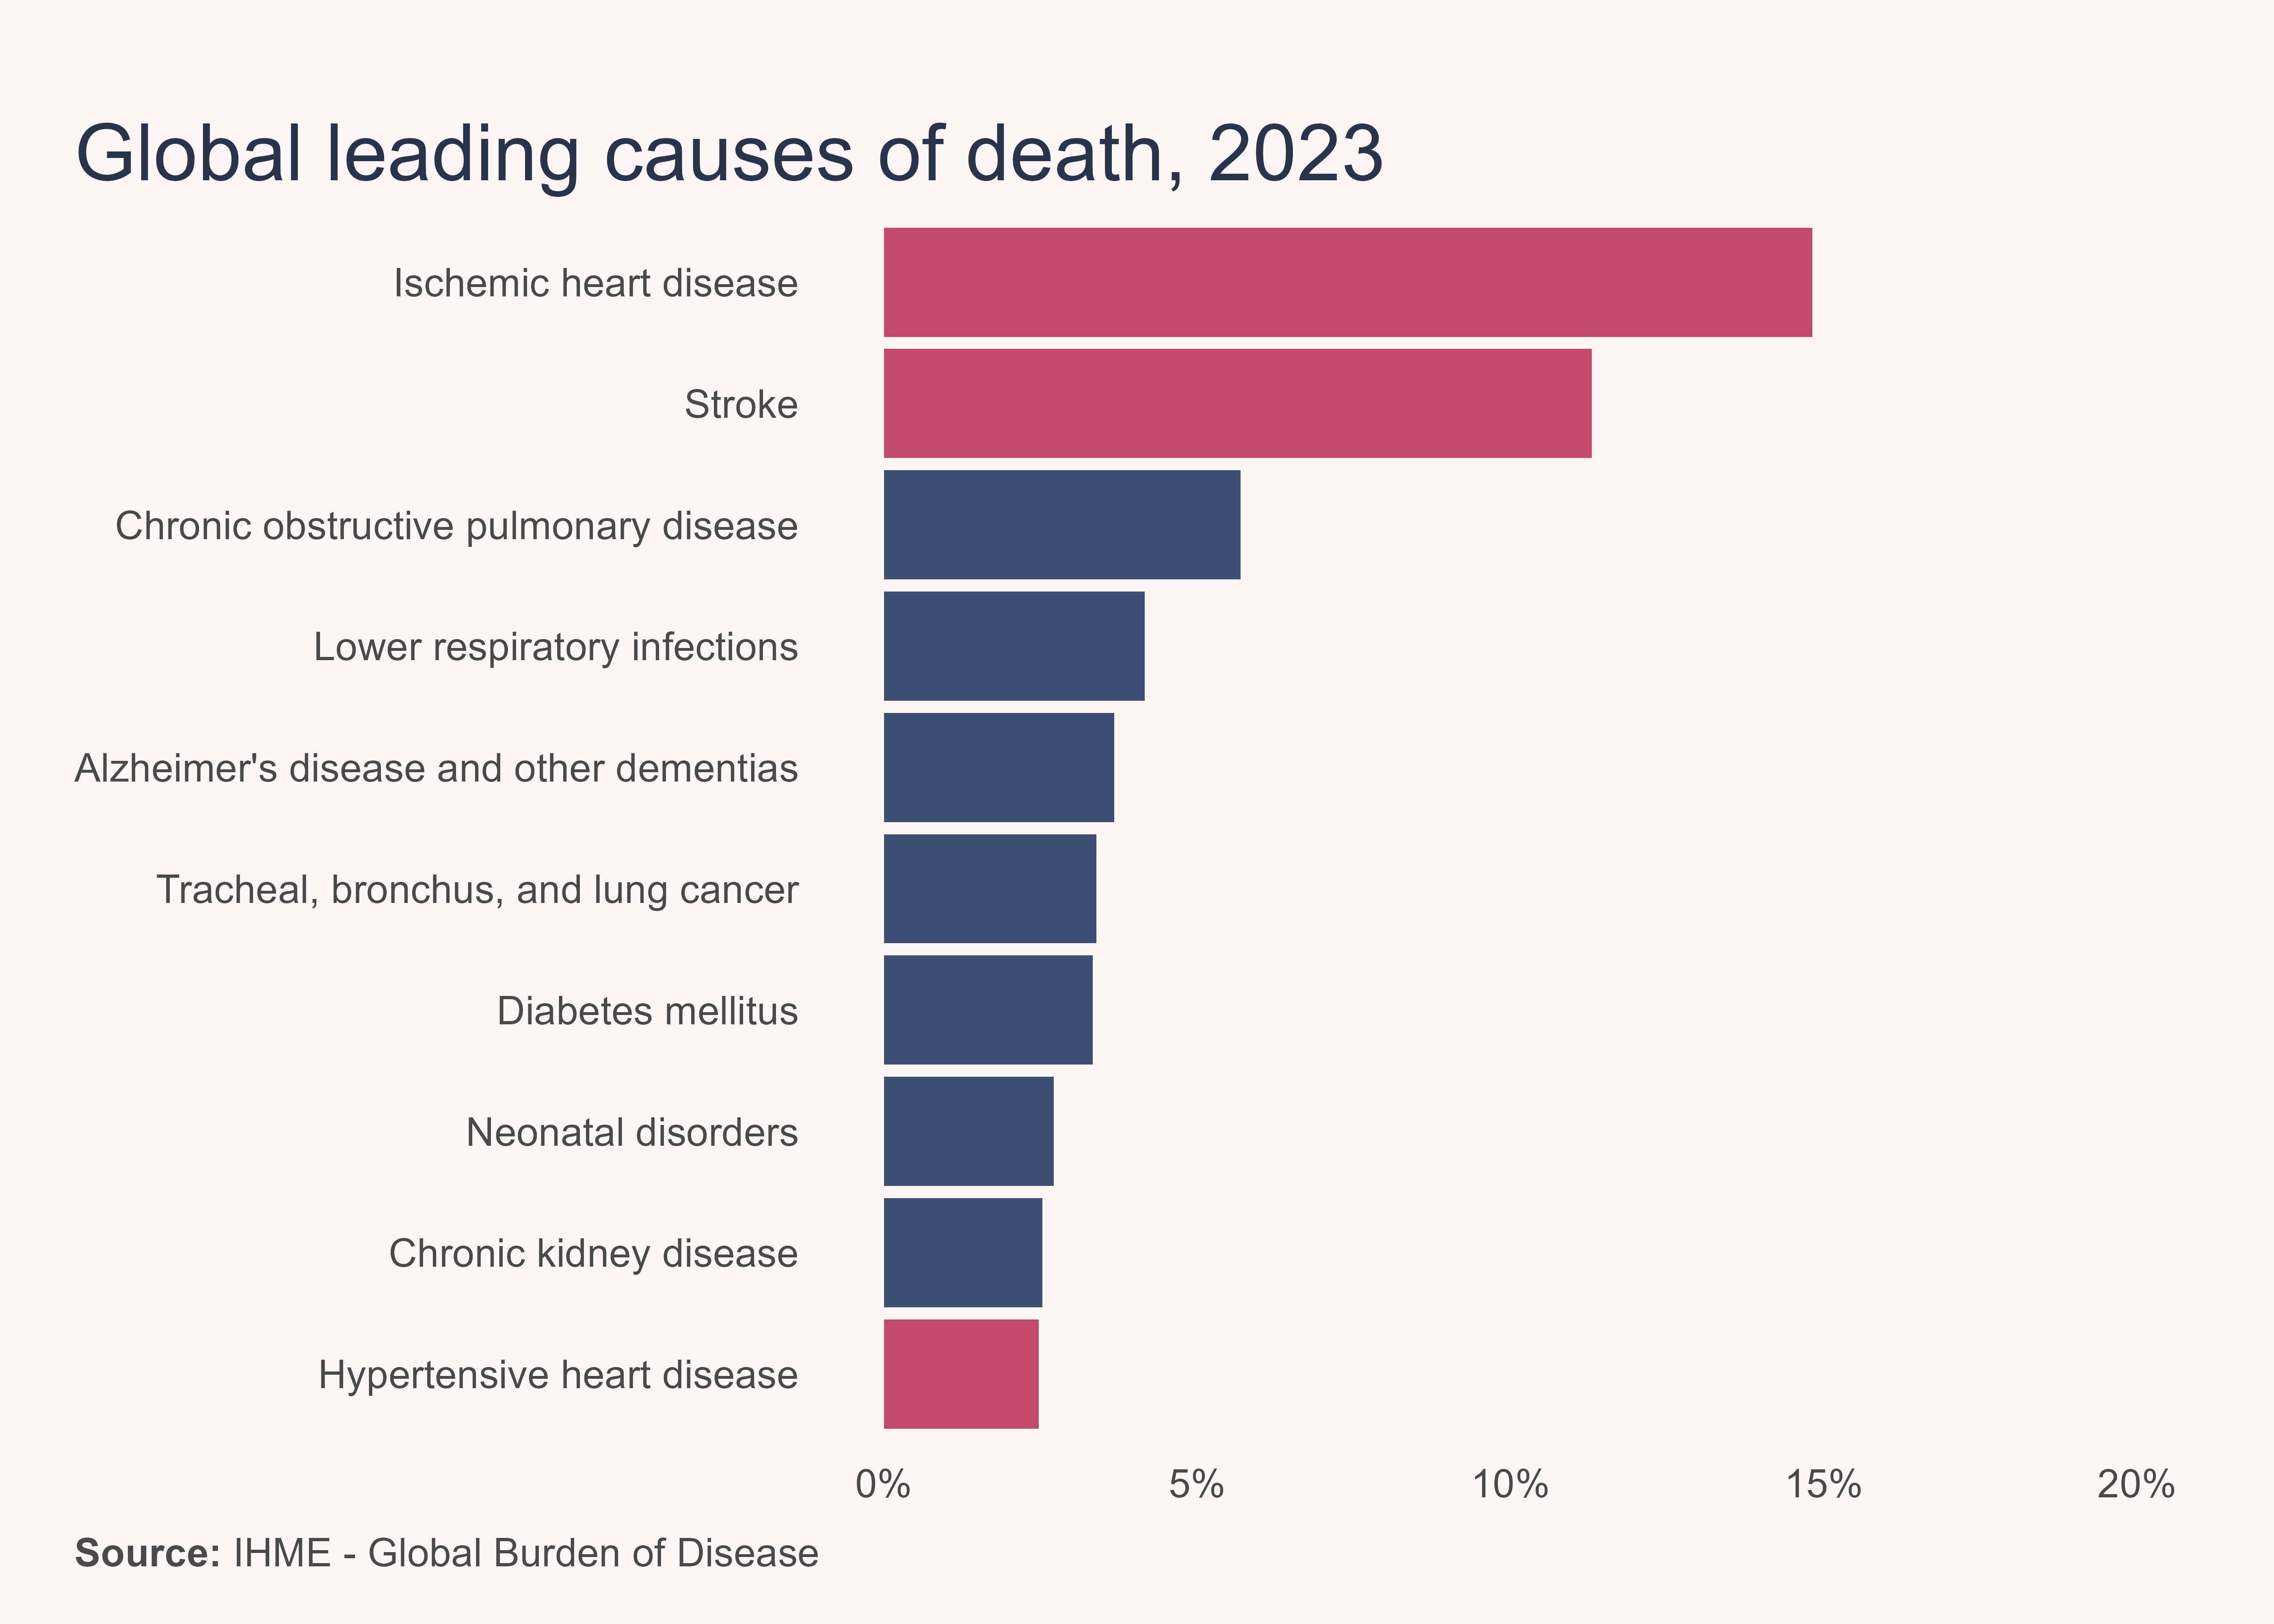
Despite being largely preventable, cardiovascular diseases are the leading cause of death worldwide, accounting for 19 million deaths each year, which is around 31% of all deaths [1].
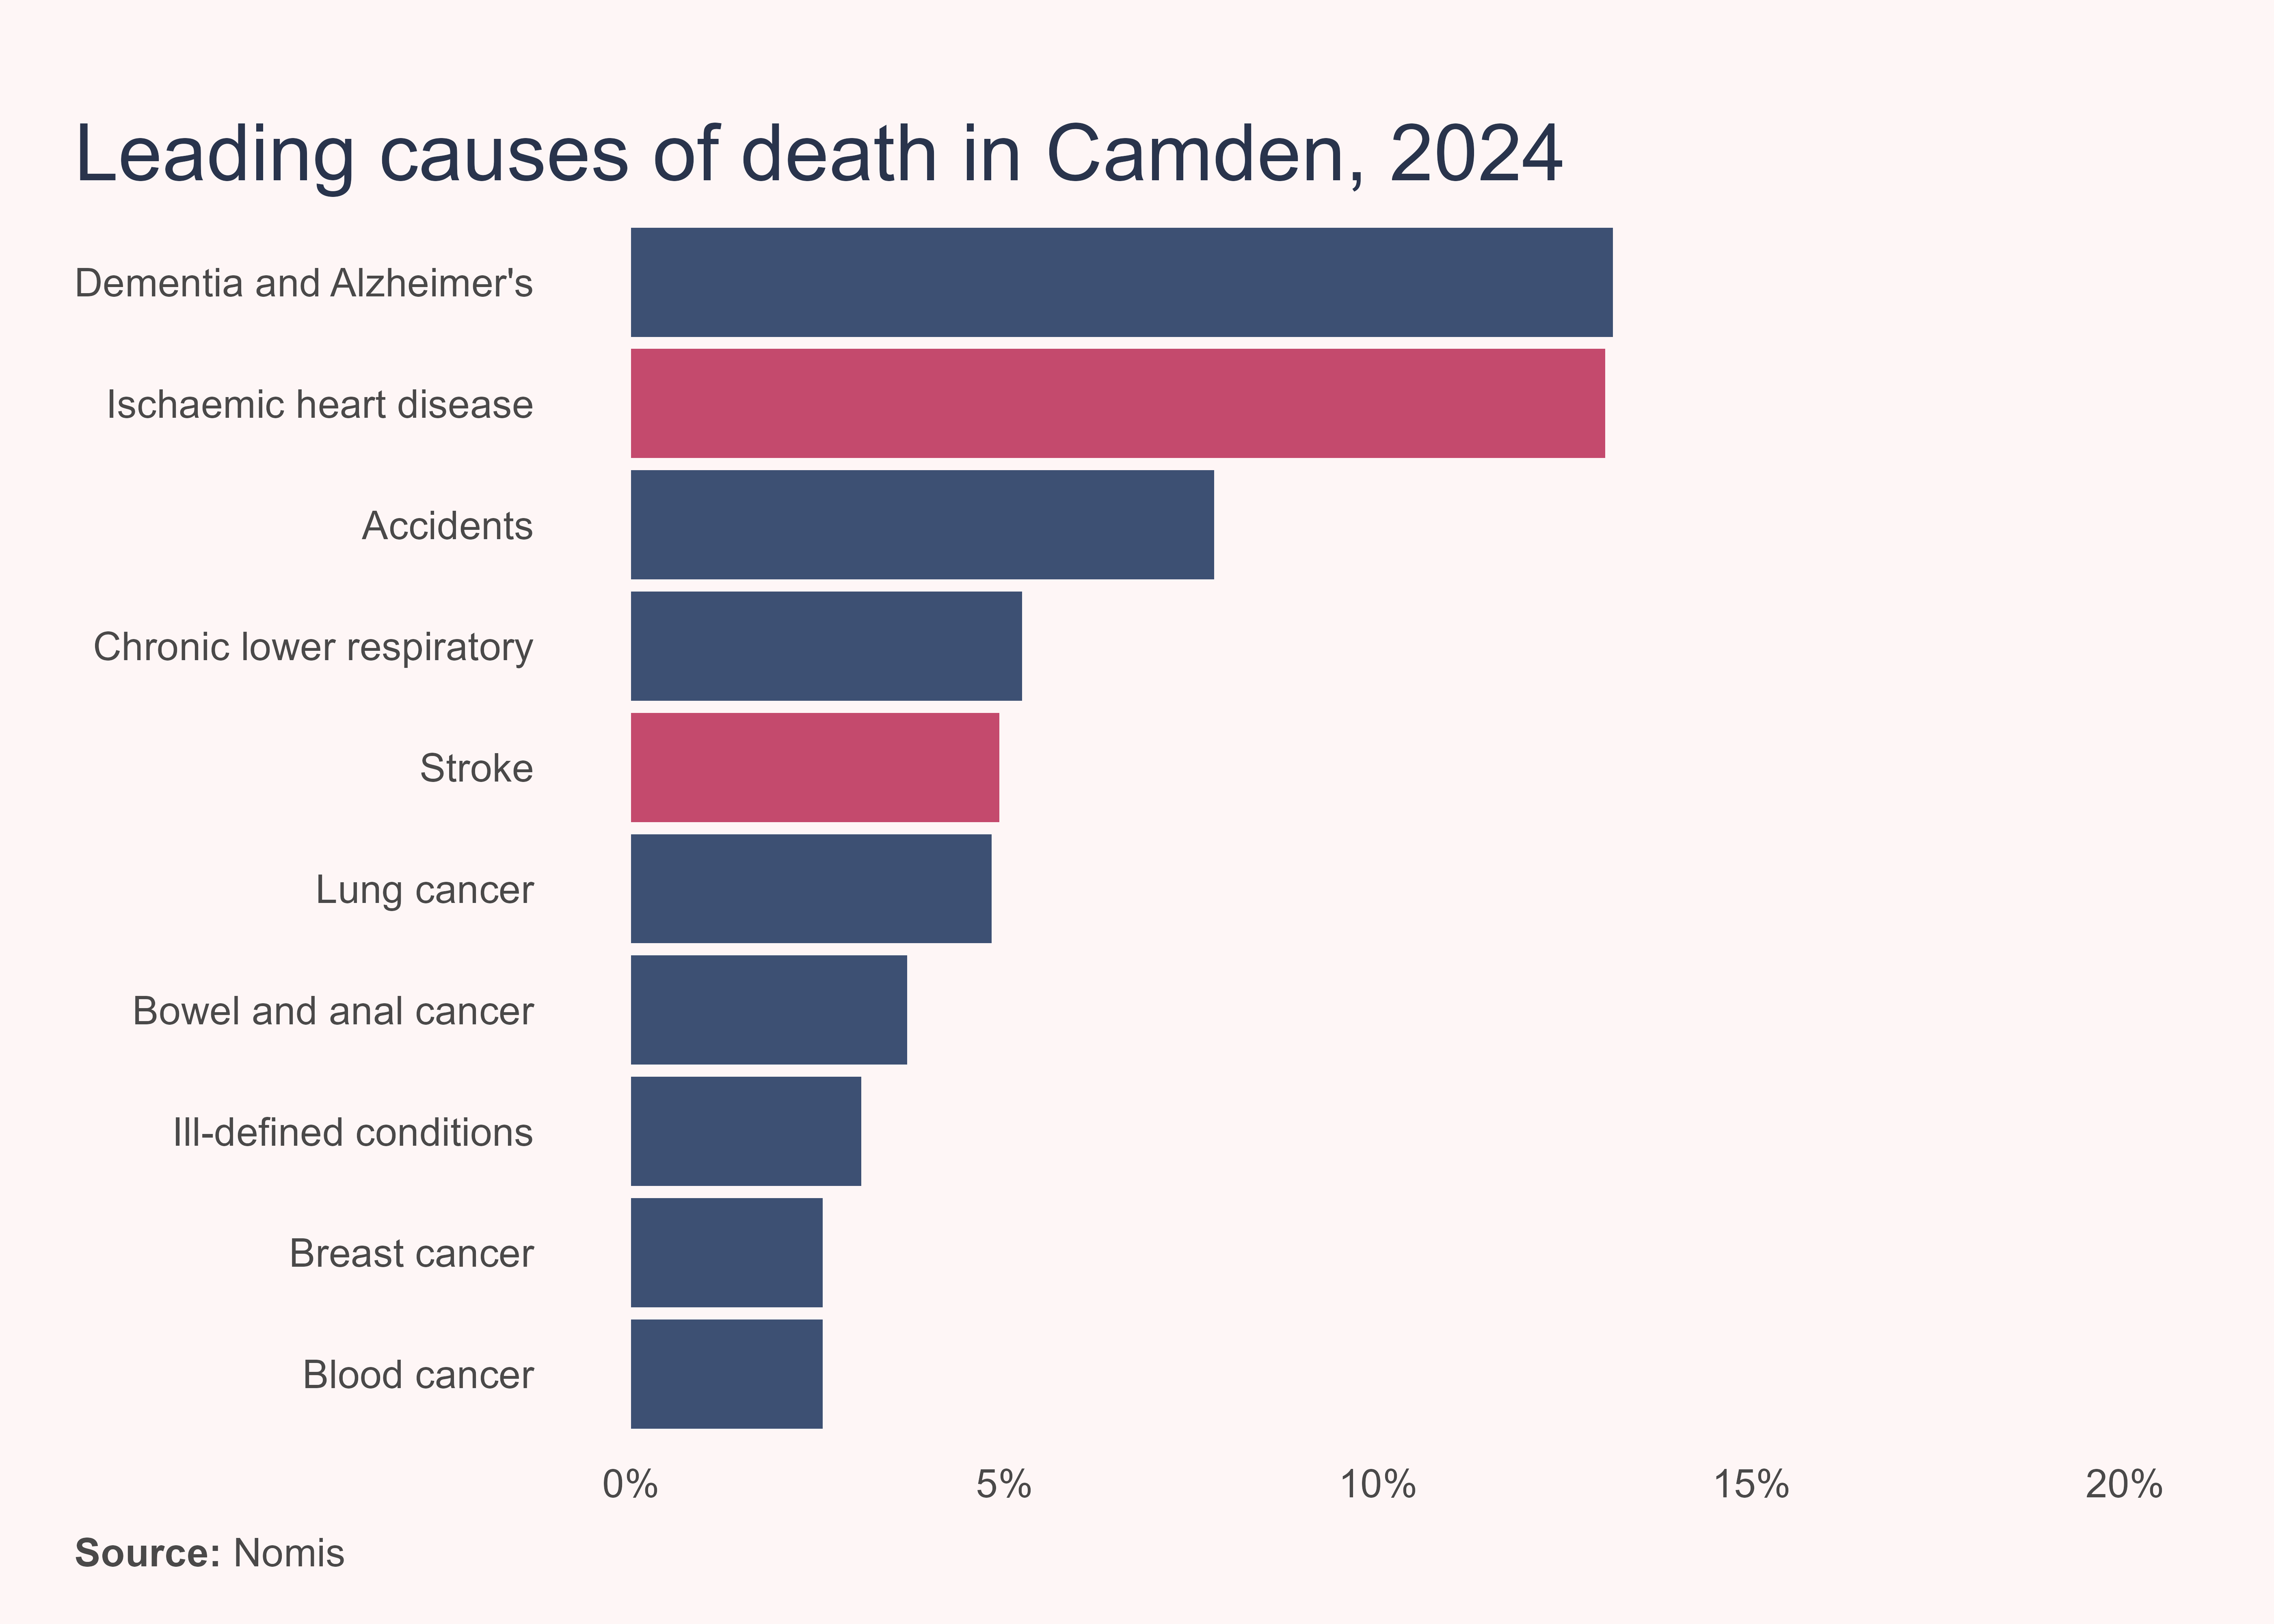
A similar pattern is also seen locally.
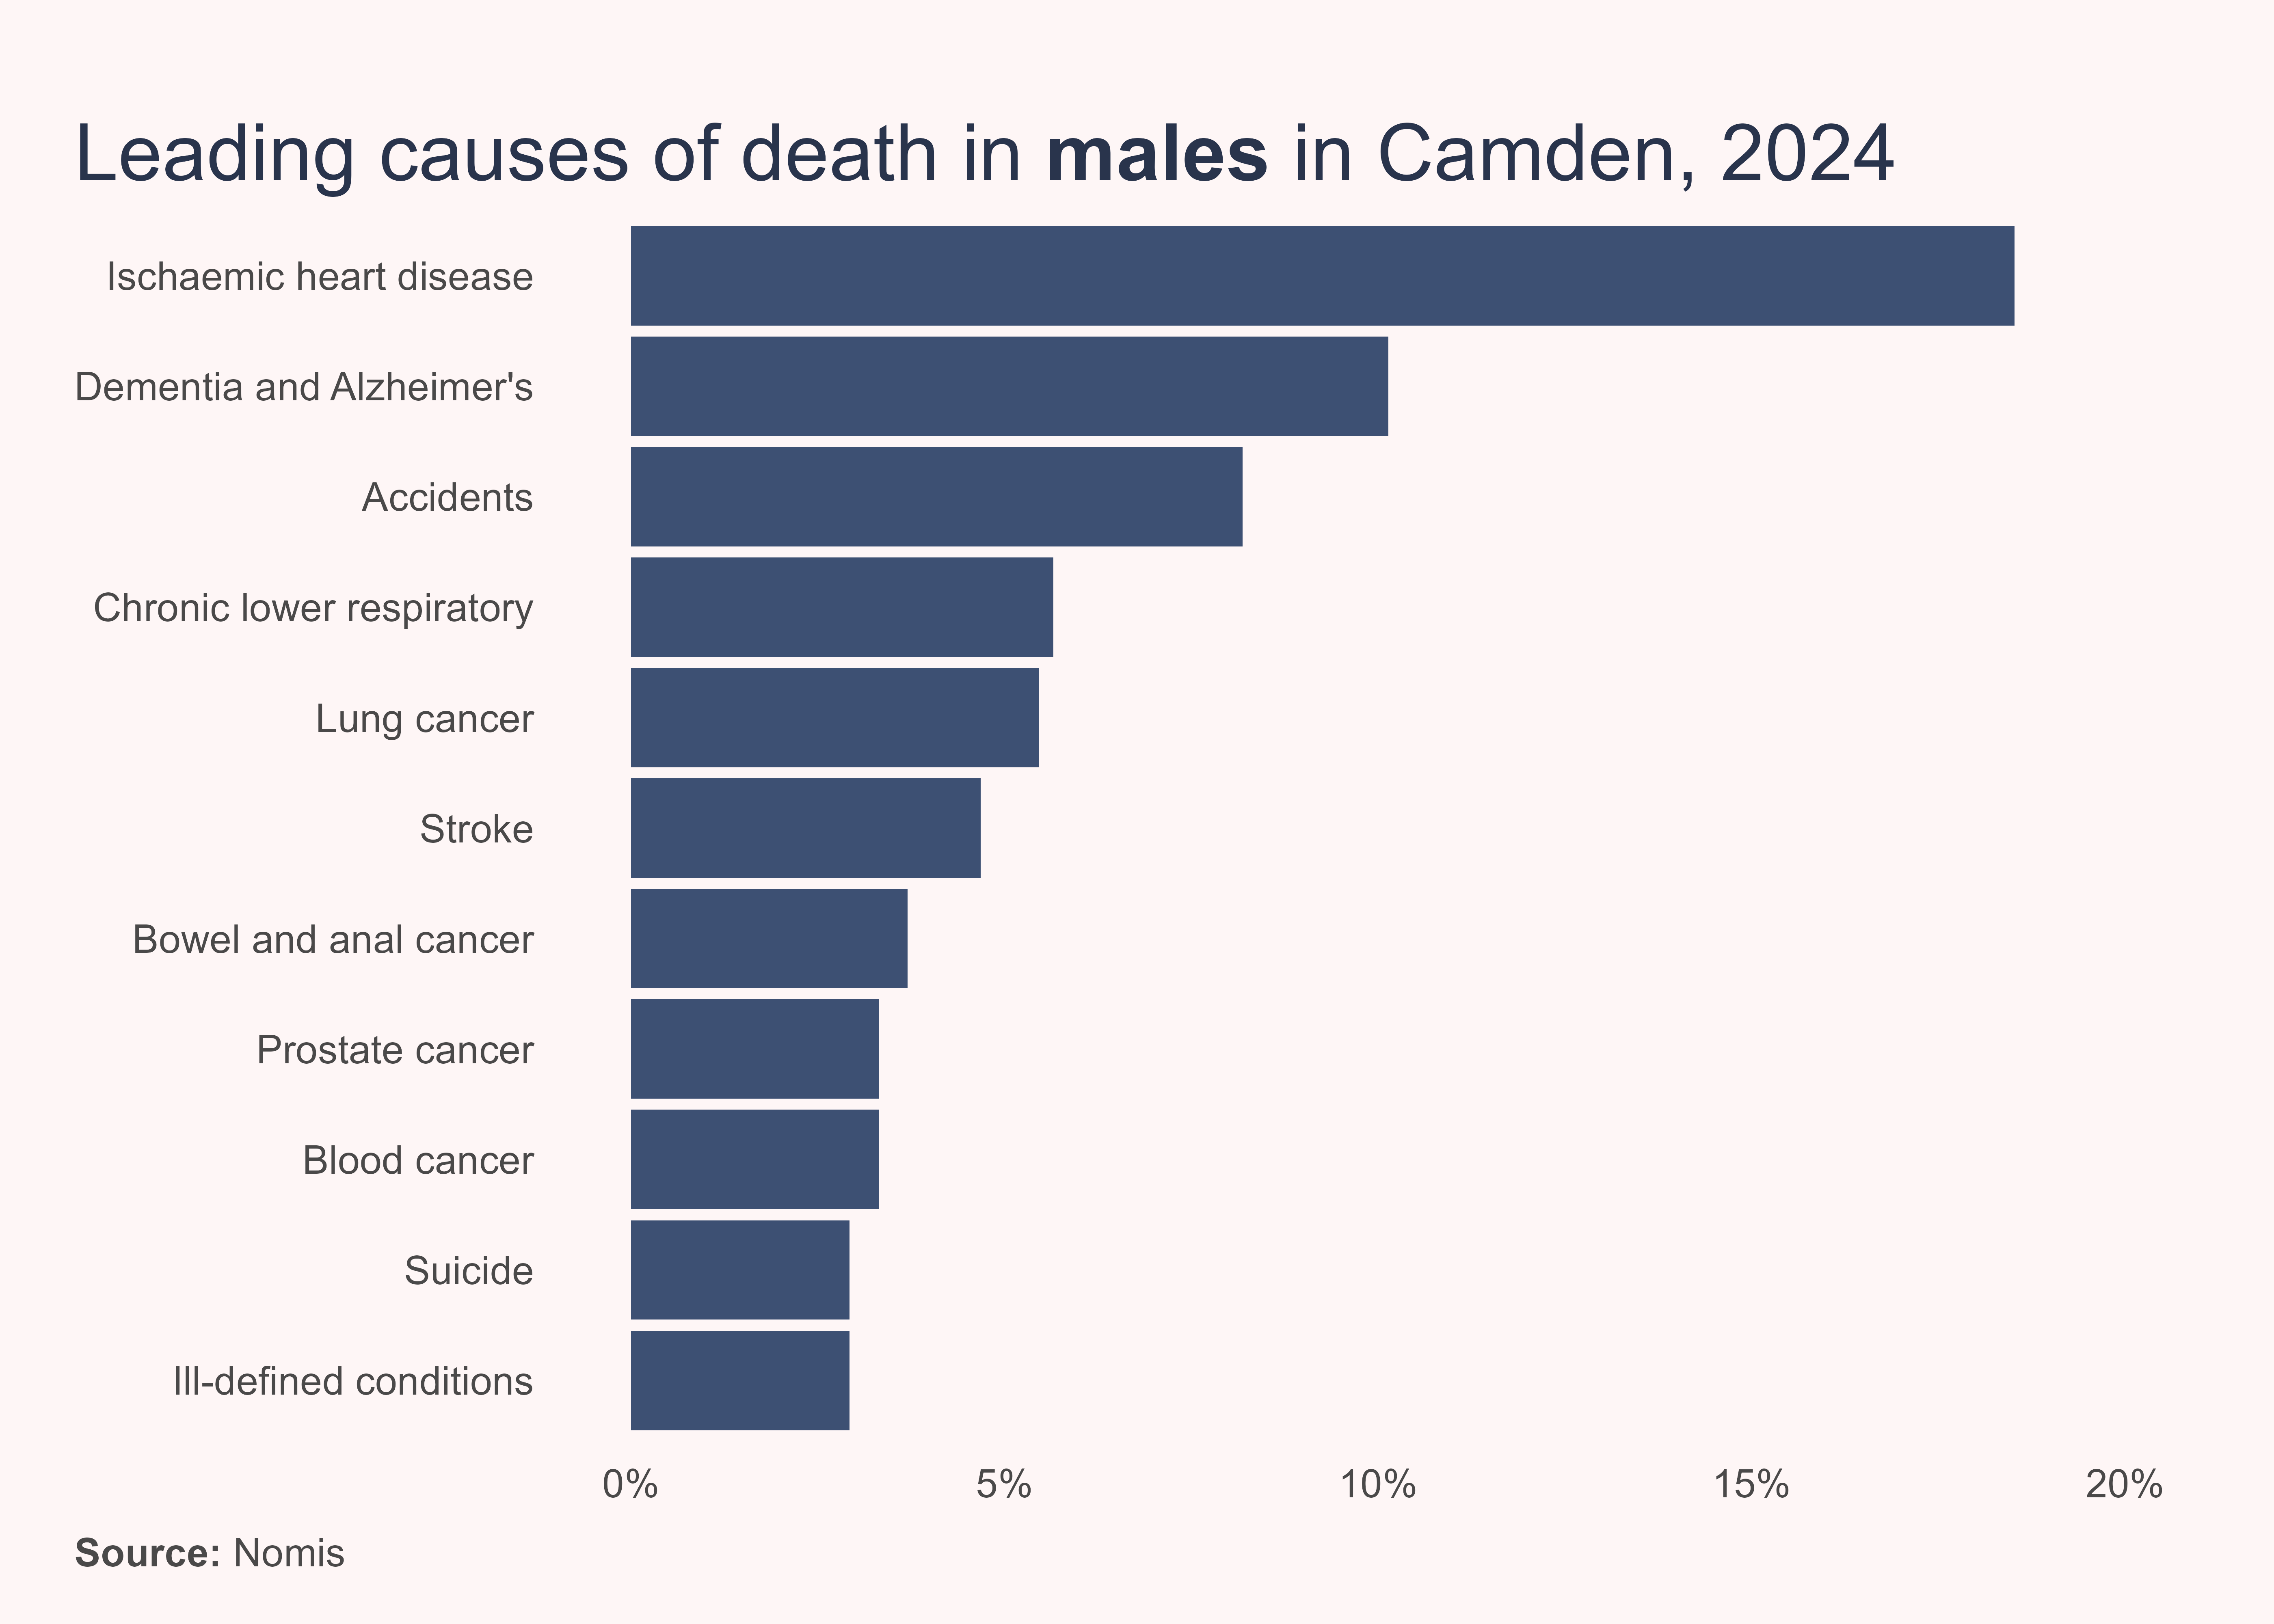
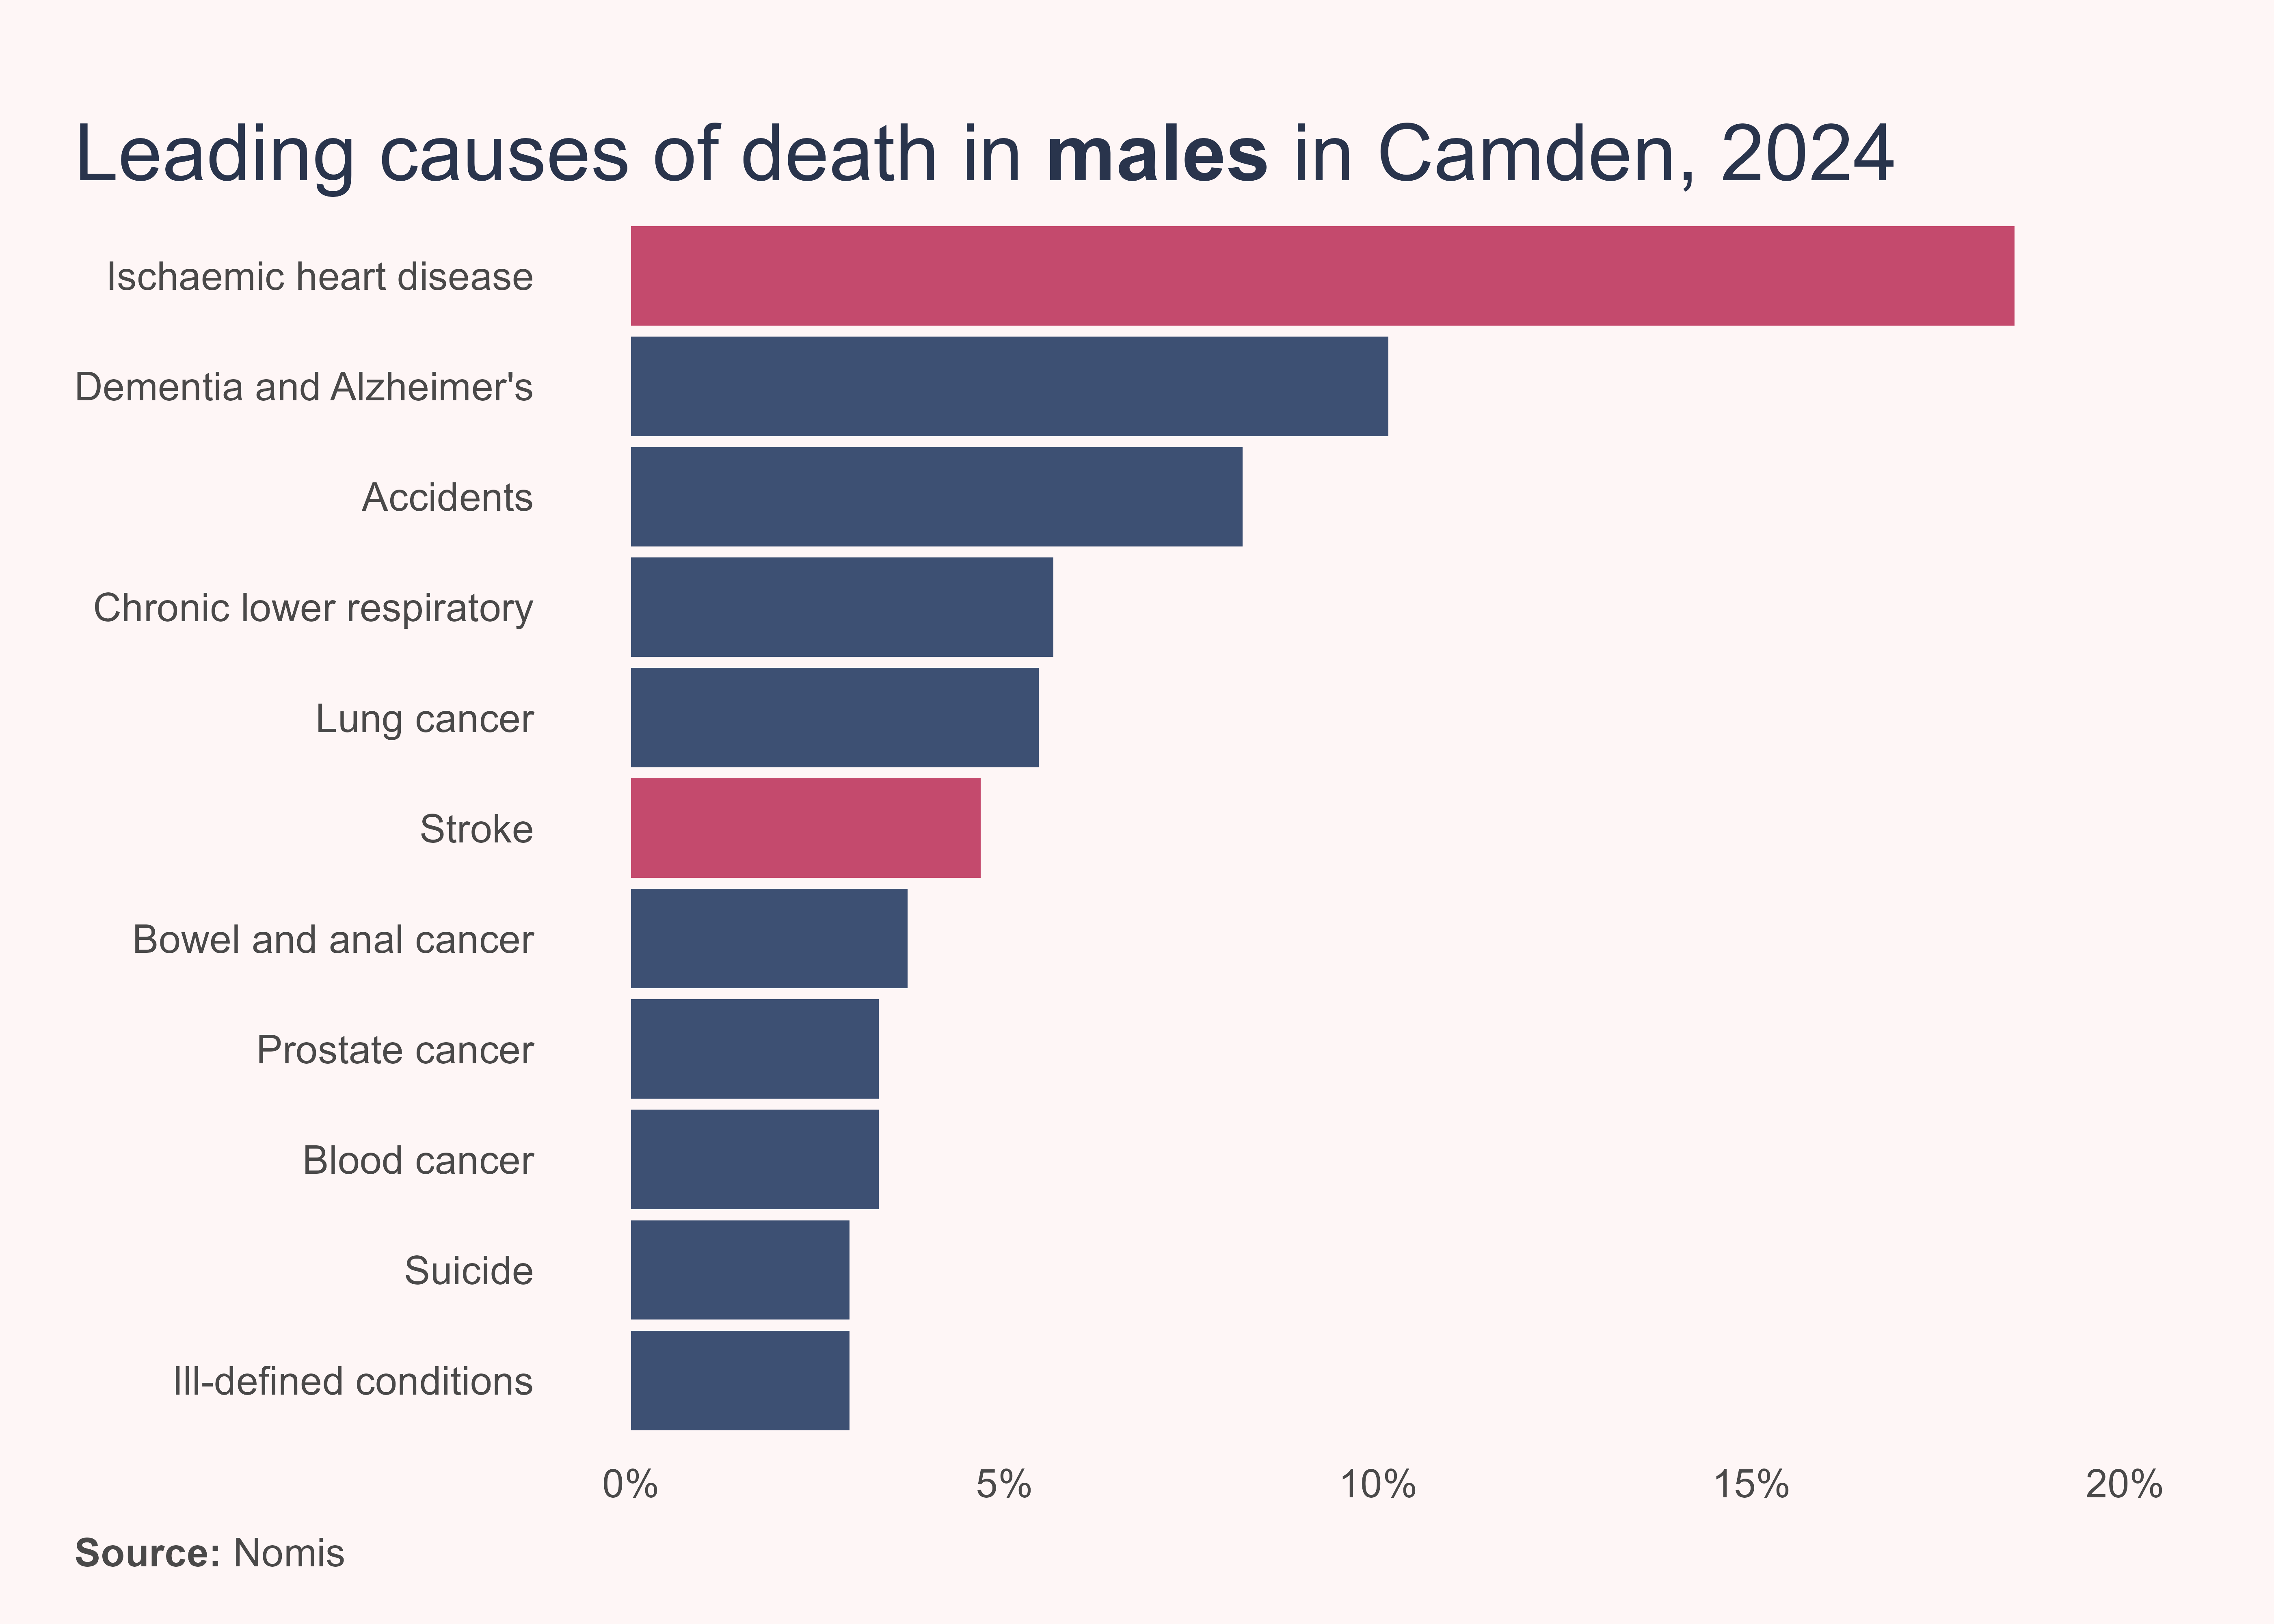
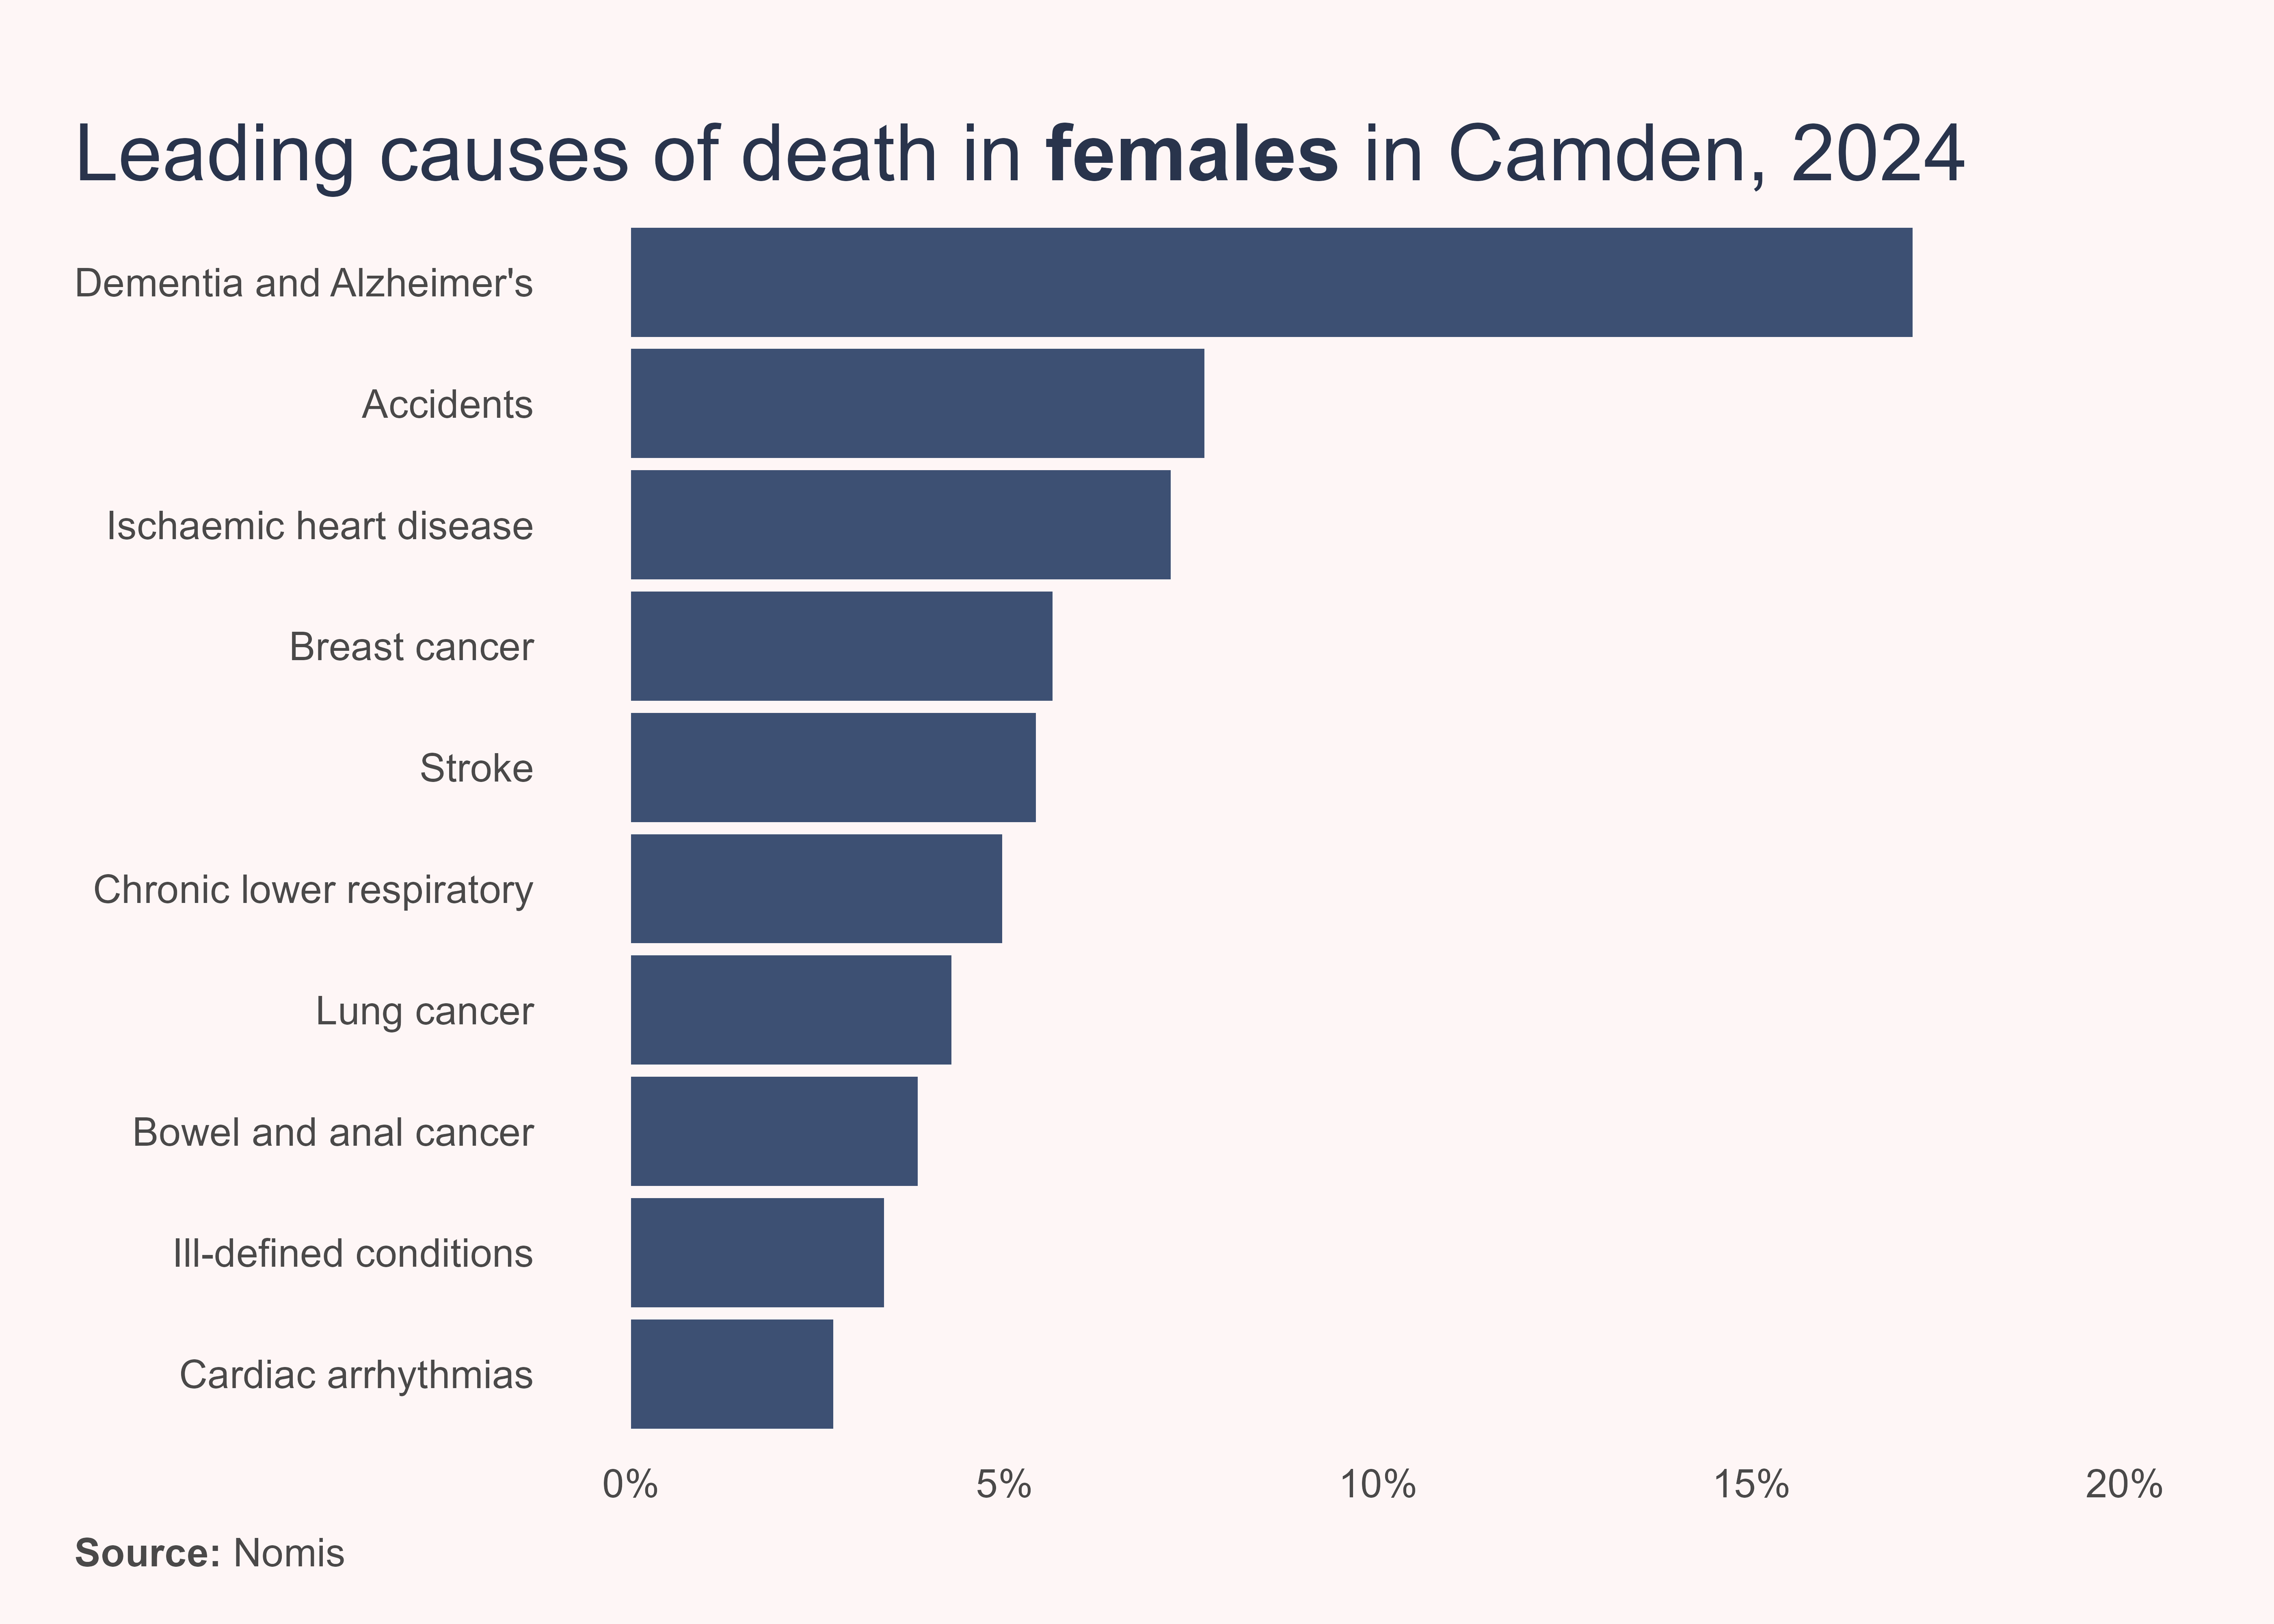
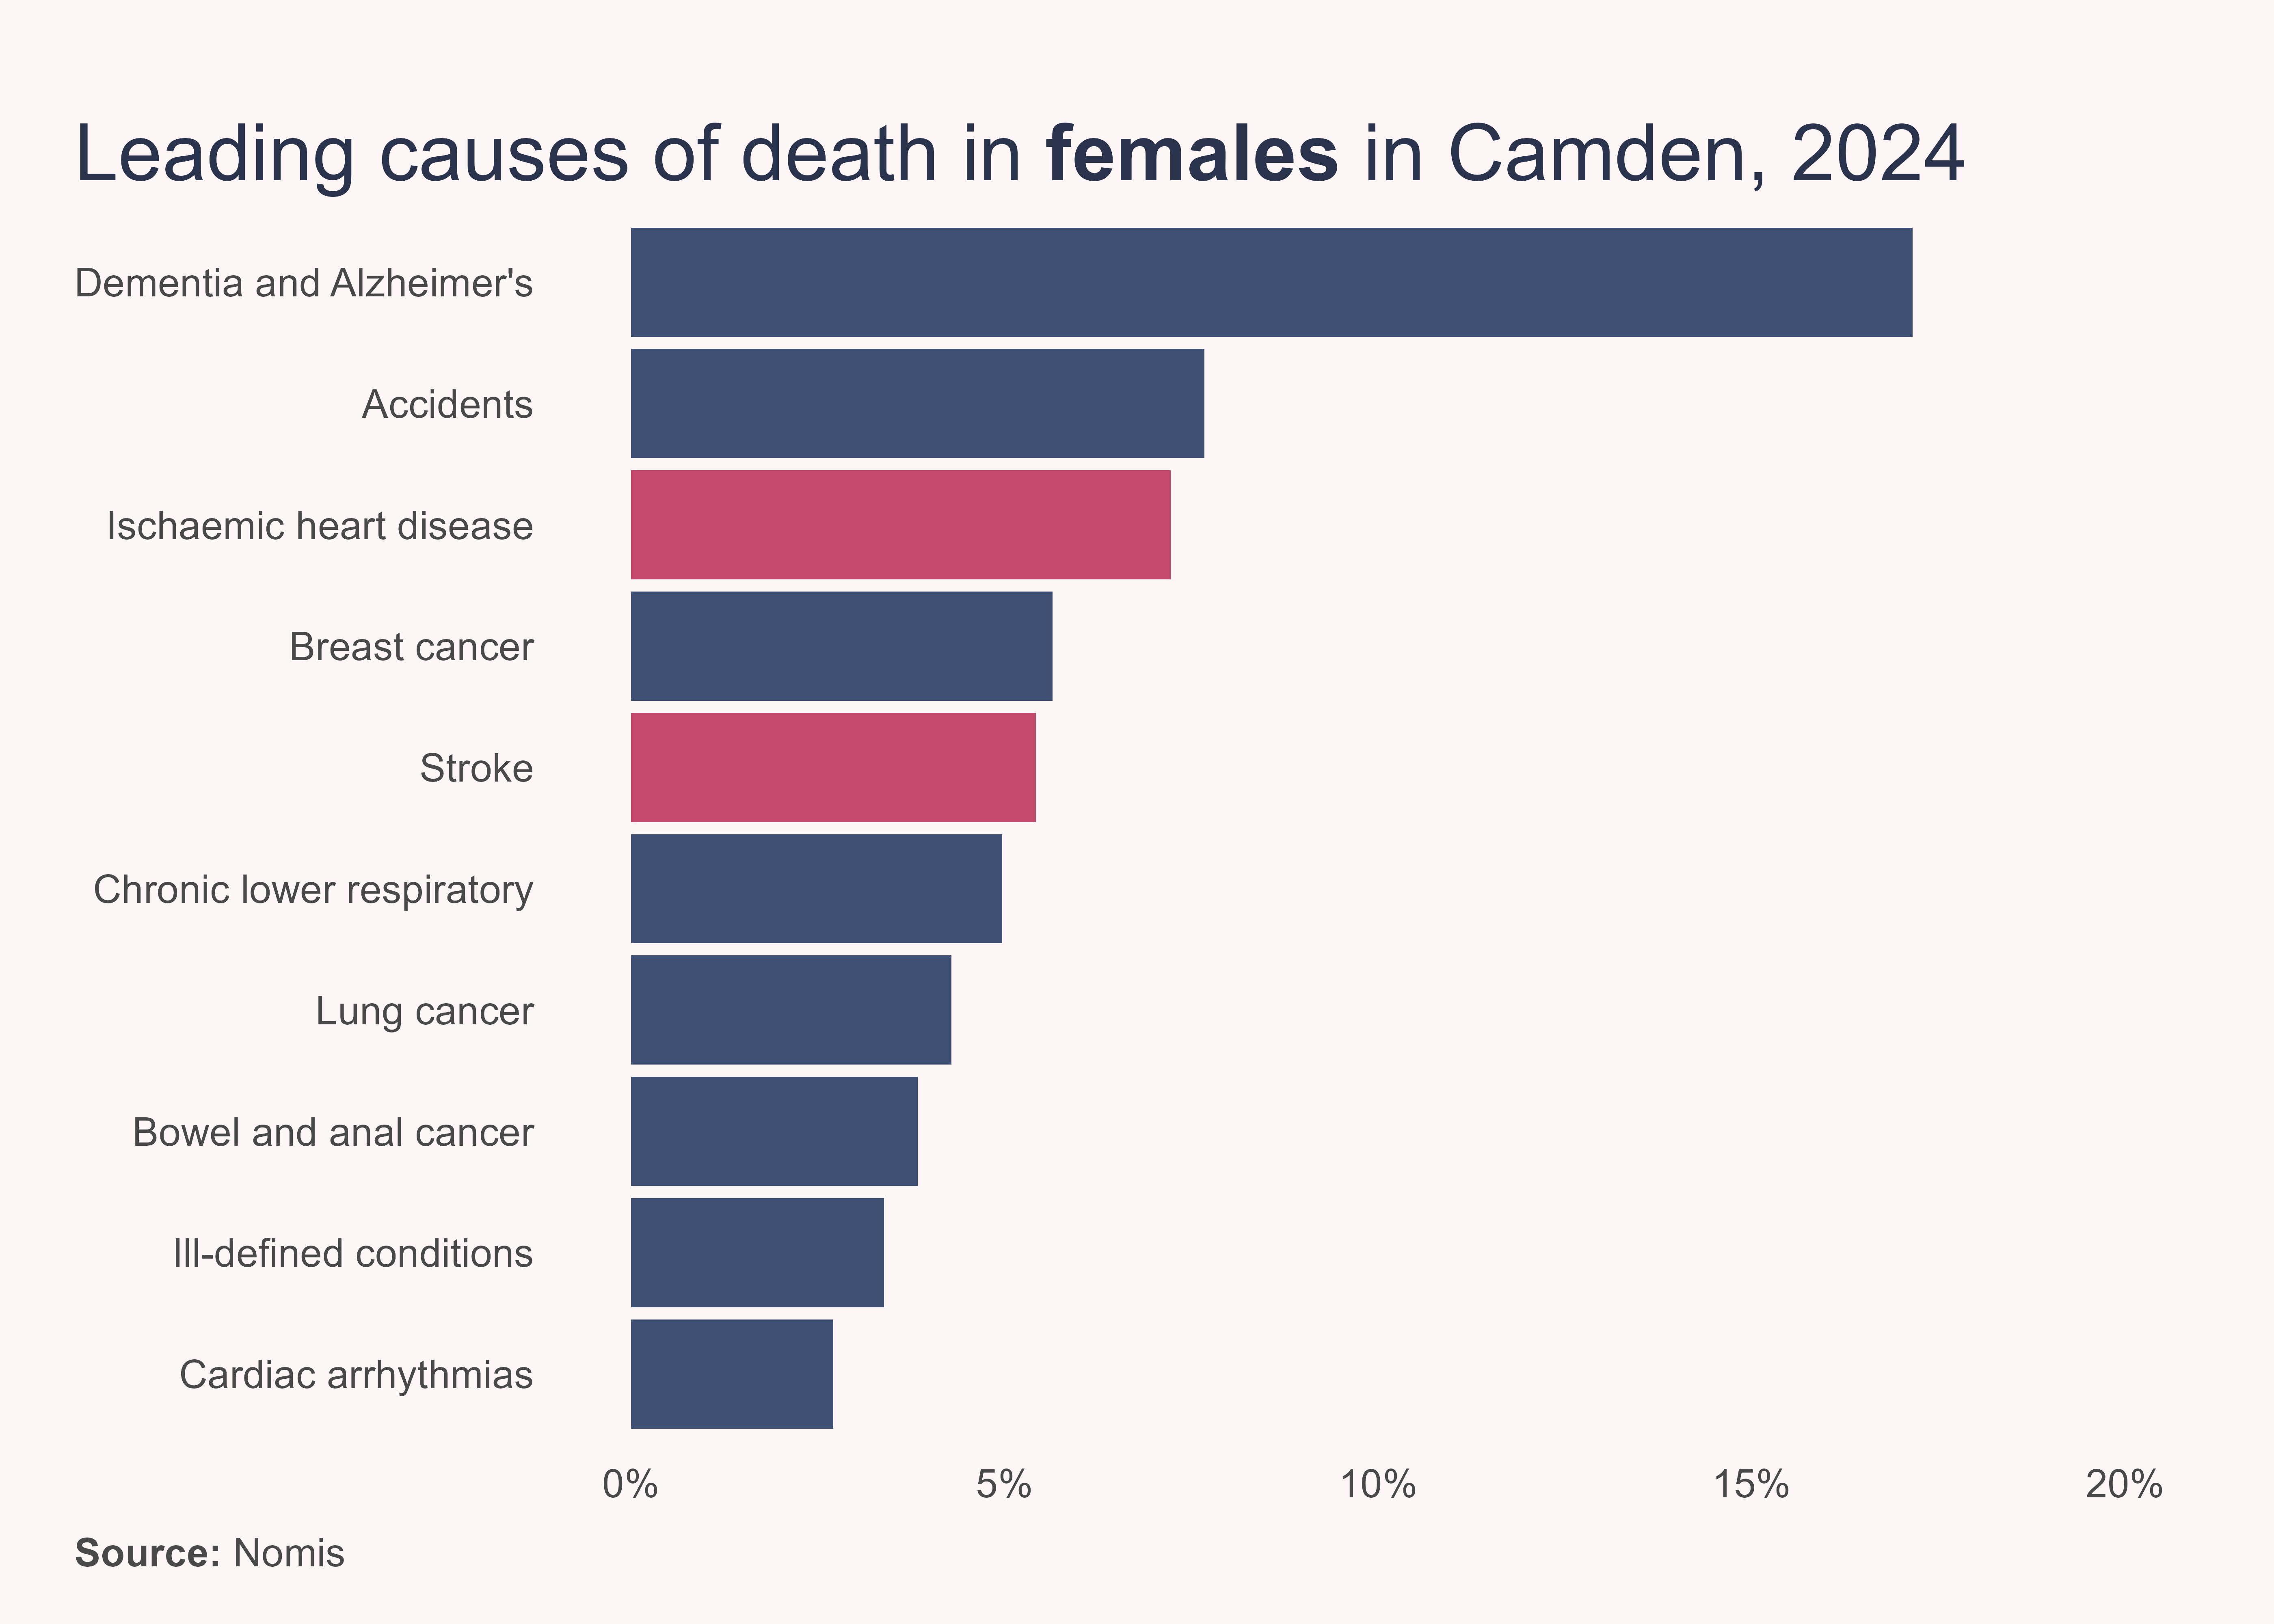
In 2024, ischaemic heart disease and stroke were the 1st and 6th leading causes of death in males in Camden, together accounting for 23.2% of deaths…
…and the 3rd and 5th leading causes of death in females, responsible for 12.6% of deaths.
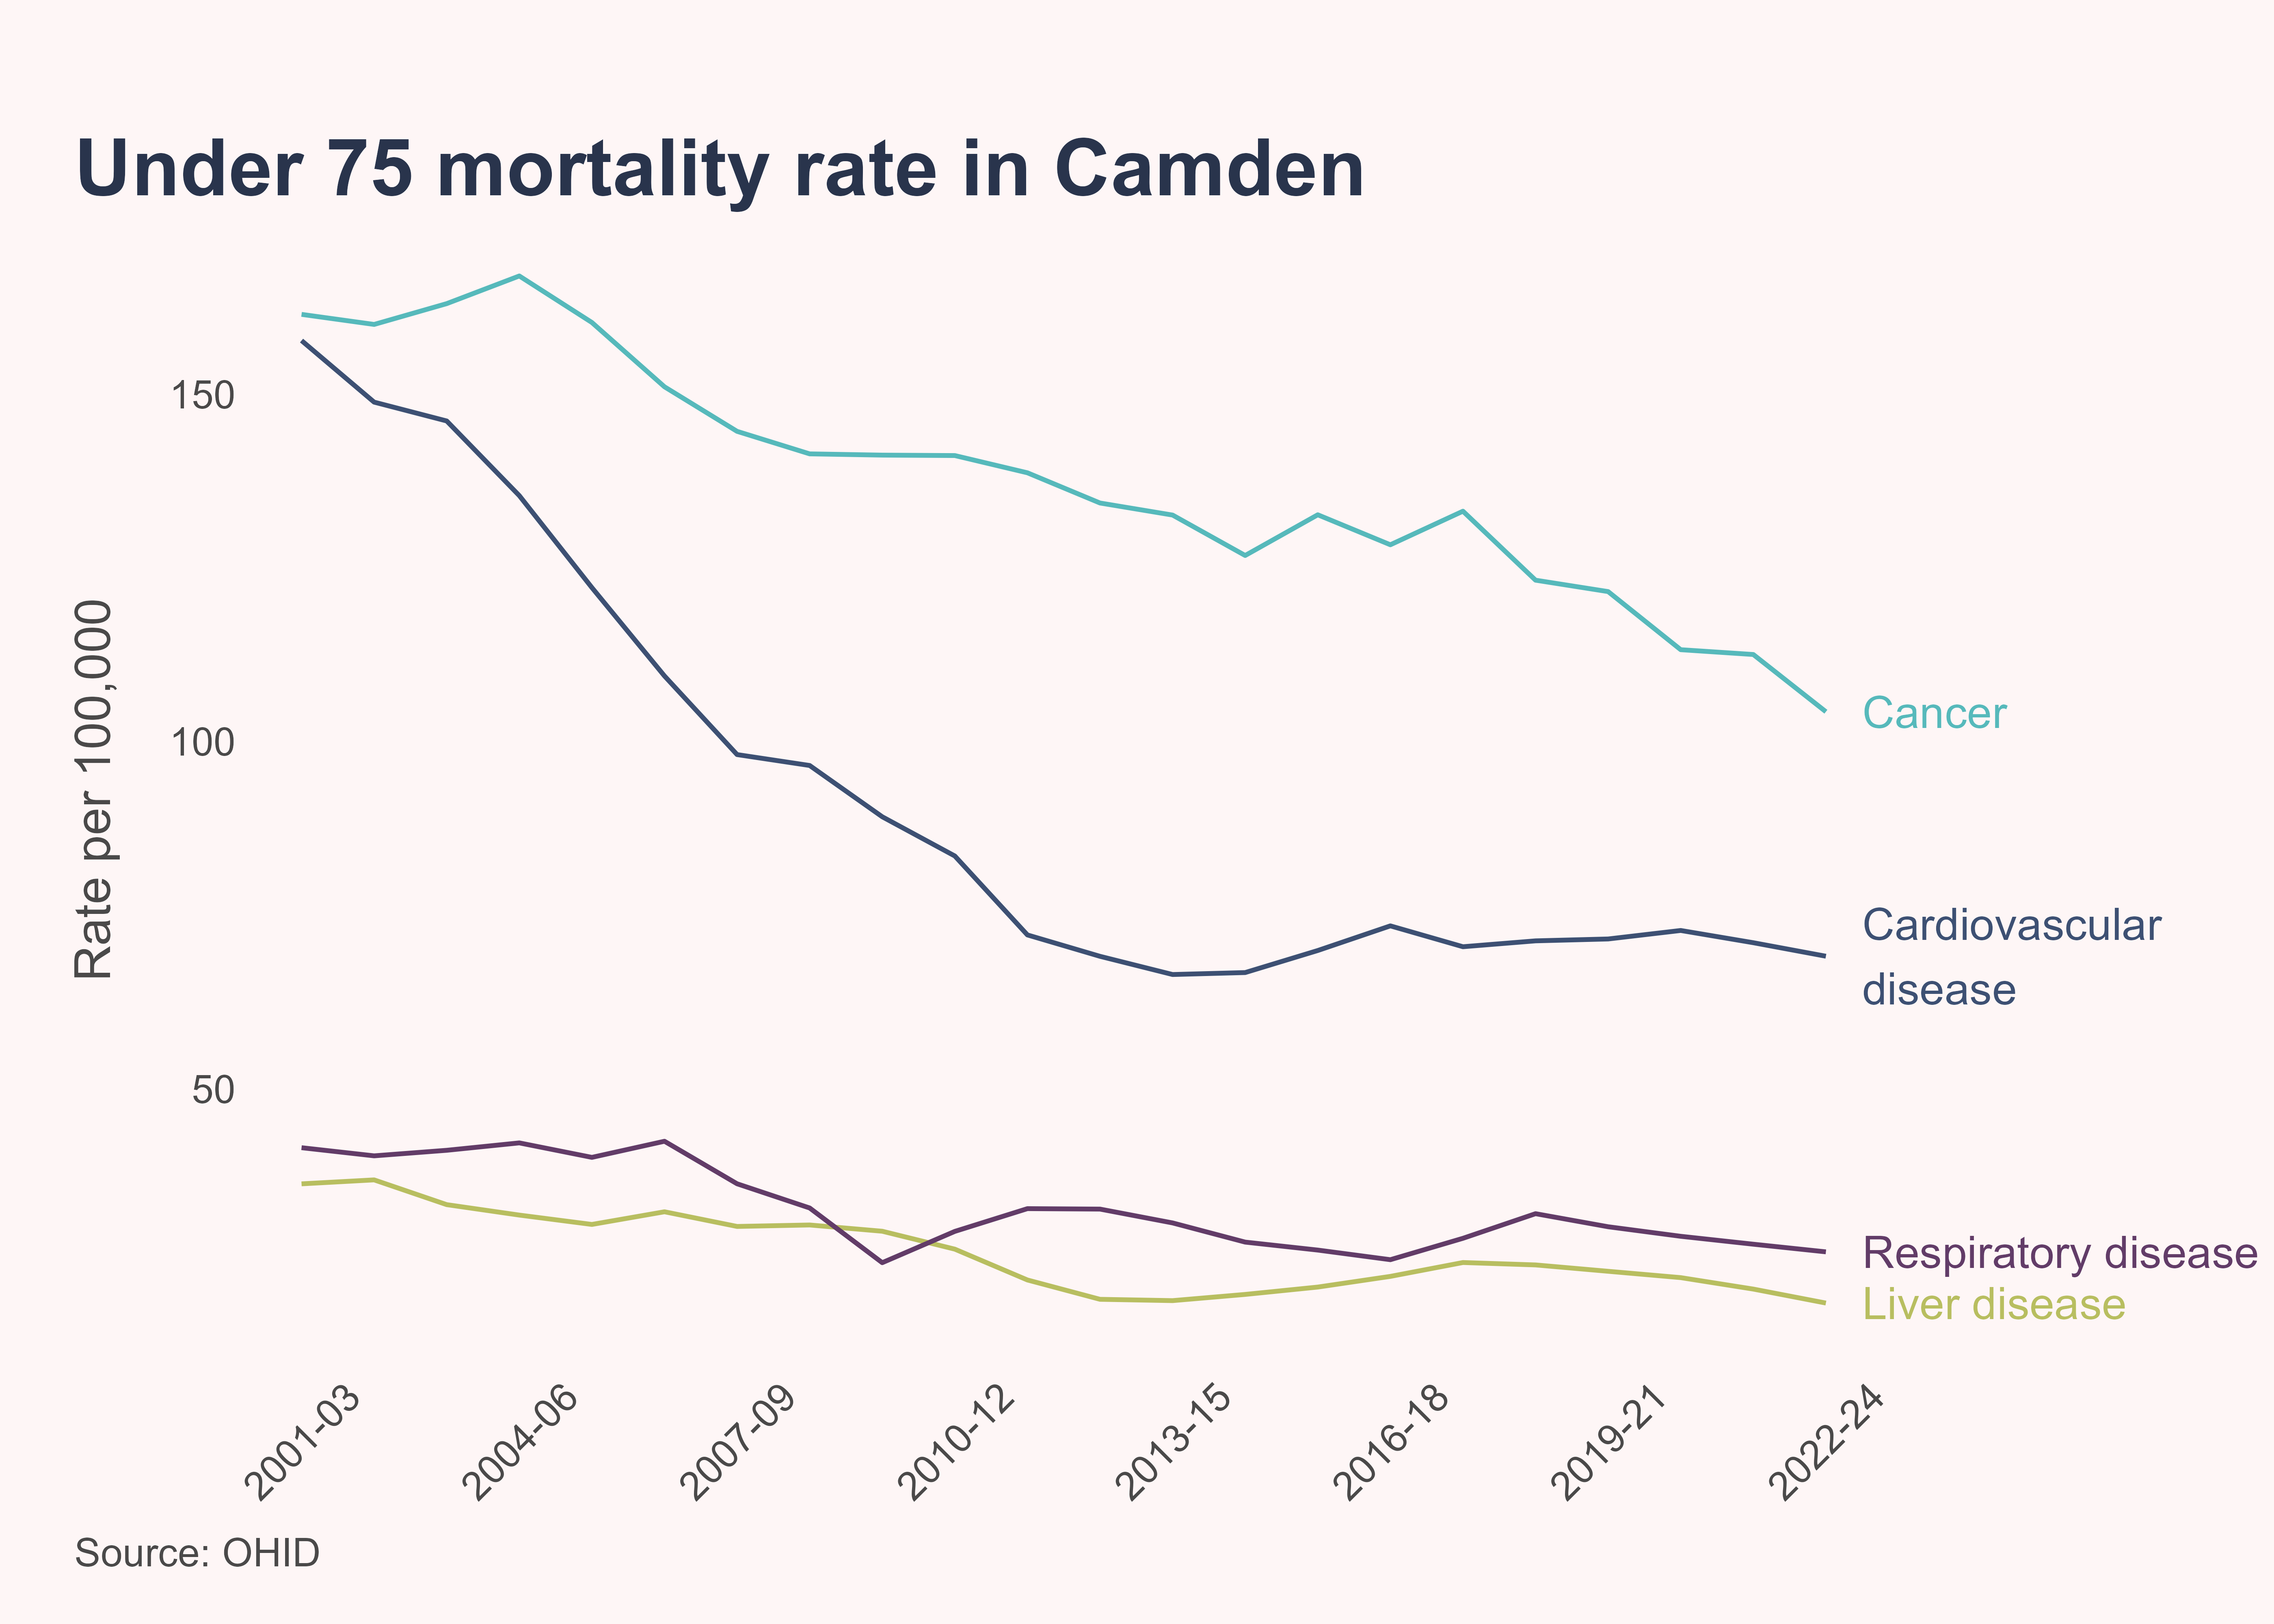
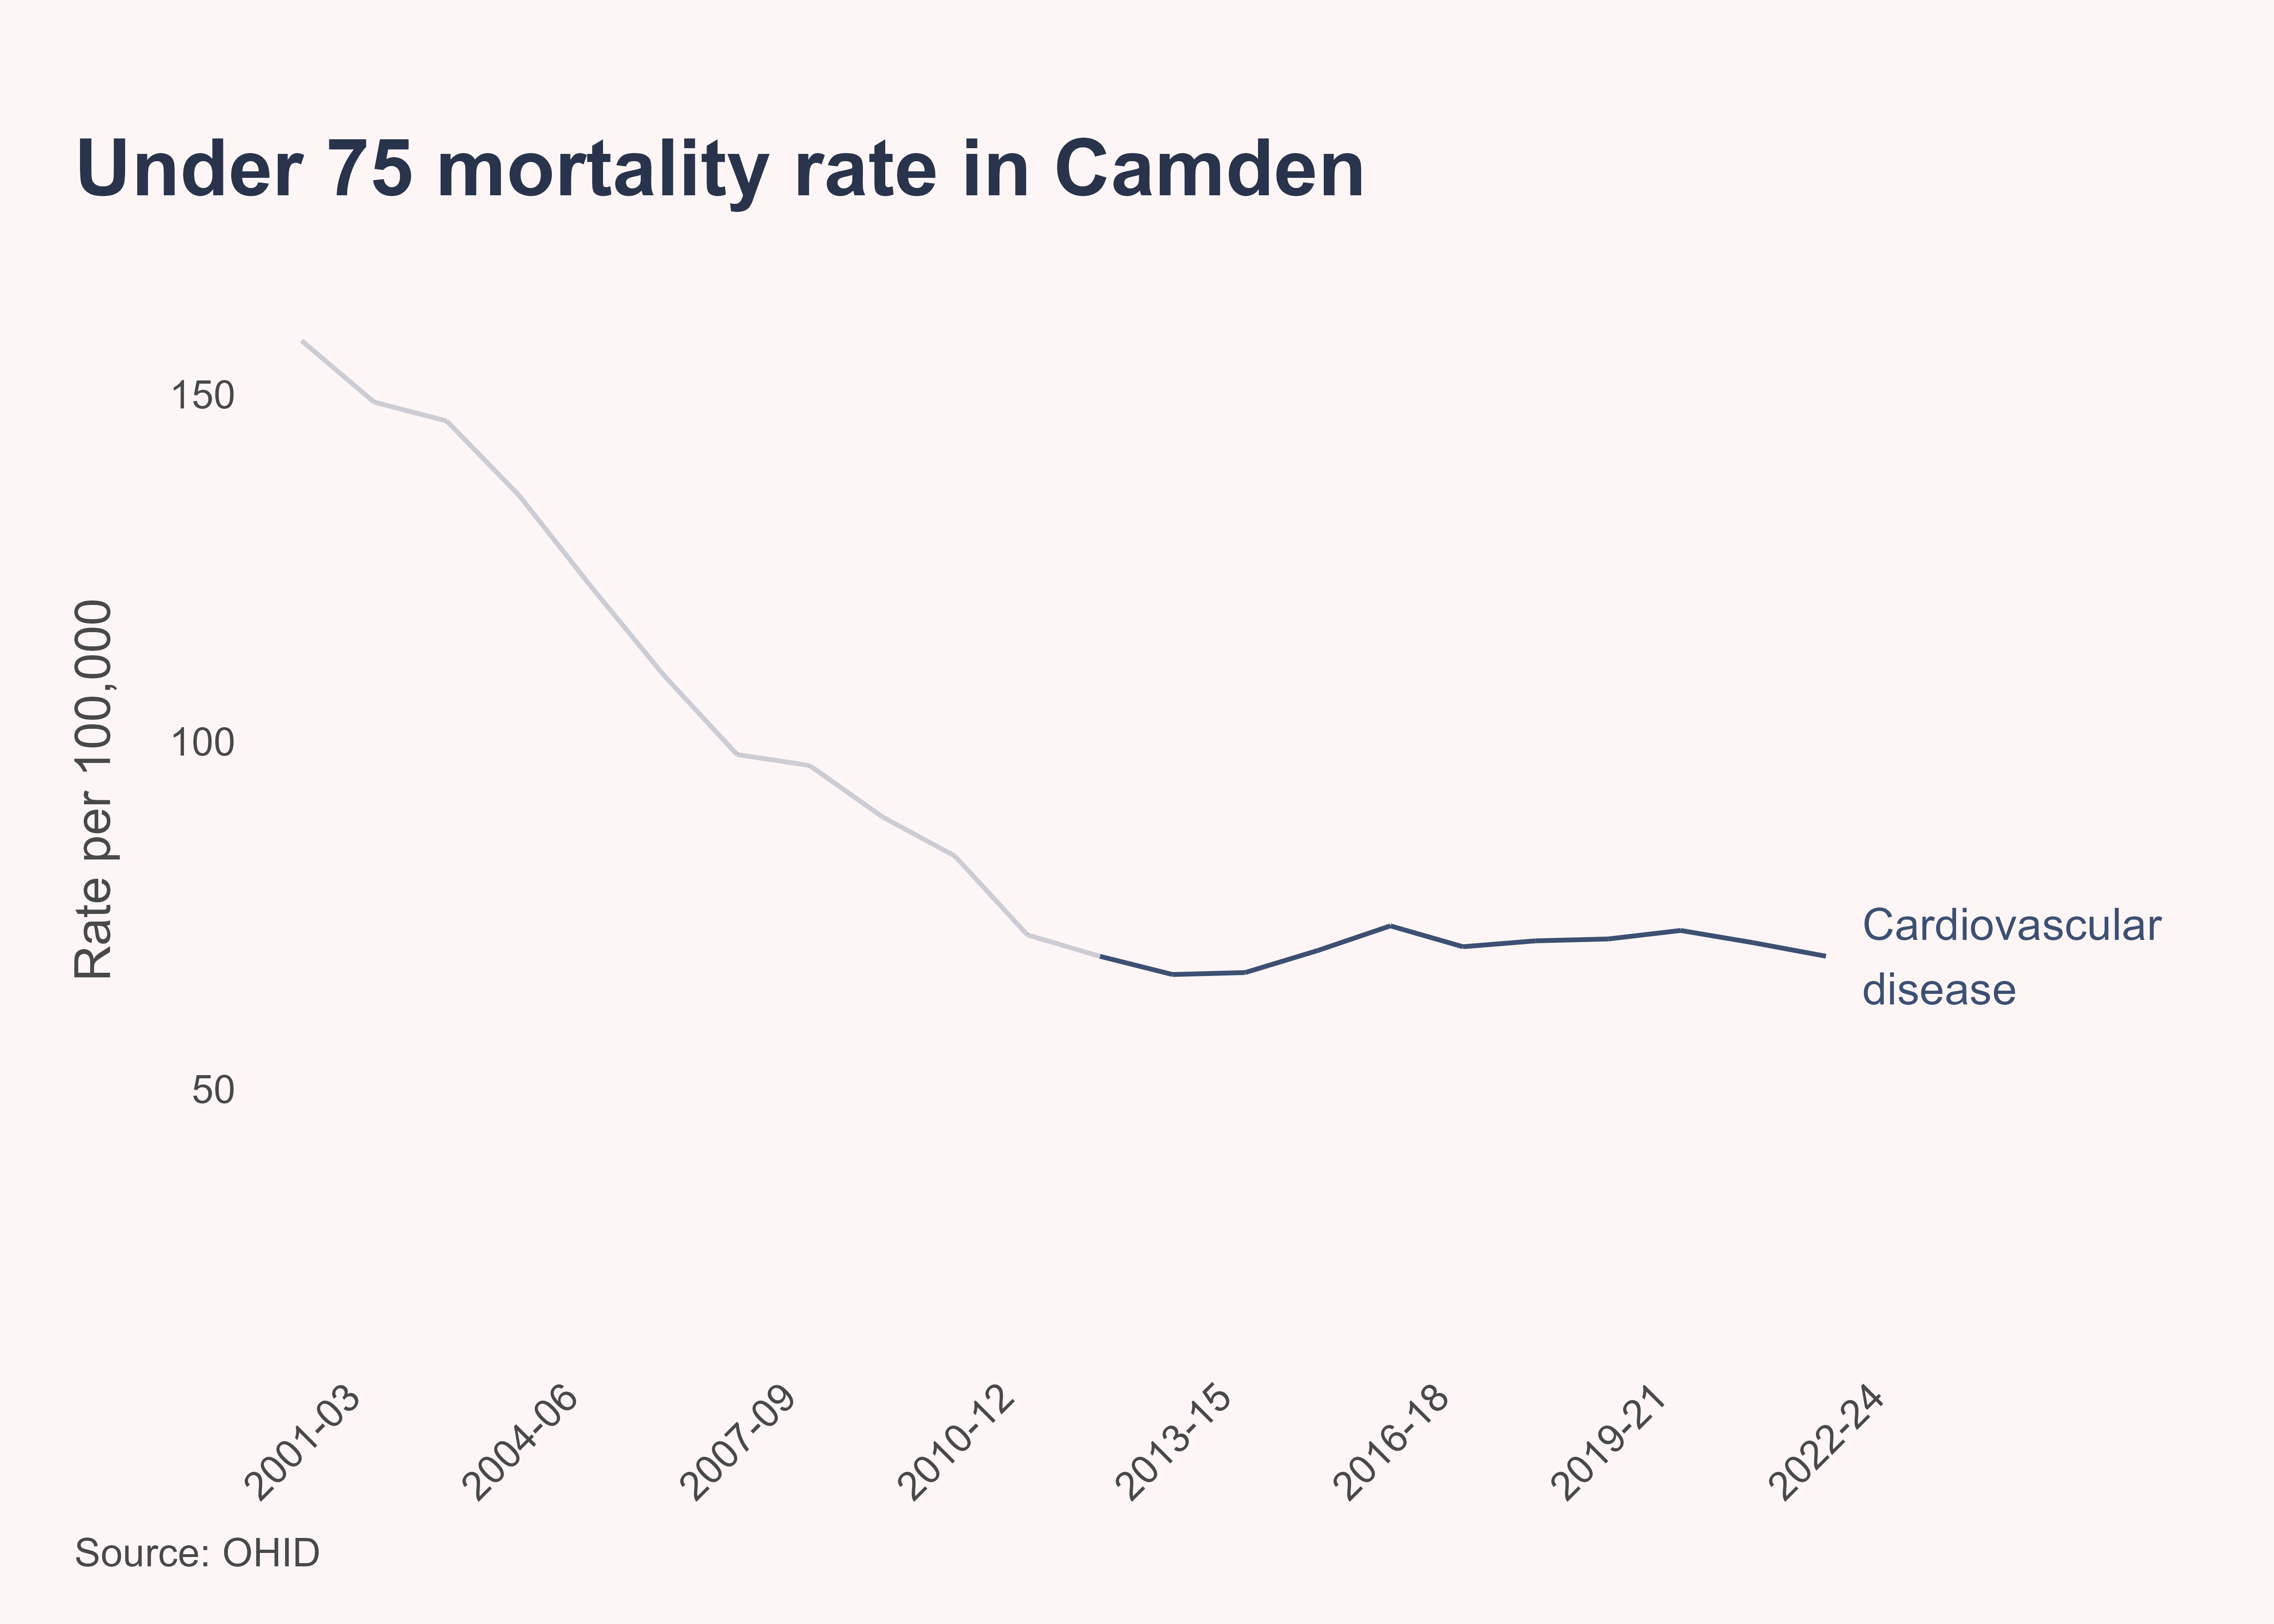
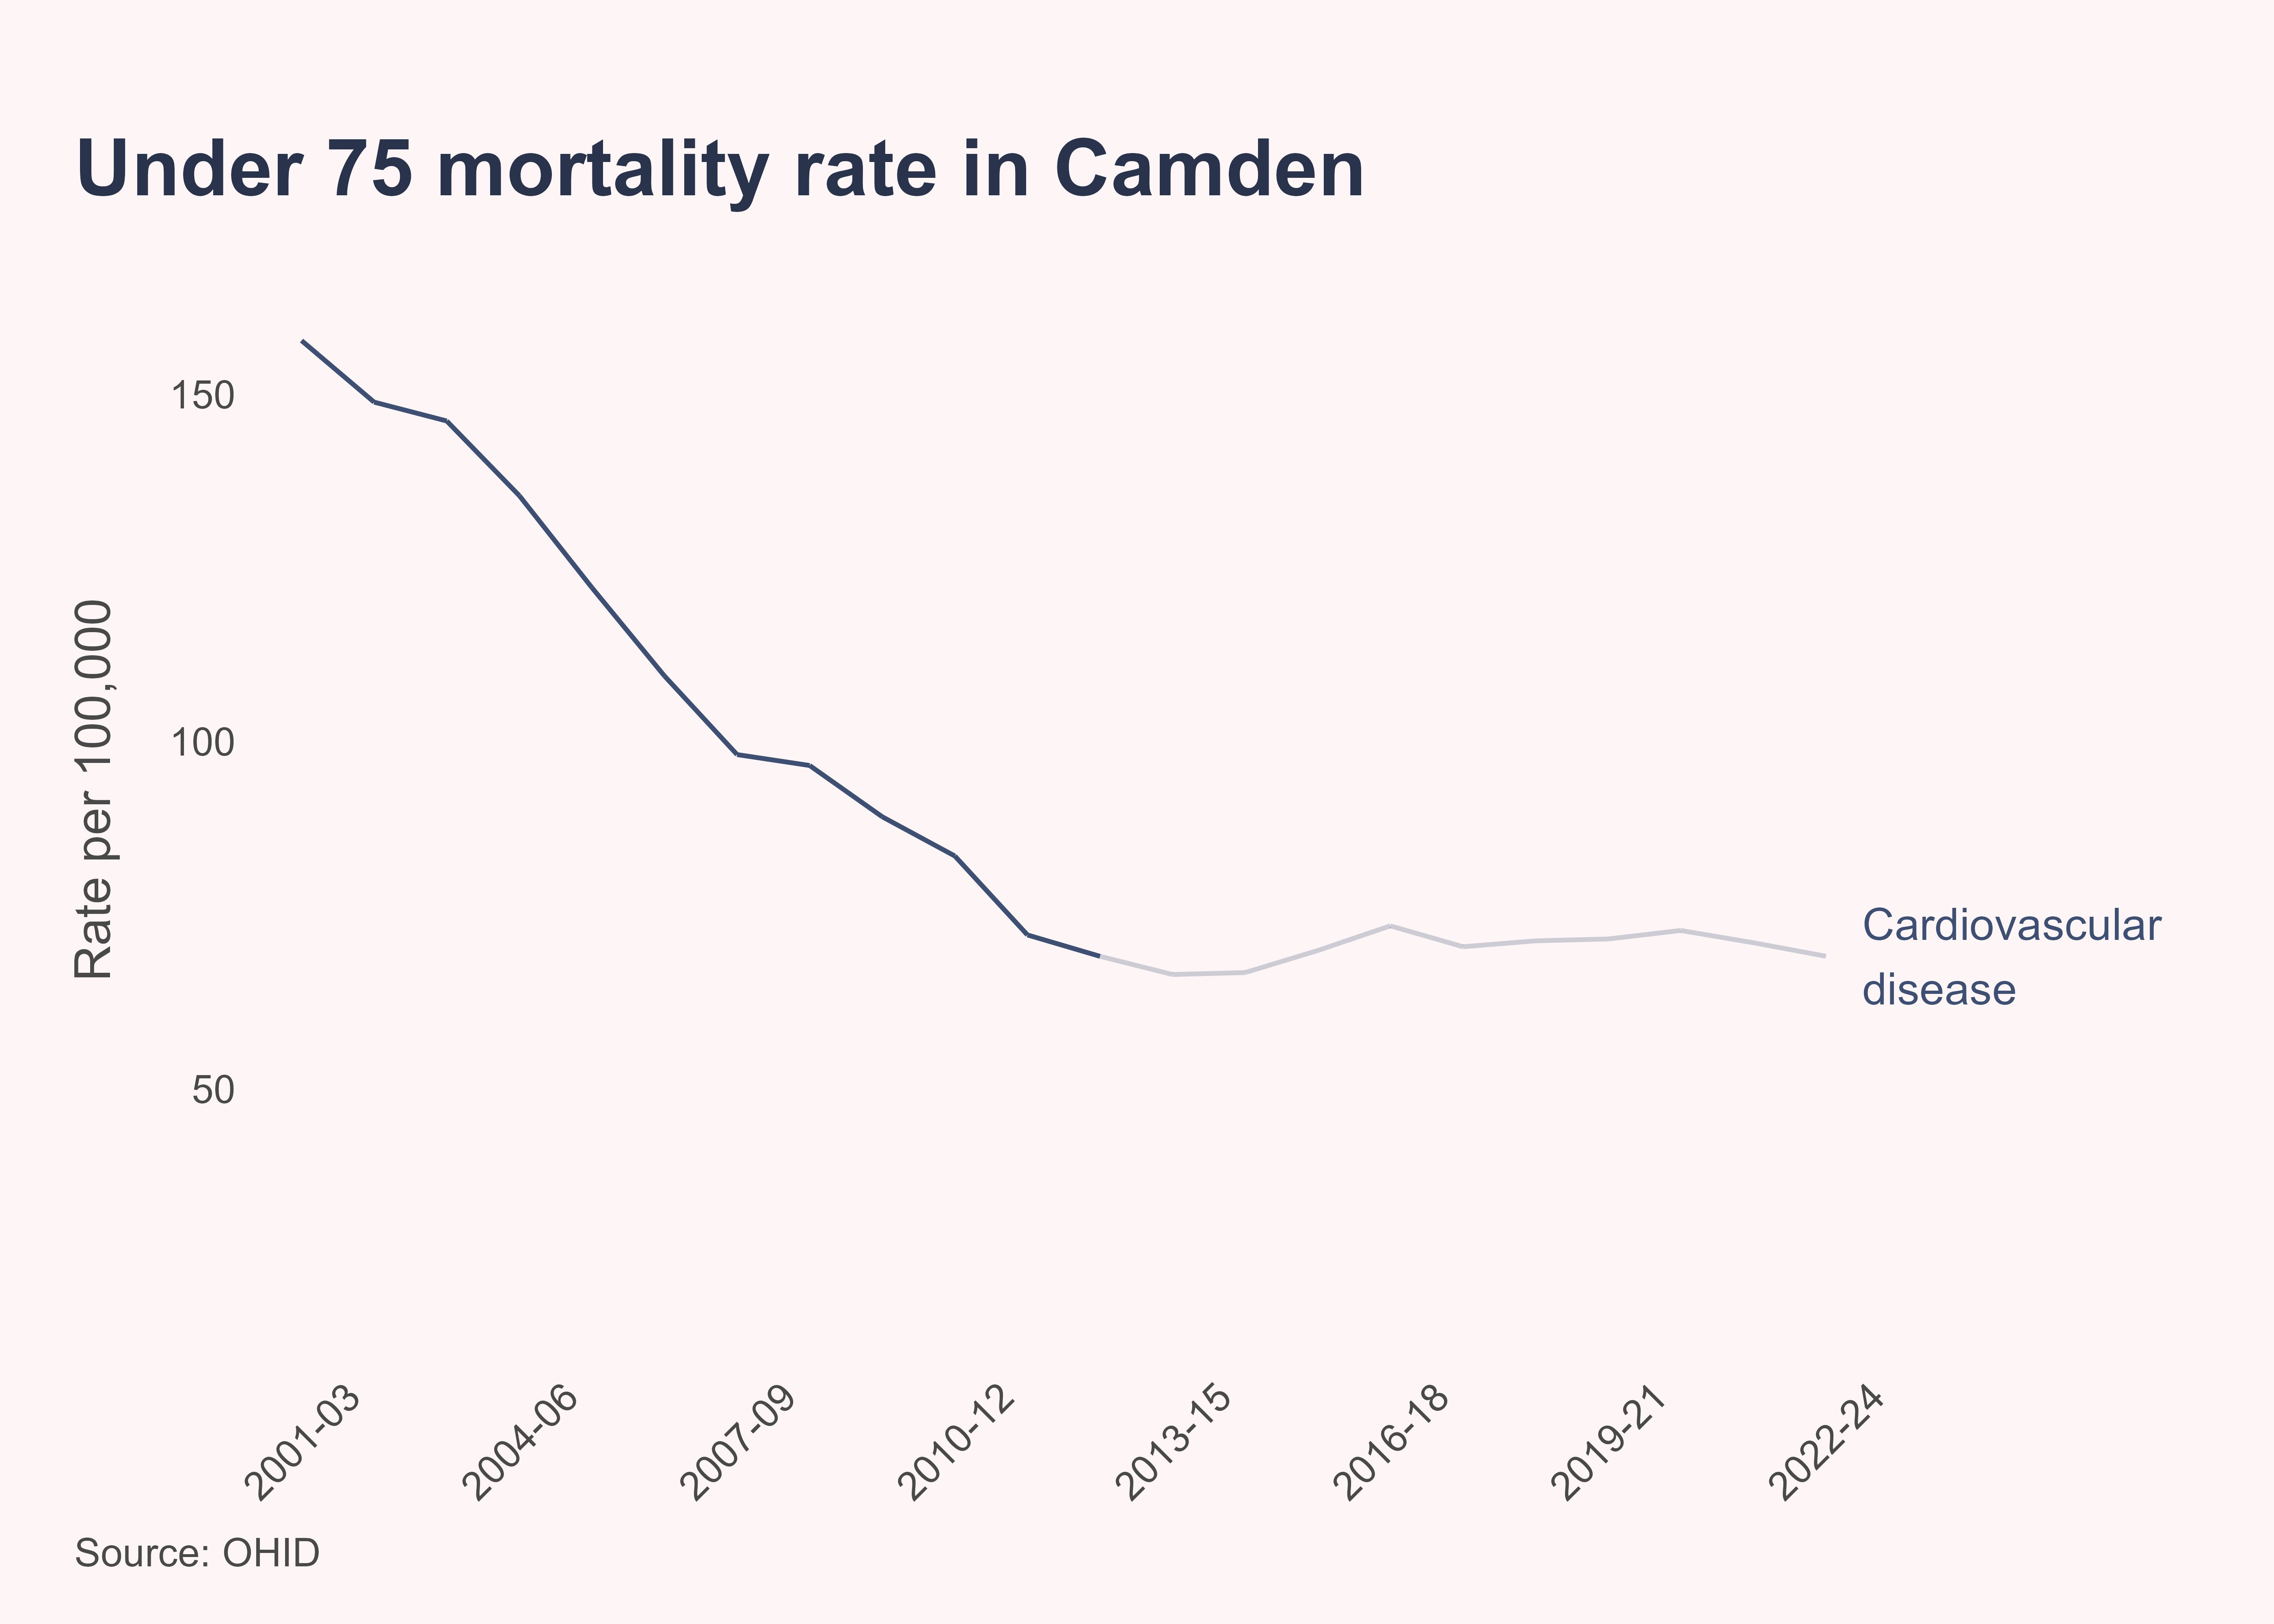
Deaths in people aged under 75 years are considered premature. In Camden, premature mortality from cardiovascular disease fell significantly in the early 2000s, reflecting improvements in prevention and treatment.
But this progress has slowed in recent years, mirroring national trends.
And despite these long-term gains, cardiovascular disease remains one of the leading causes of premature mortality in Camden - second only to cancer - responsible for 294 deaths in those aged under 75 years between 2022-24.
Cardiovascular disease is strongly associated with health inequalities
There are substantial differences in heart health, with some population groups experiencing a significantly higher burden of ill health and mortality. This is largely driven by the uneven distribution of associated risk factors - many of which are modifiable, such as obesity, smoking, hypertension and physical inactivity.
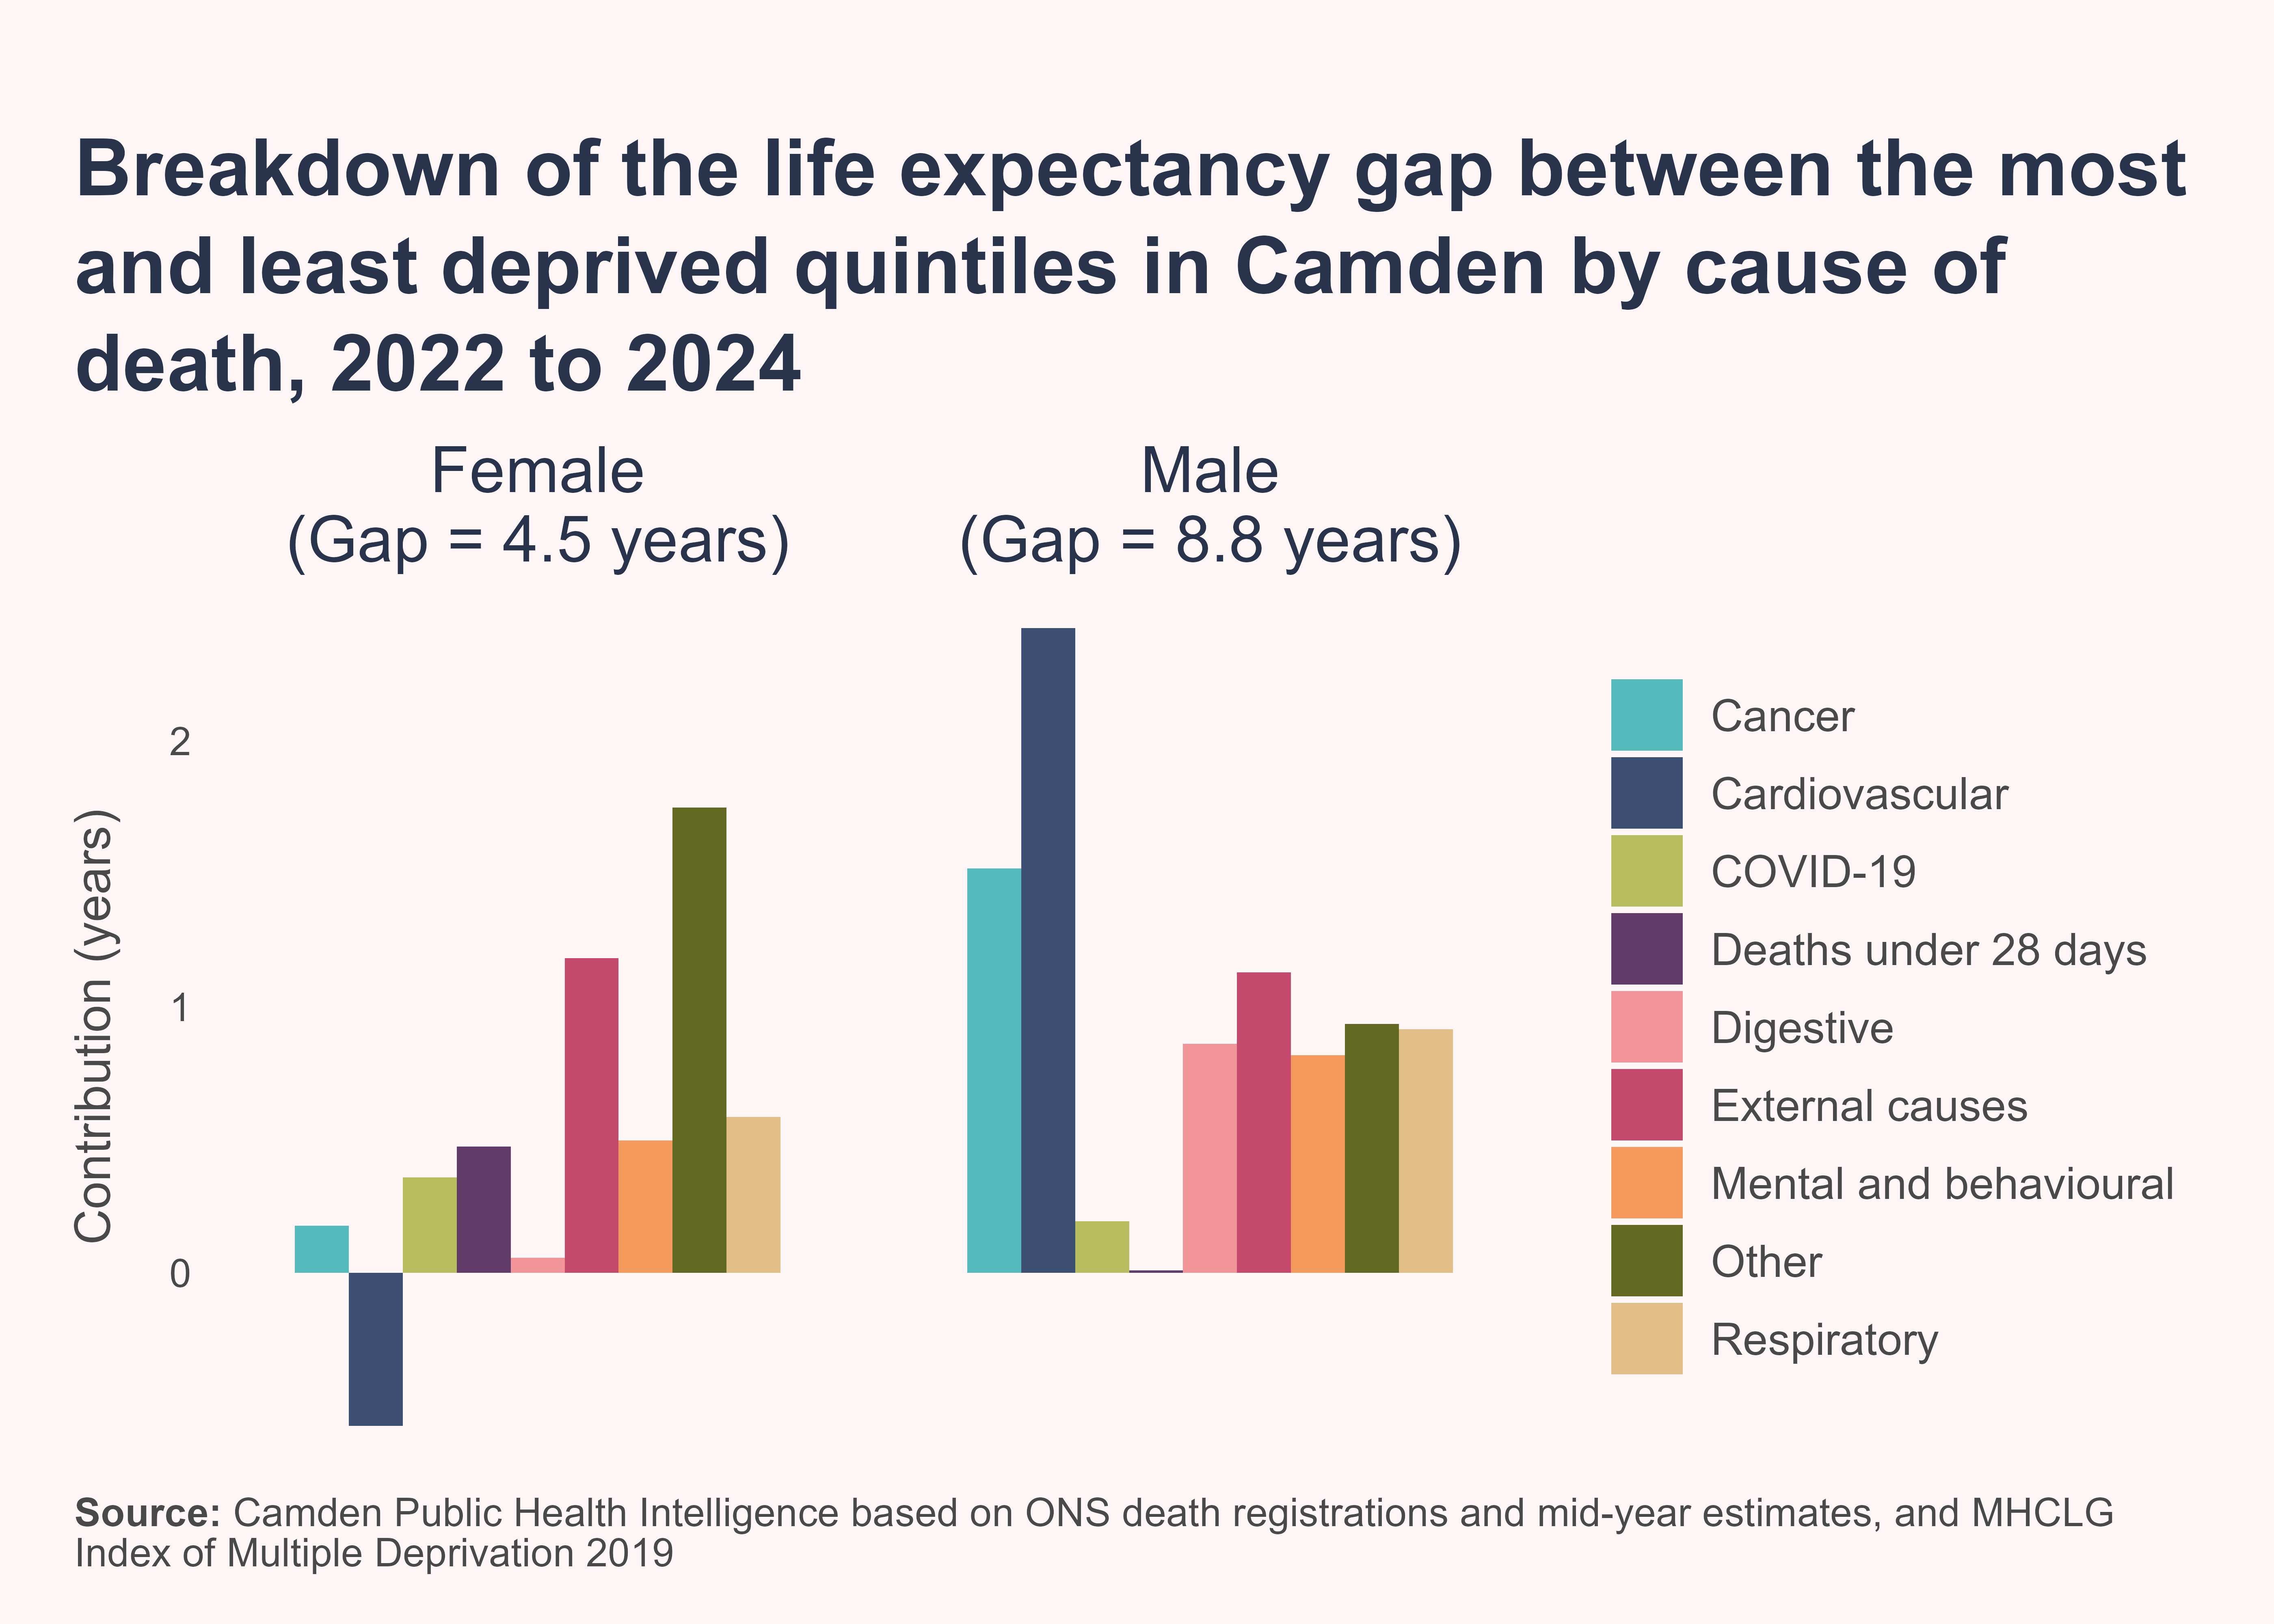
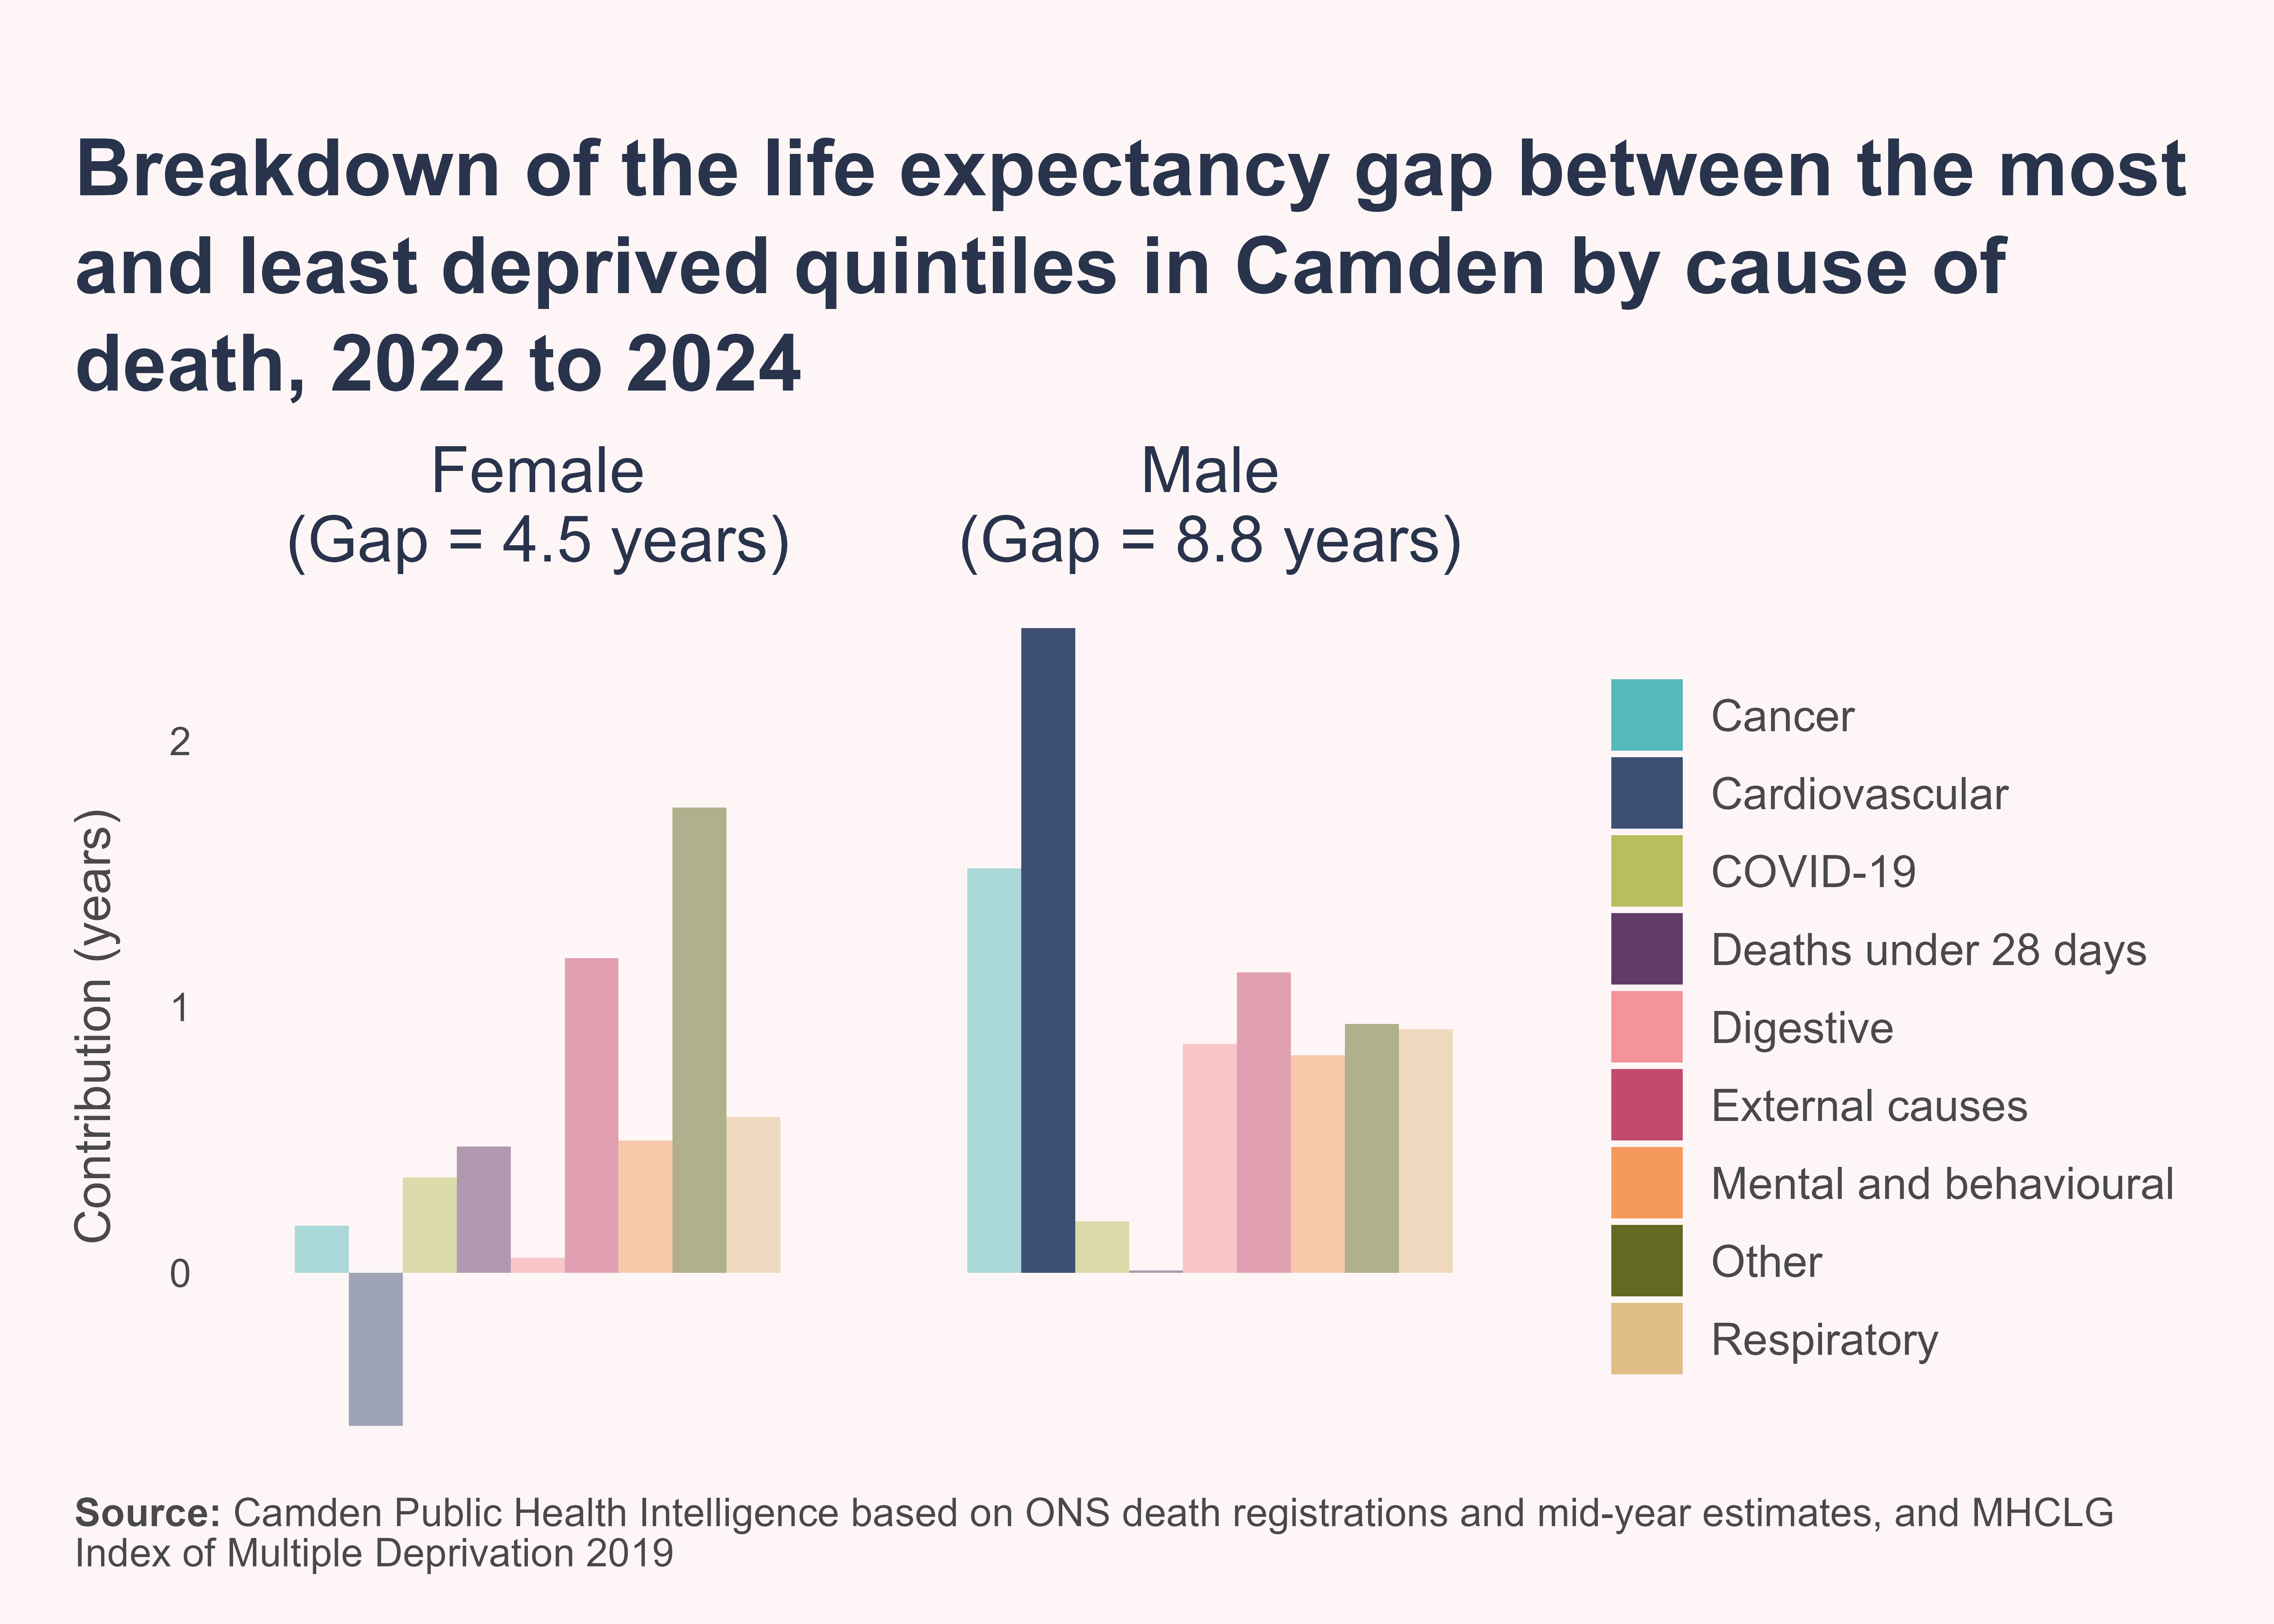
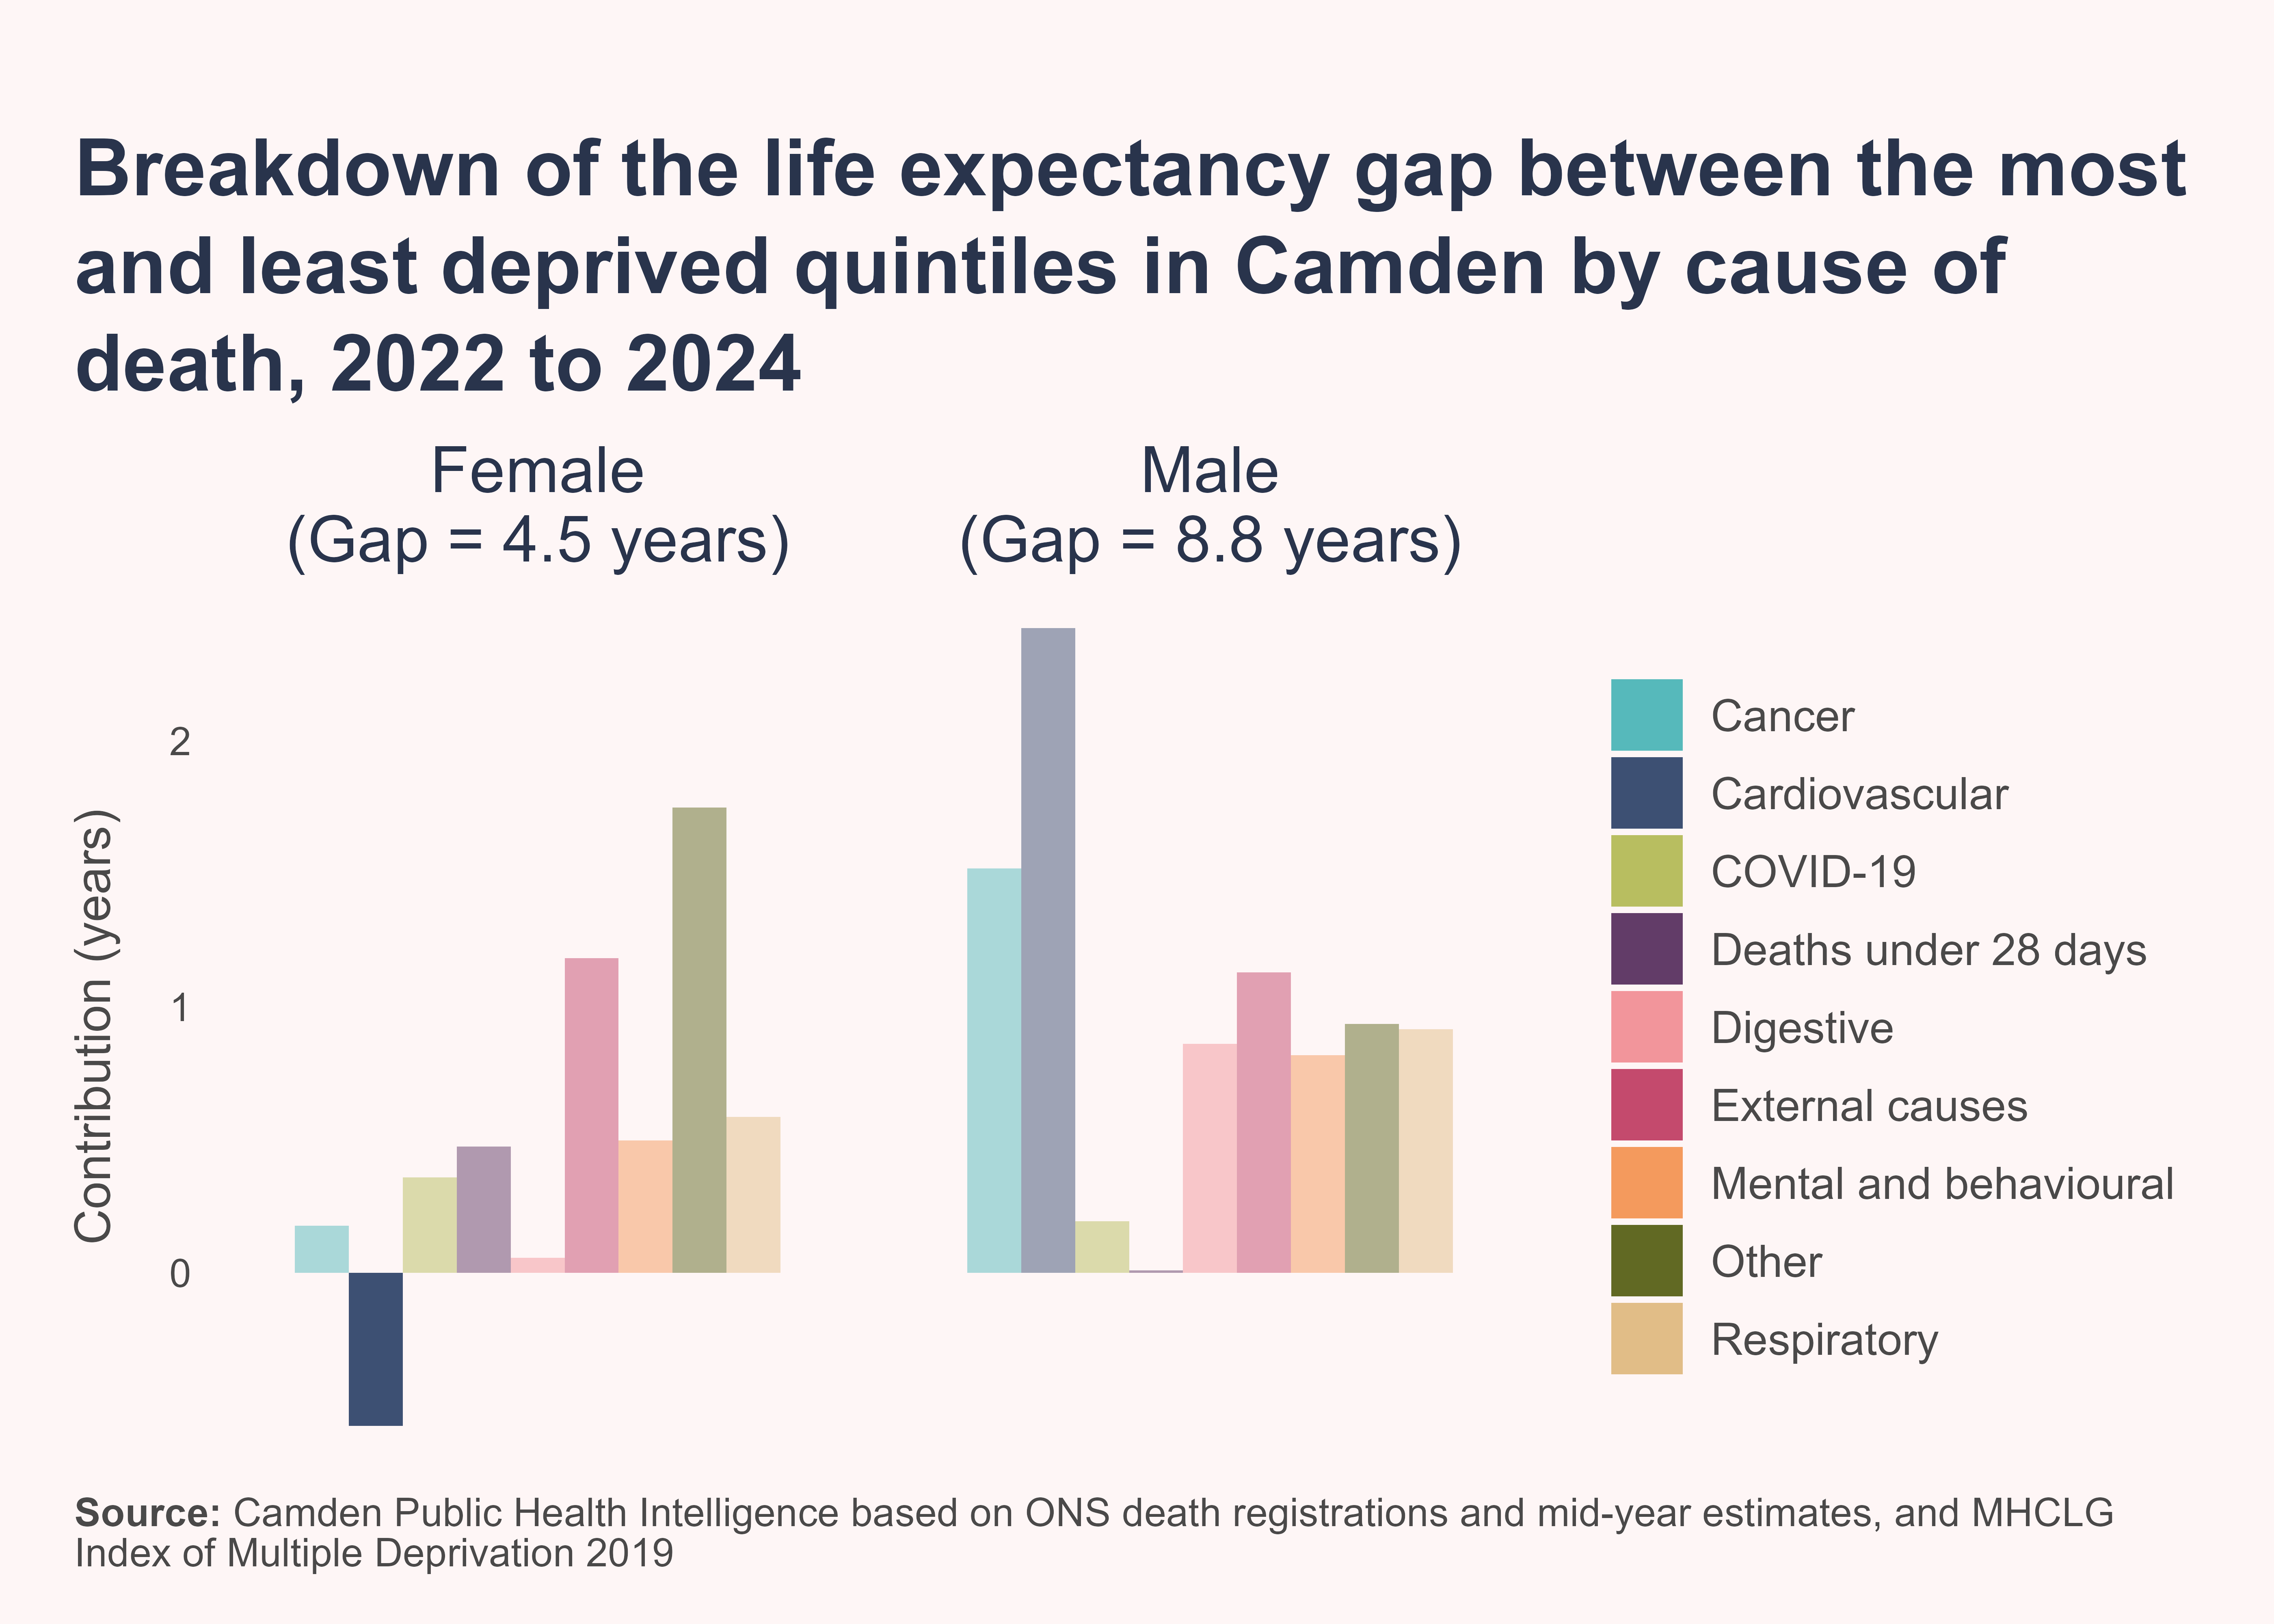
Between 2022 to 2024, cardiovascular disease was the largest contributor to the life expectancy gap among males in Camden - accounting for around one quarter of the difference between the most and least deprived areas.
Among females, however, cardiovascular disease contributed negatively to the gap, with higher mortality rates in the least deprived areas.
There are also considerable inequalities in the distribution of ill health from cardiovascular disease
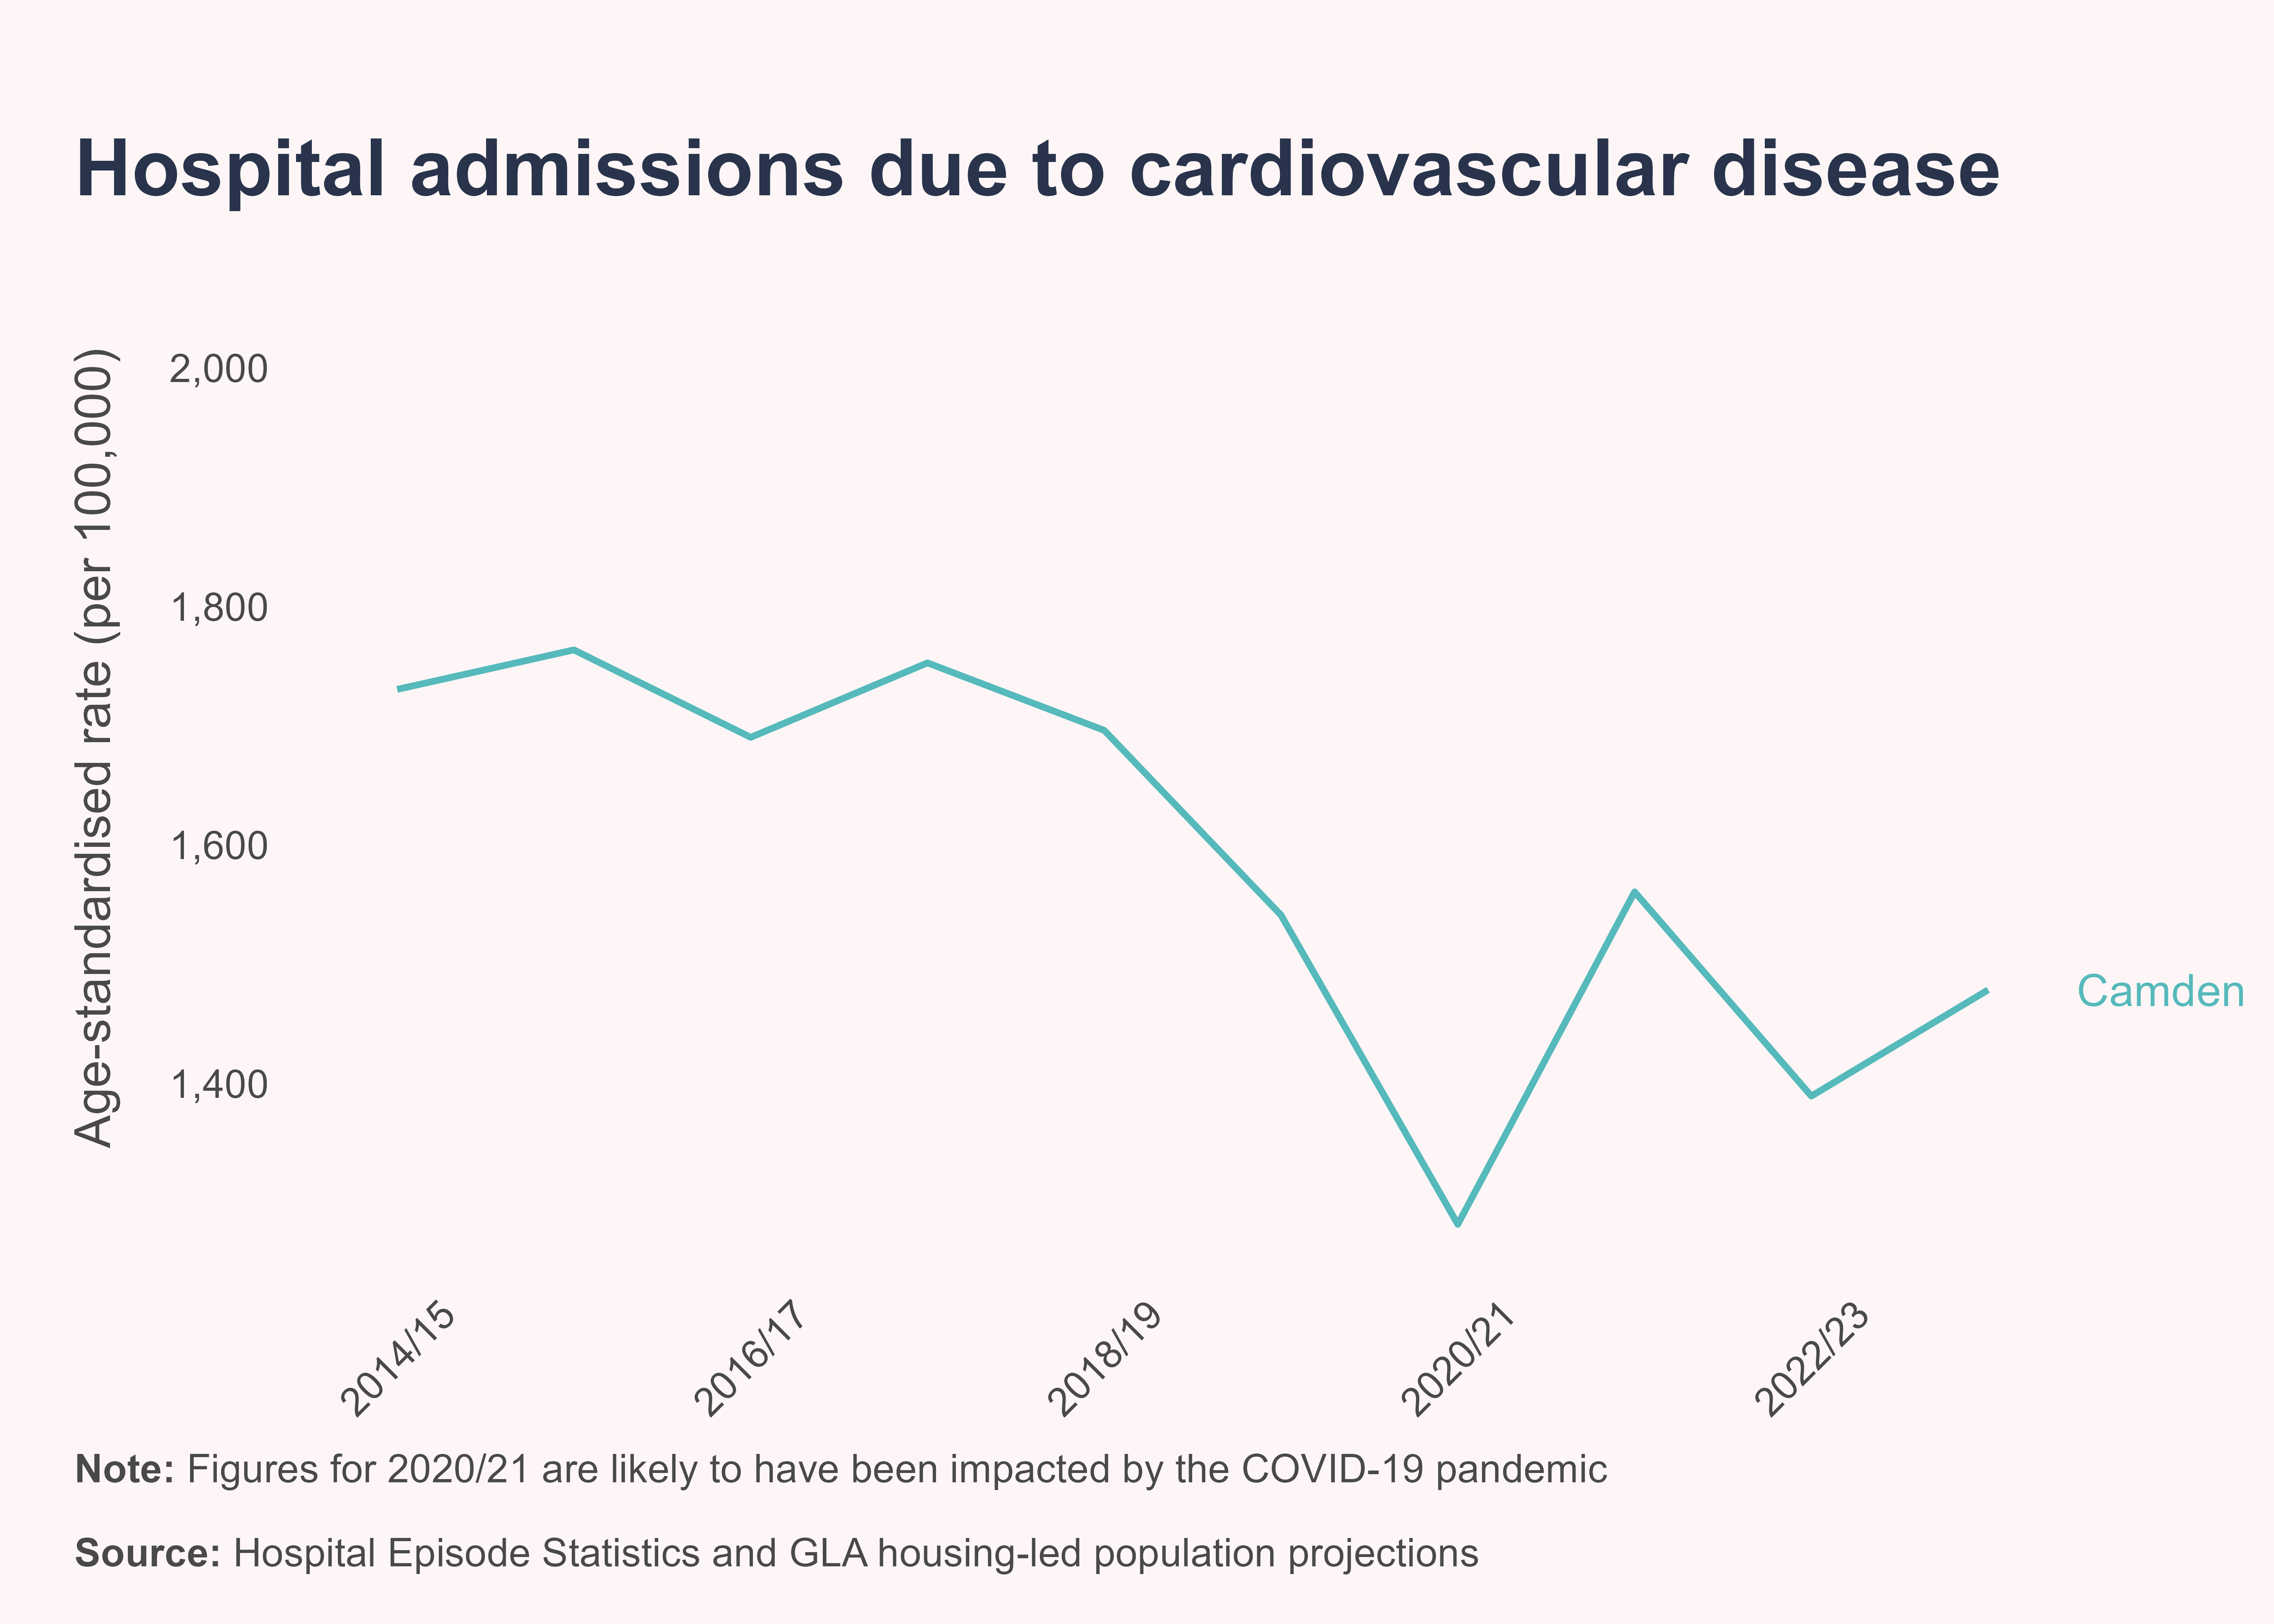
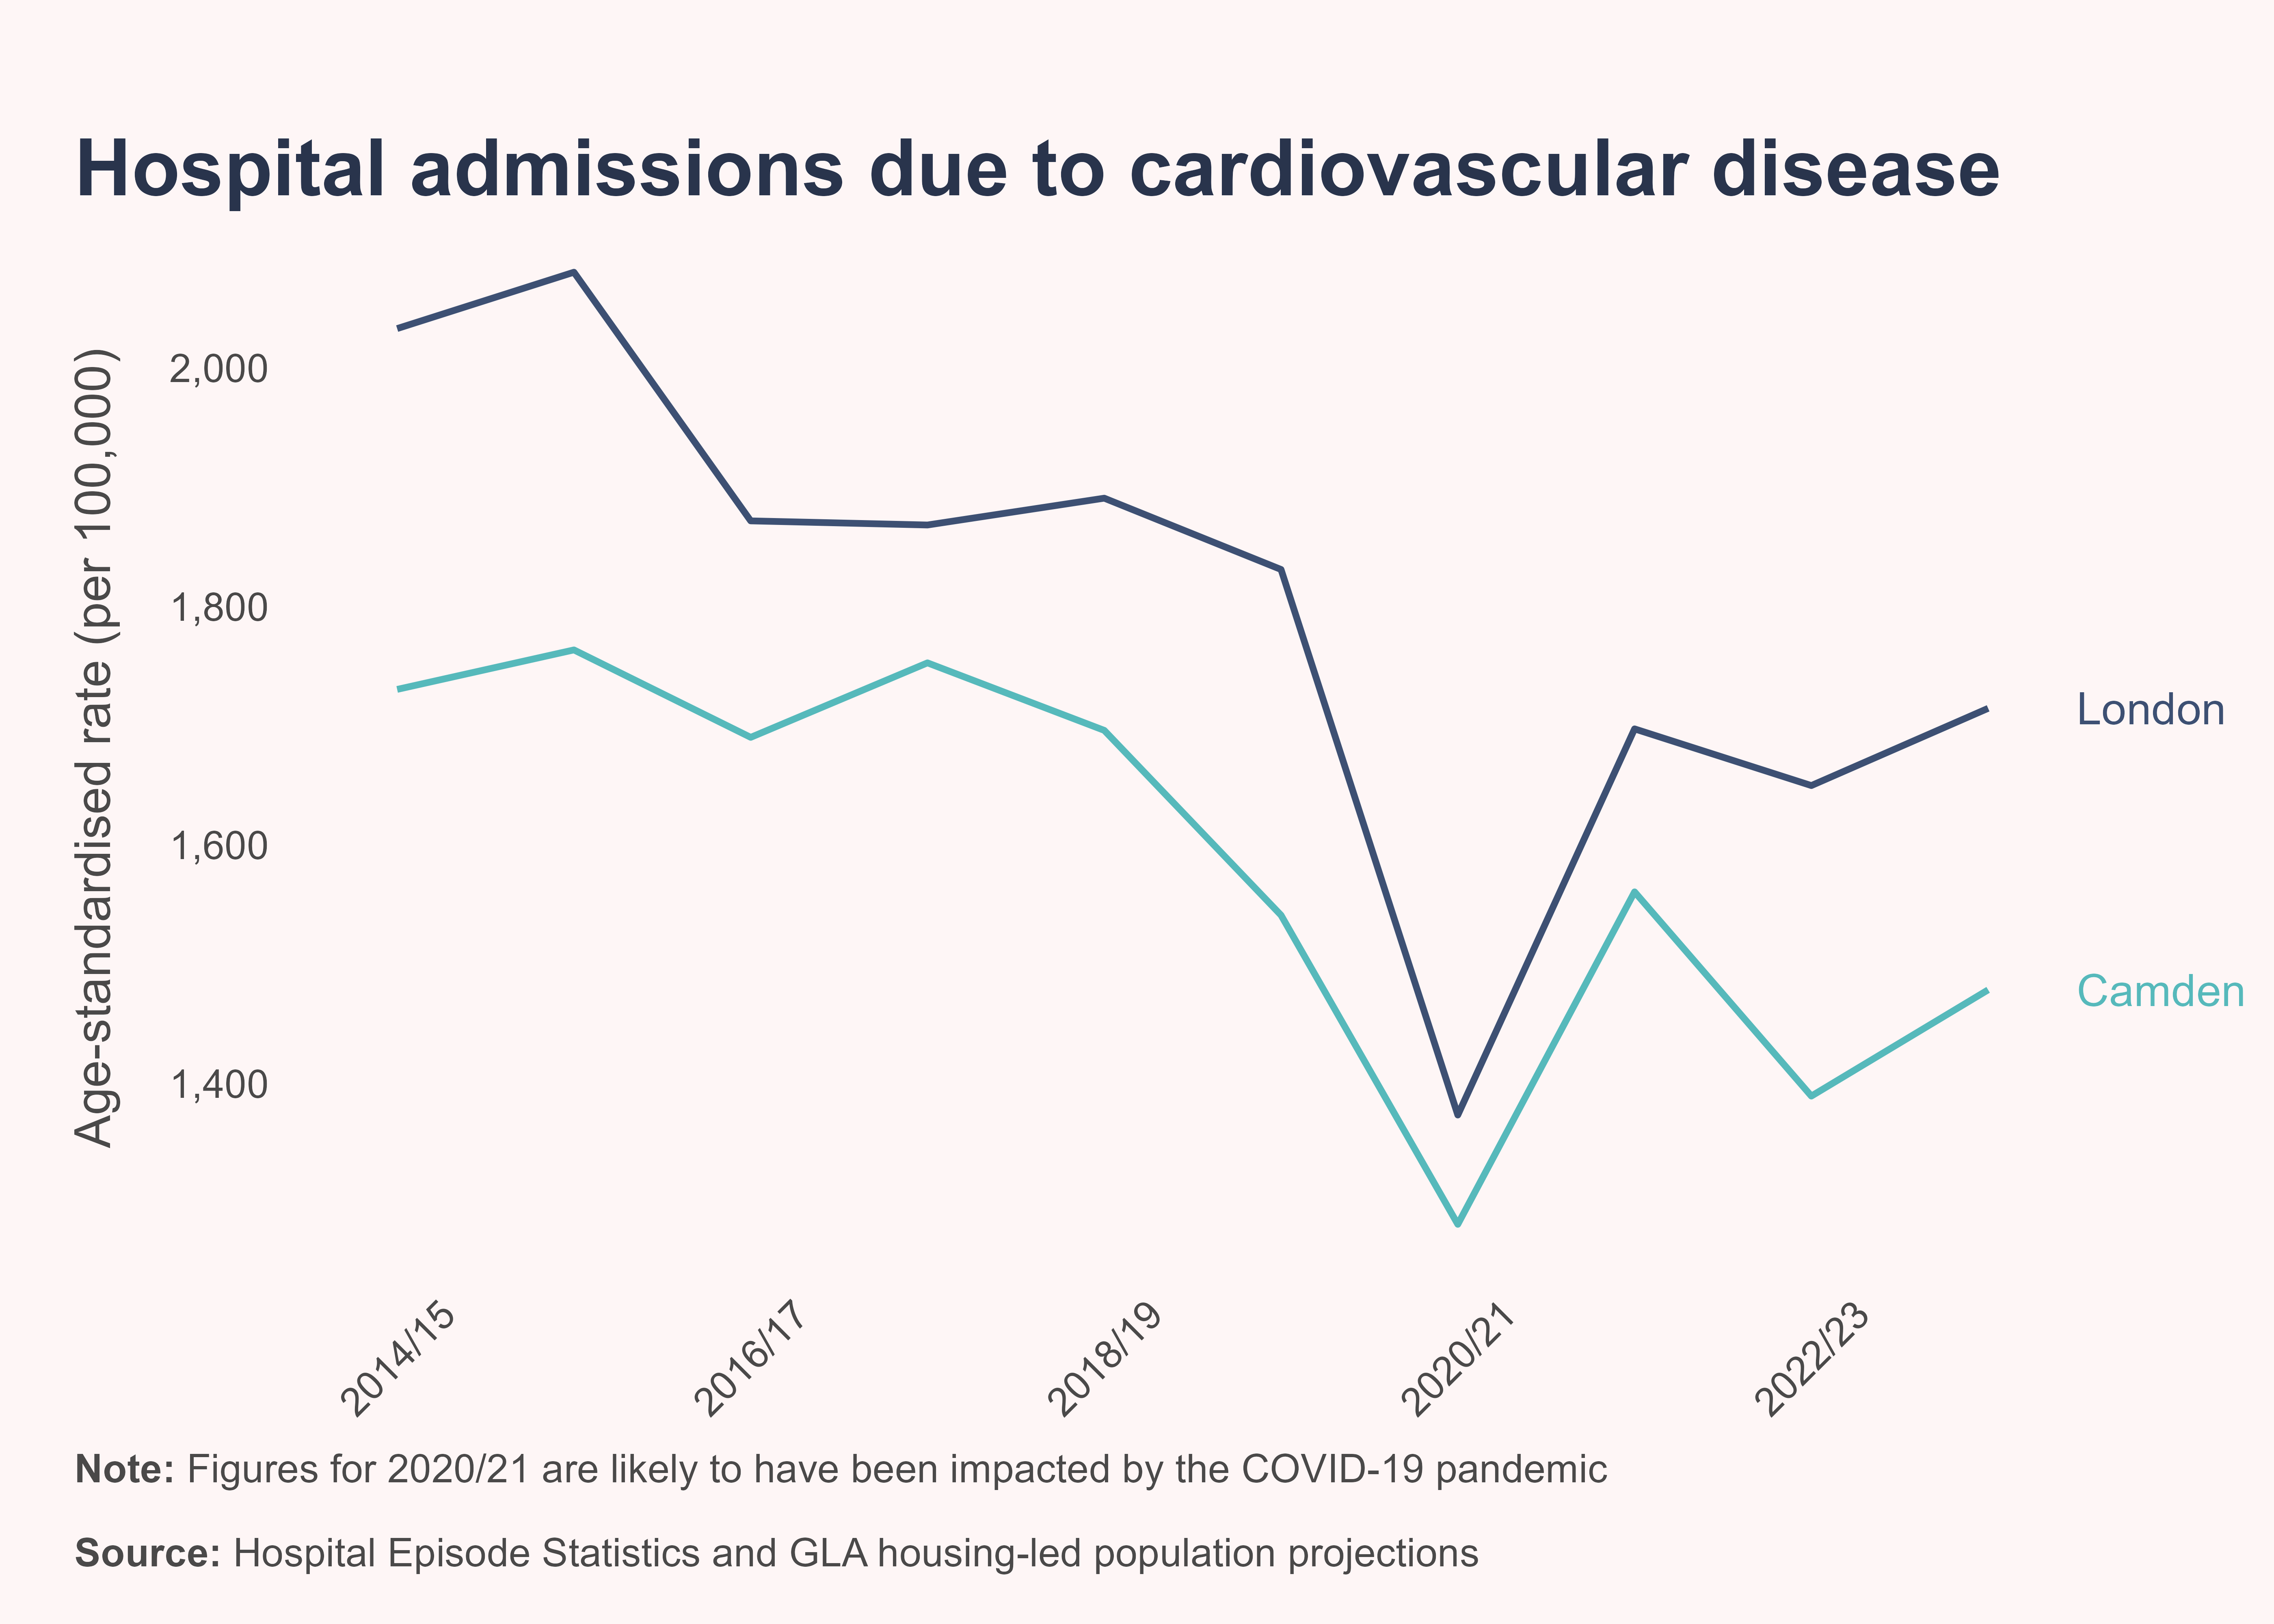
In Camden, the rate of hospital admissions from cardiovascular disease has decreased over the past decade.
With the rate remaining significantly lower than the London average.
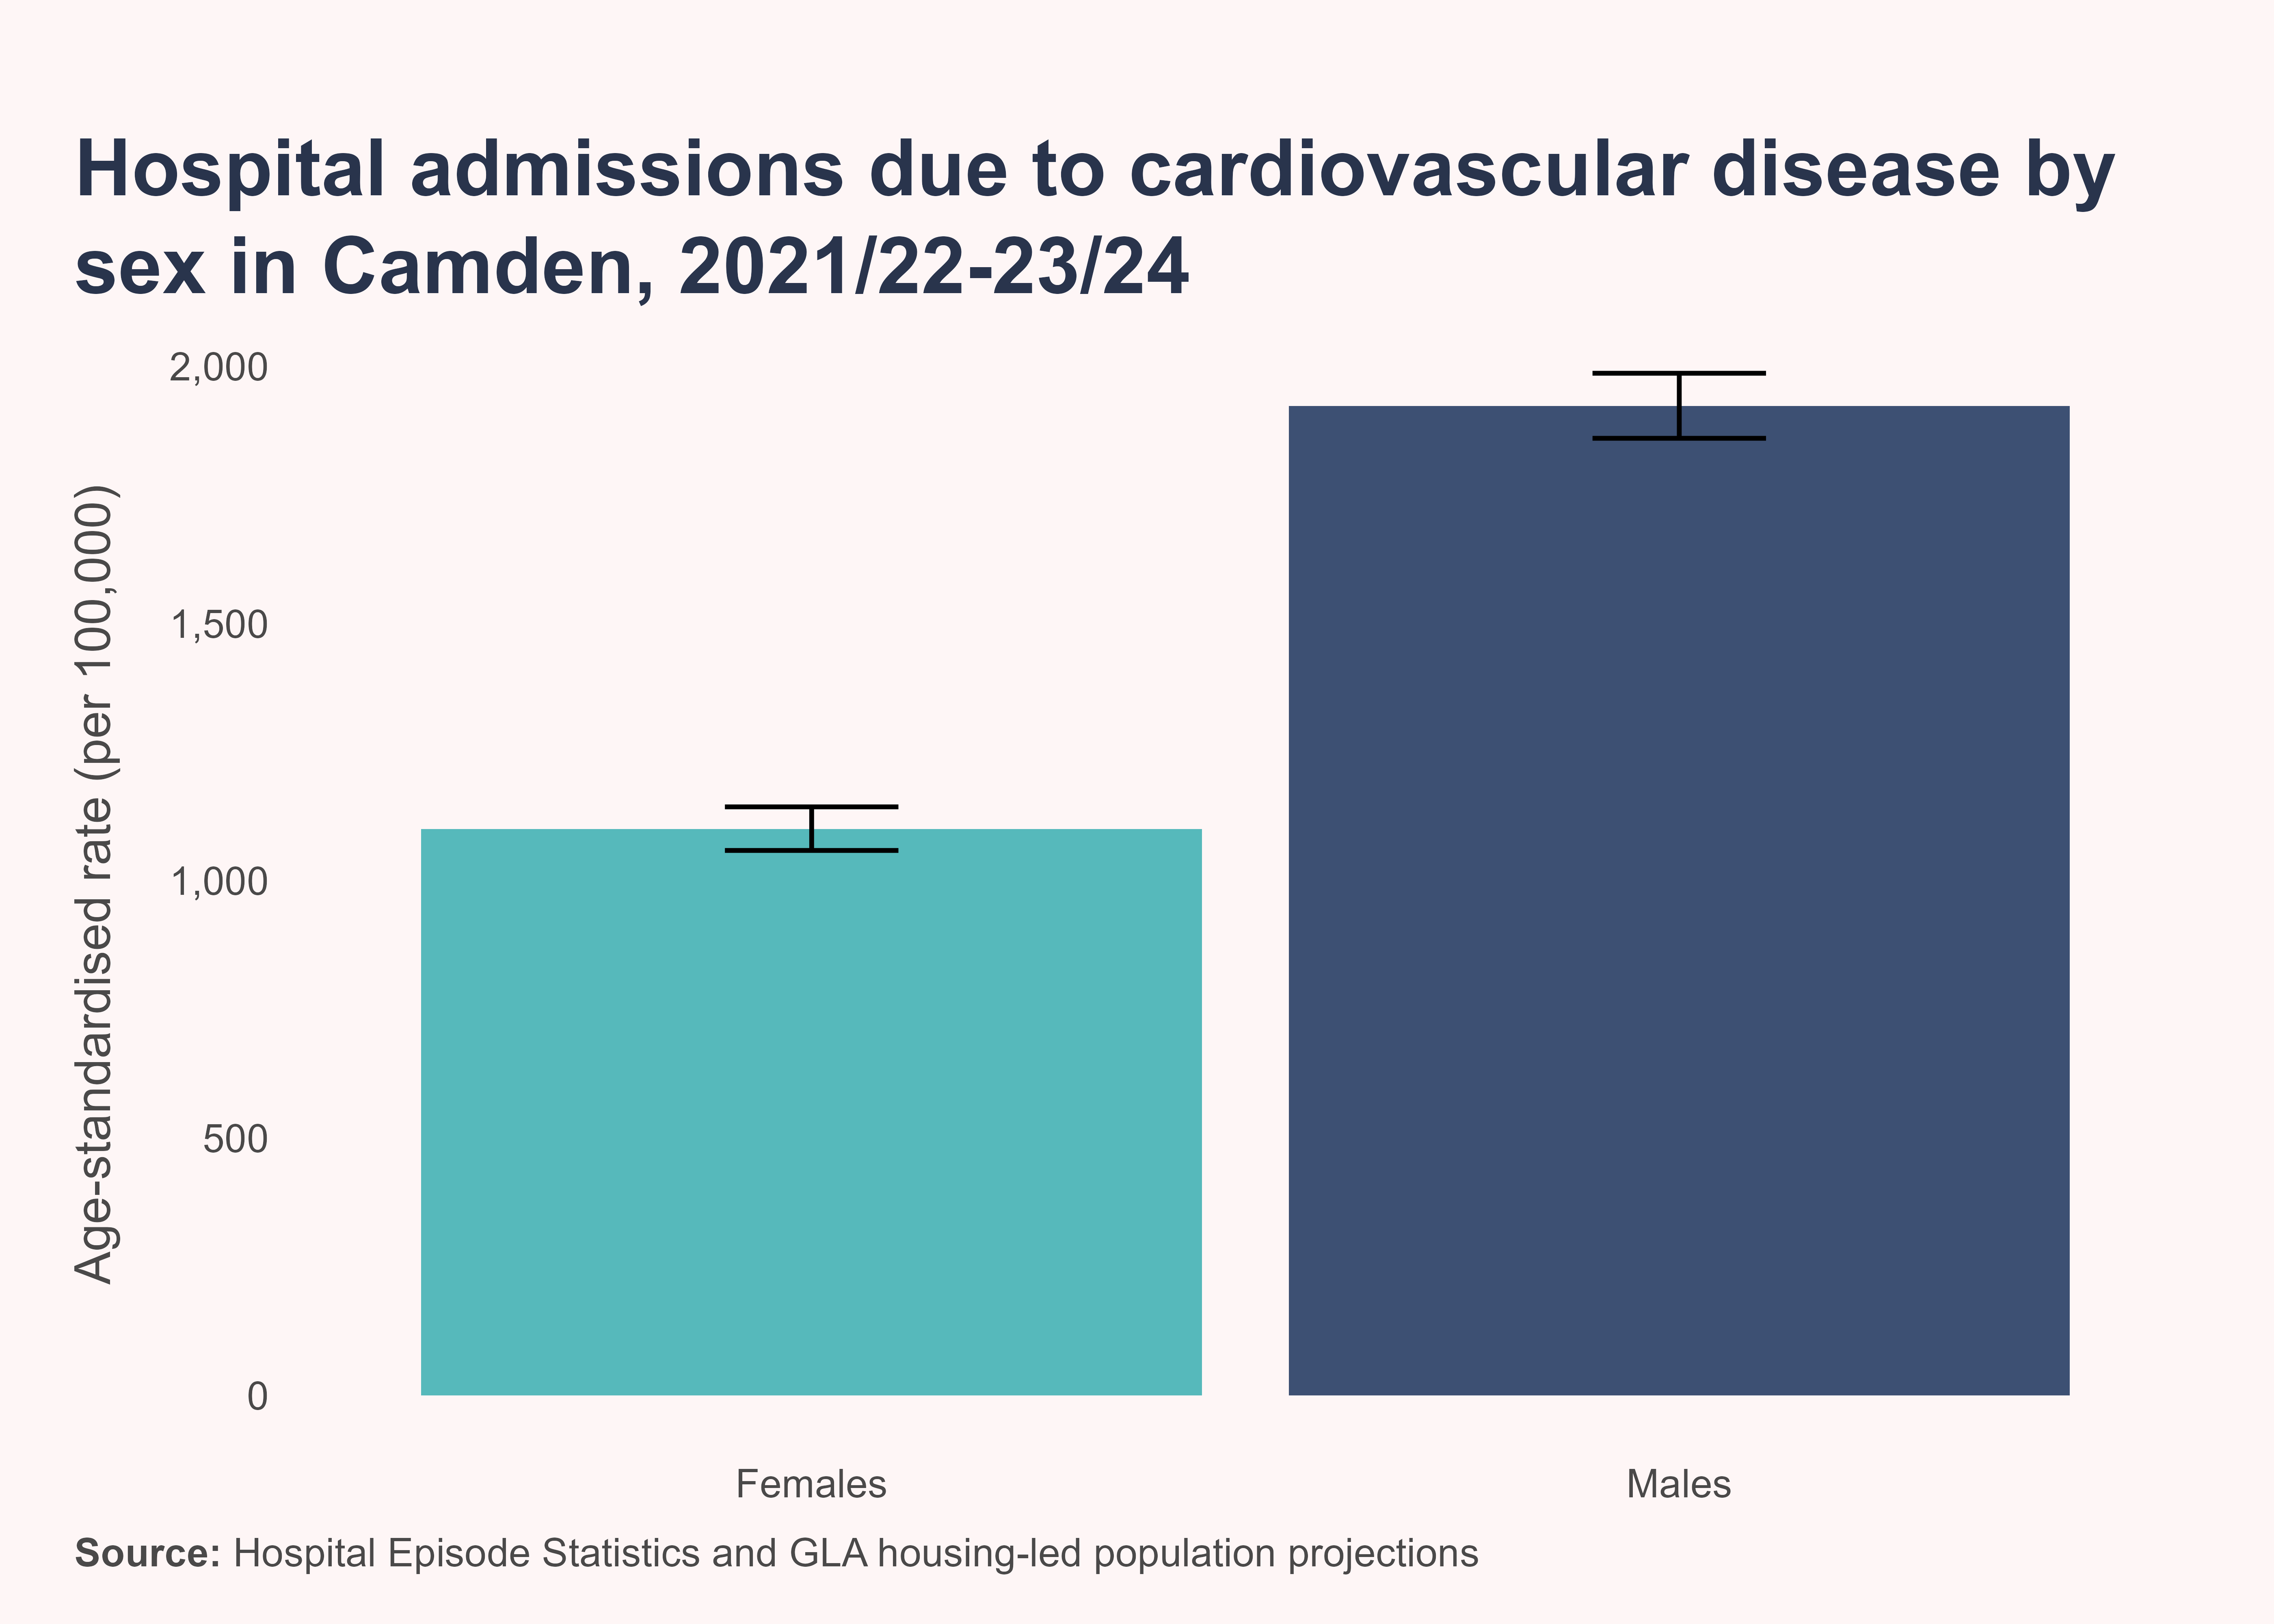
Males have a significantly higher rate of admissions due to cardiovascular disease than females.
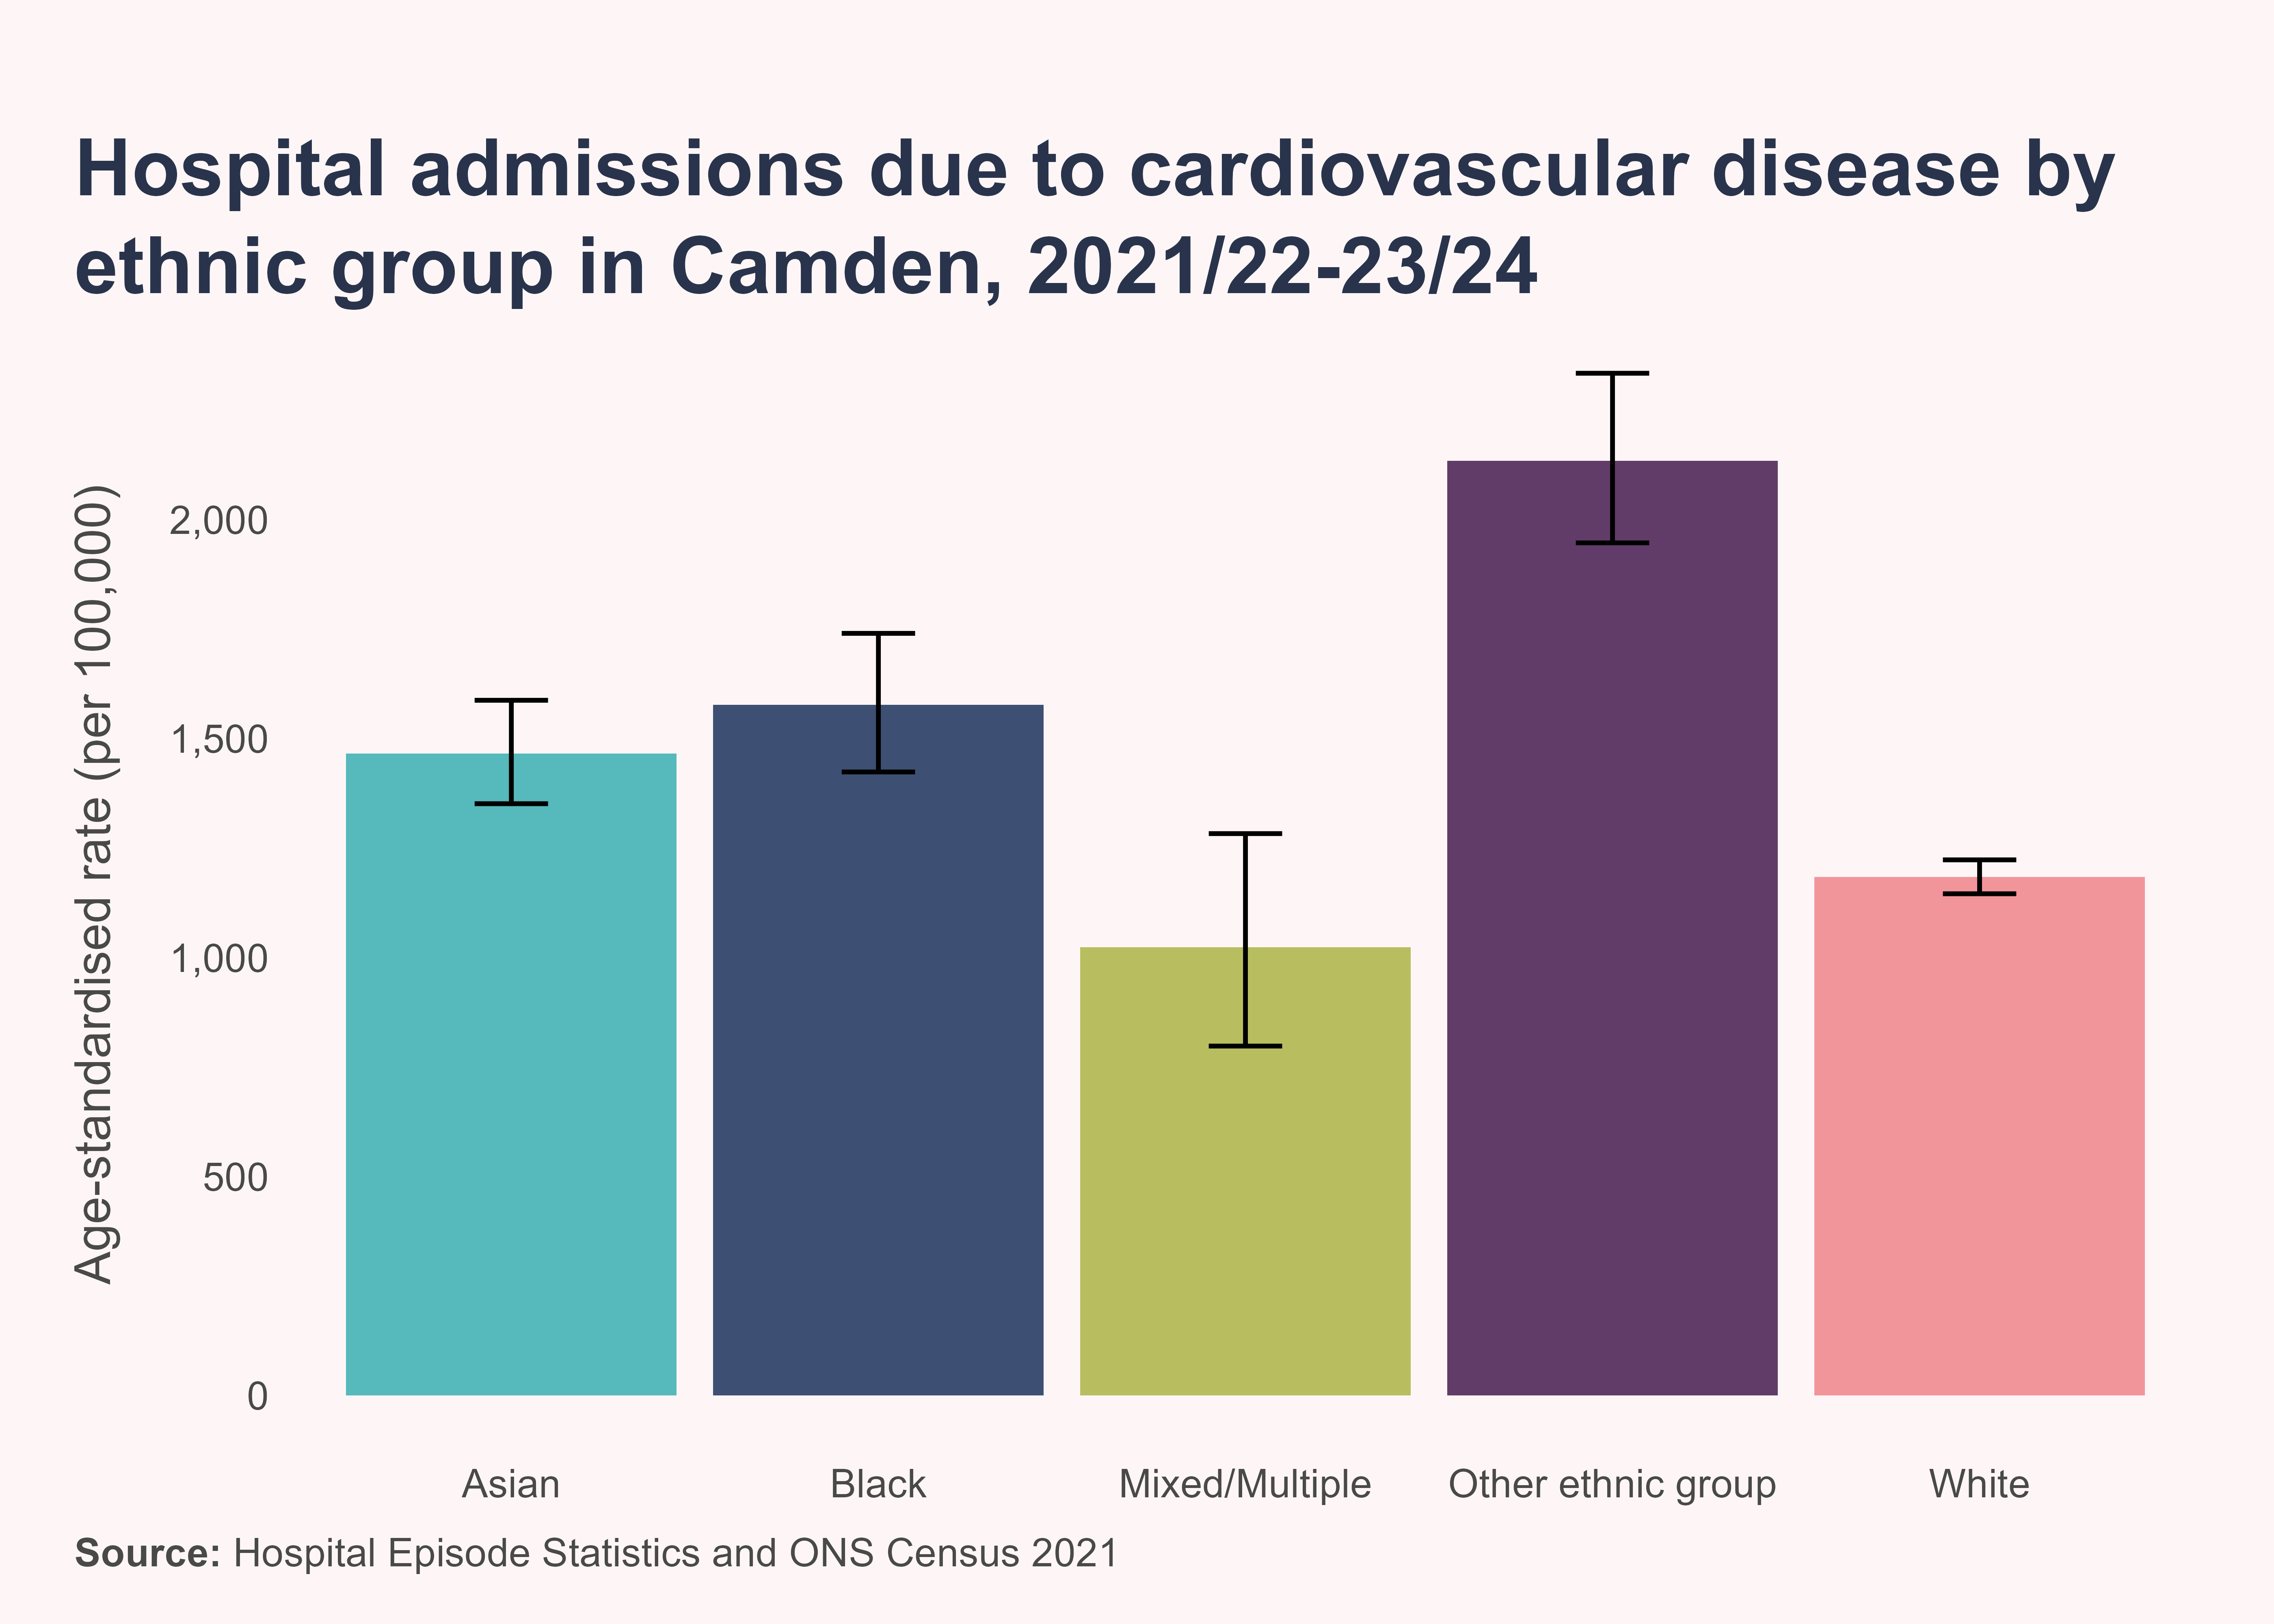
The Asian, Black and Other ethnic groups have a significantly higher rate of admissions from cardiovascular disease than the White ethnic group.
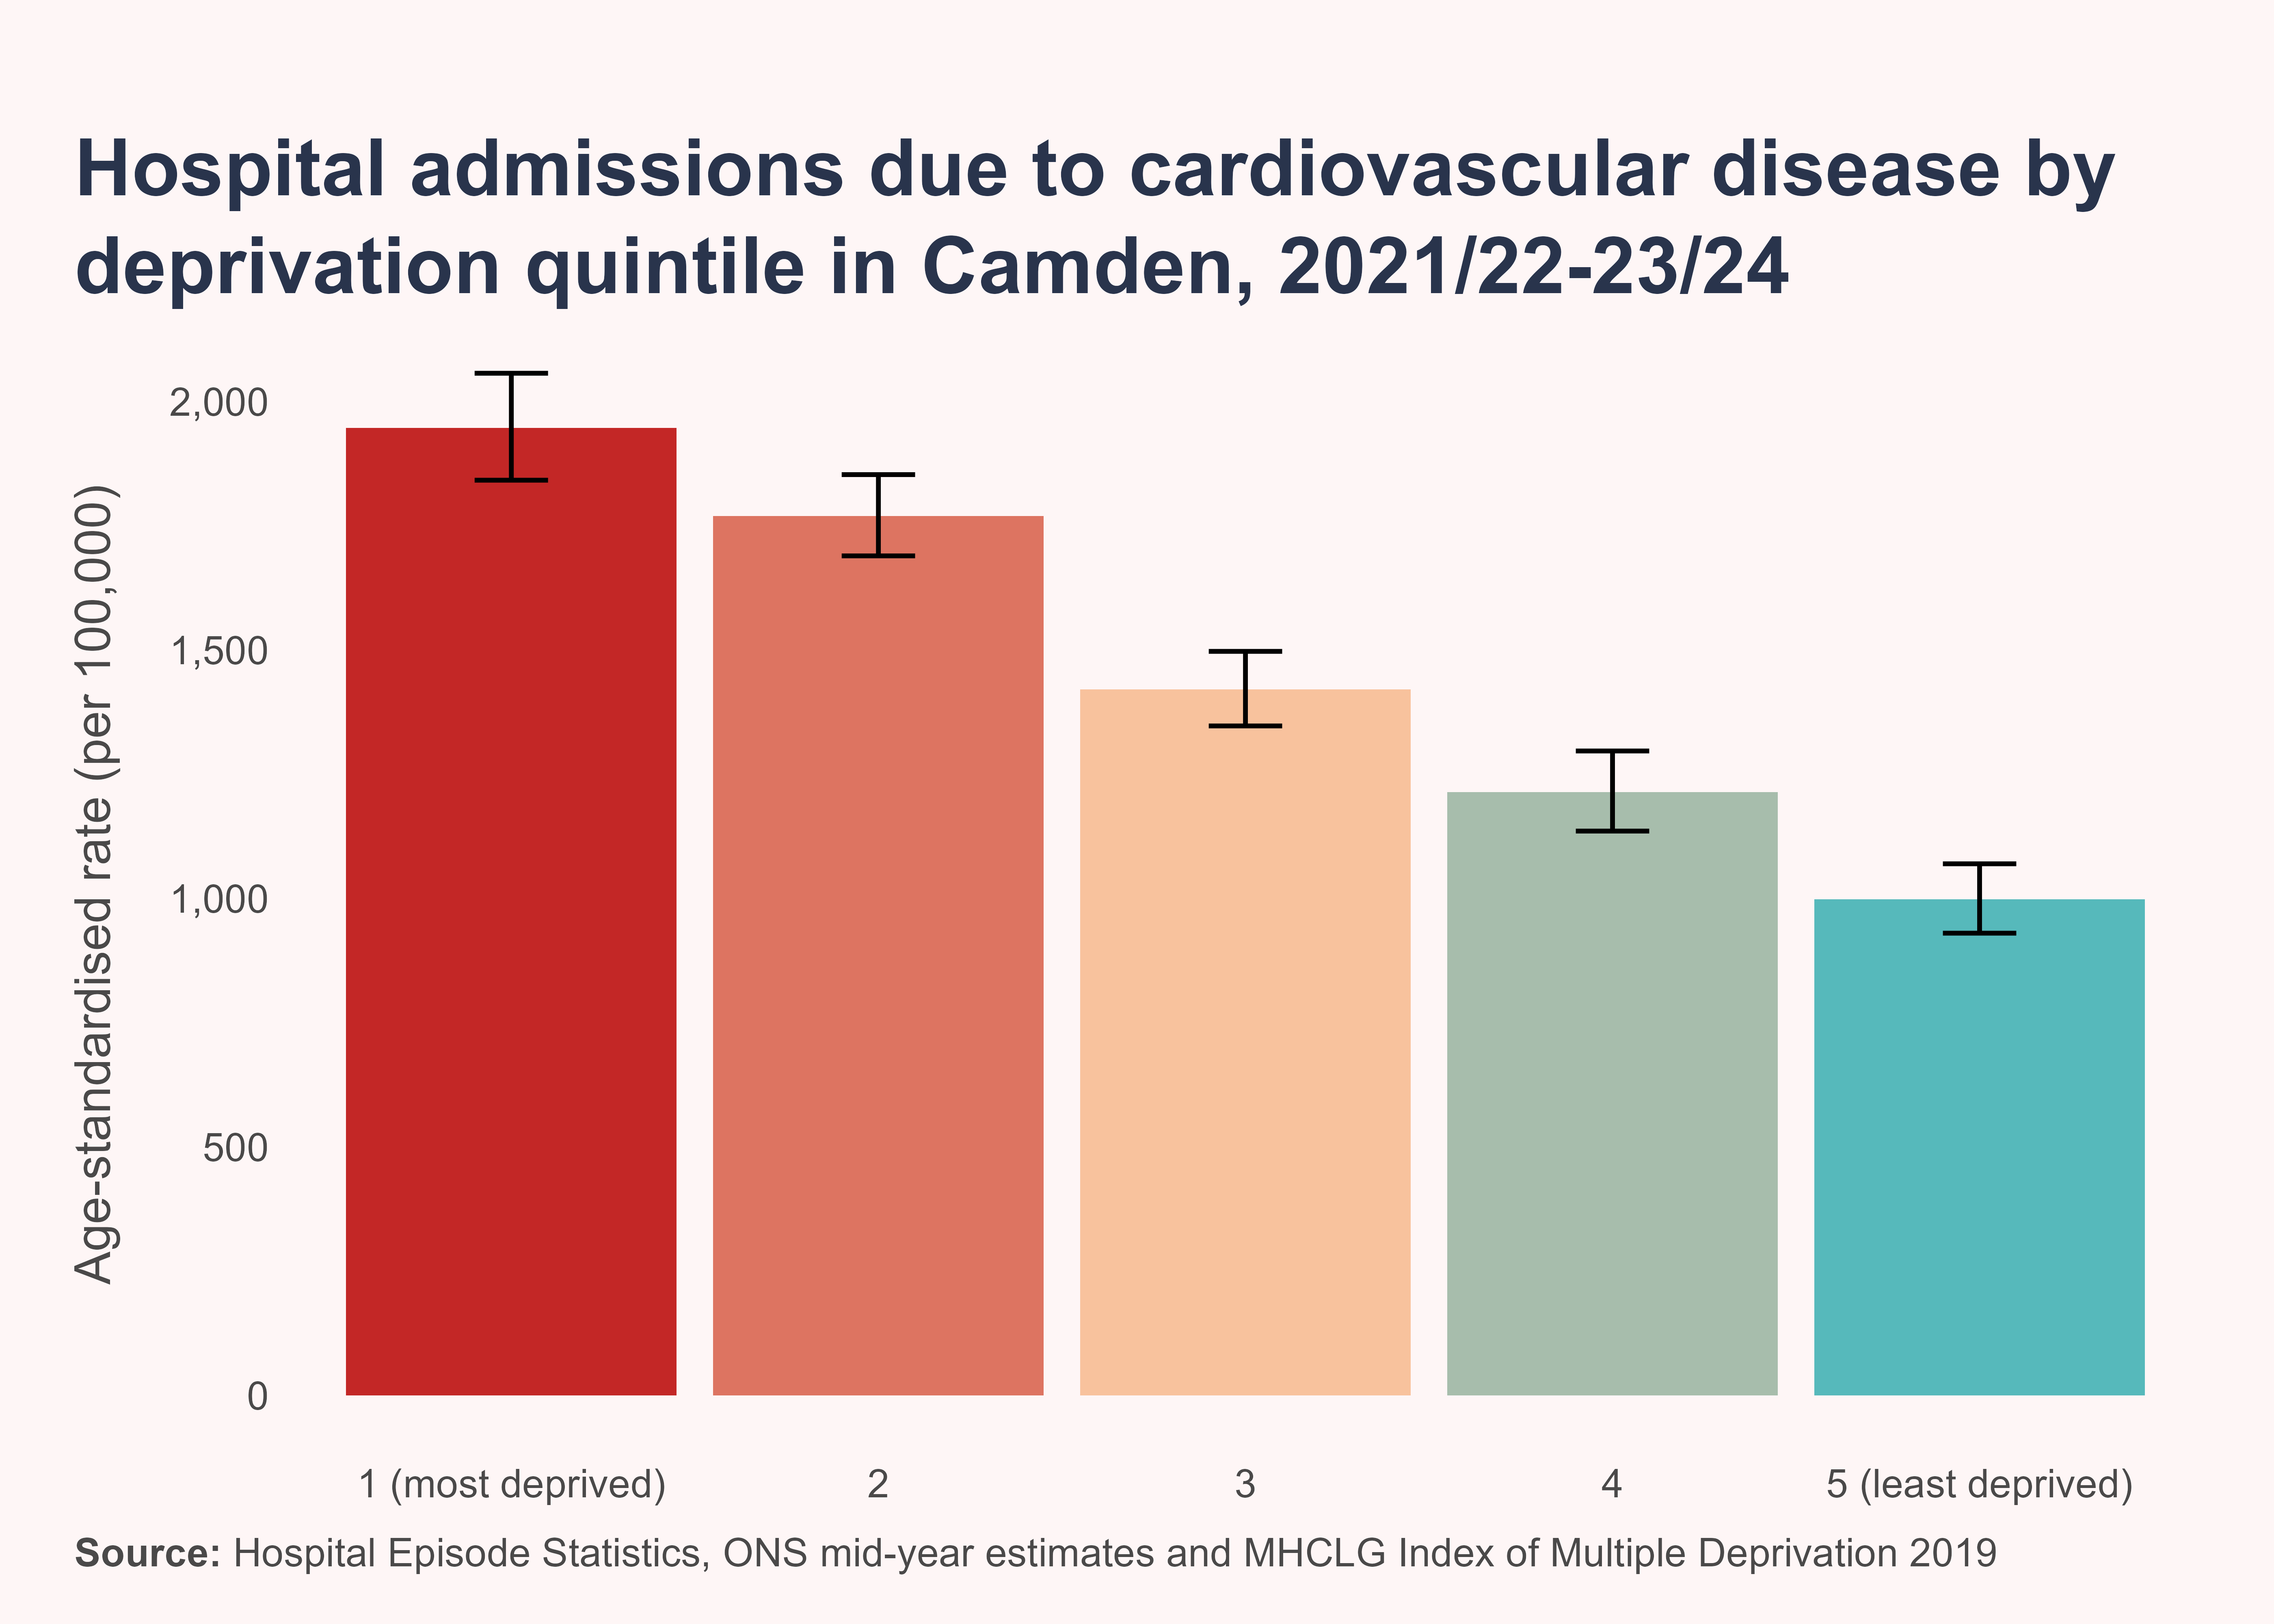
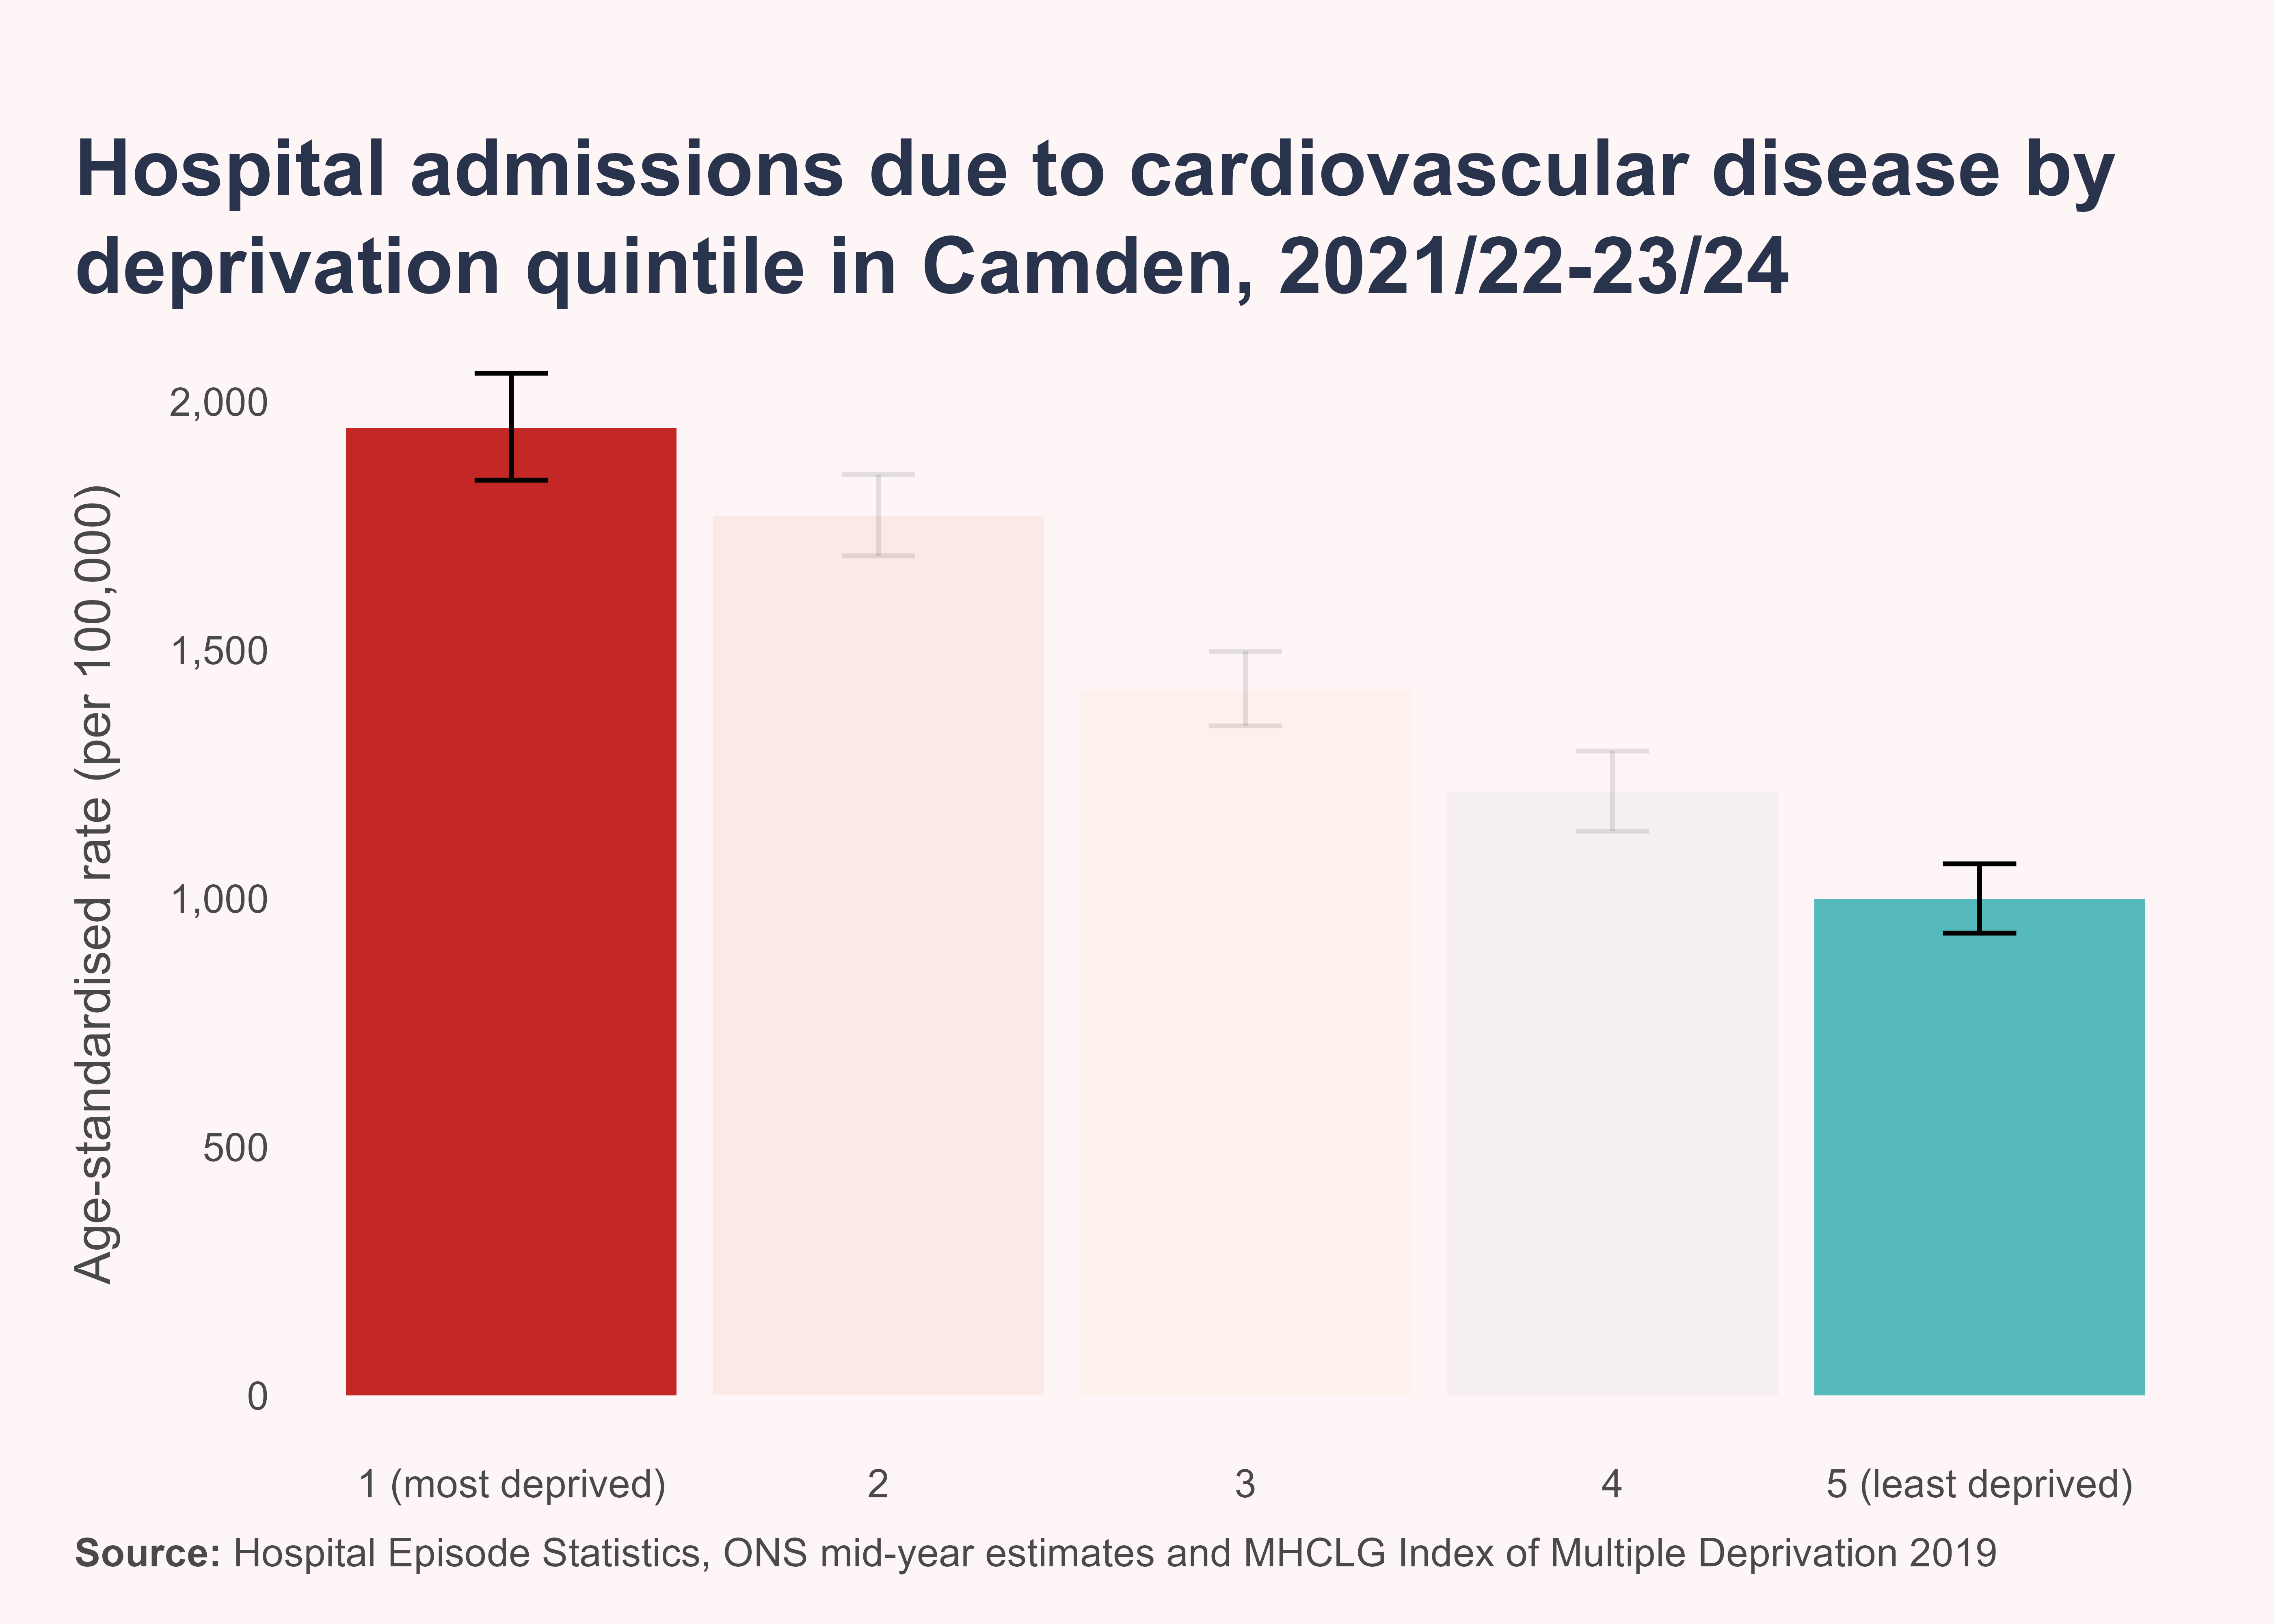
There is a strong social gradient in the rate of hospital admissions from cardiovascular disease, with higher rates in more deprived areas.
Those living in the most deprived areas have an admissions rate which is two times higher than those in the least deprived areas.
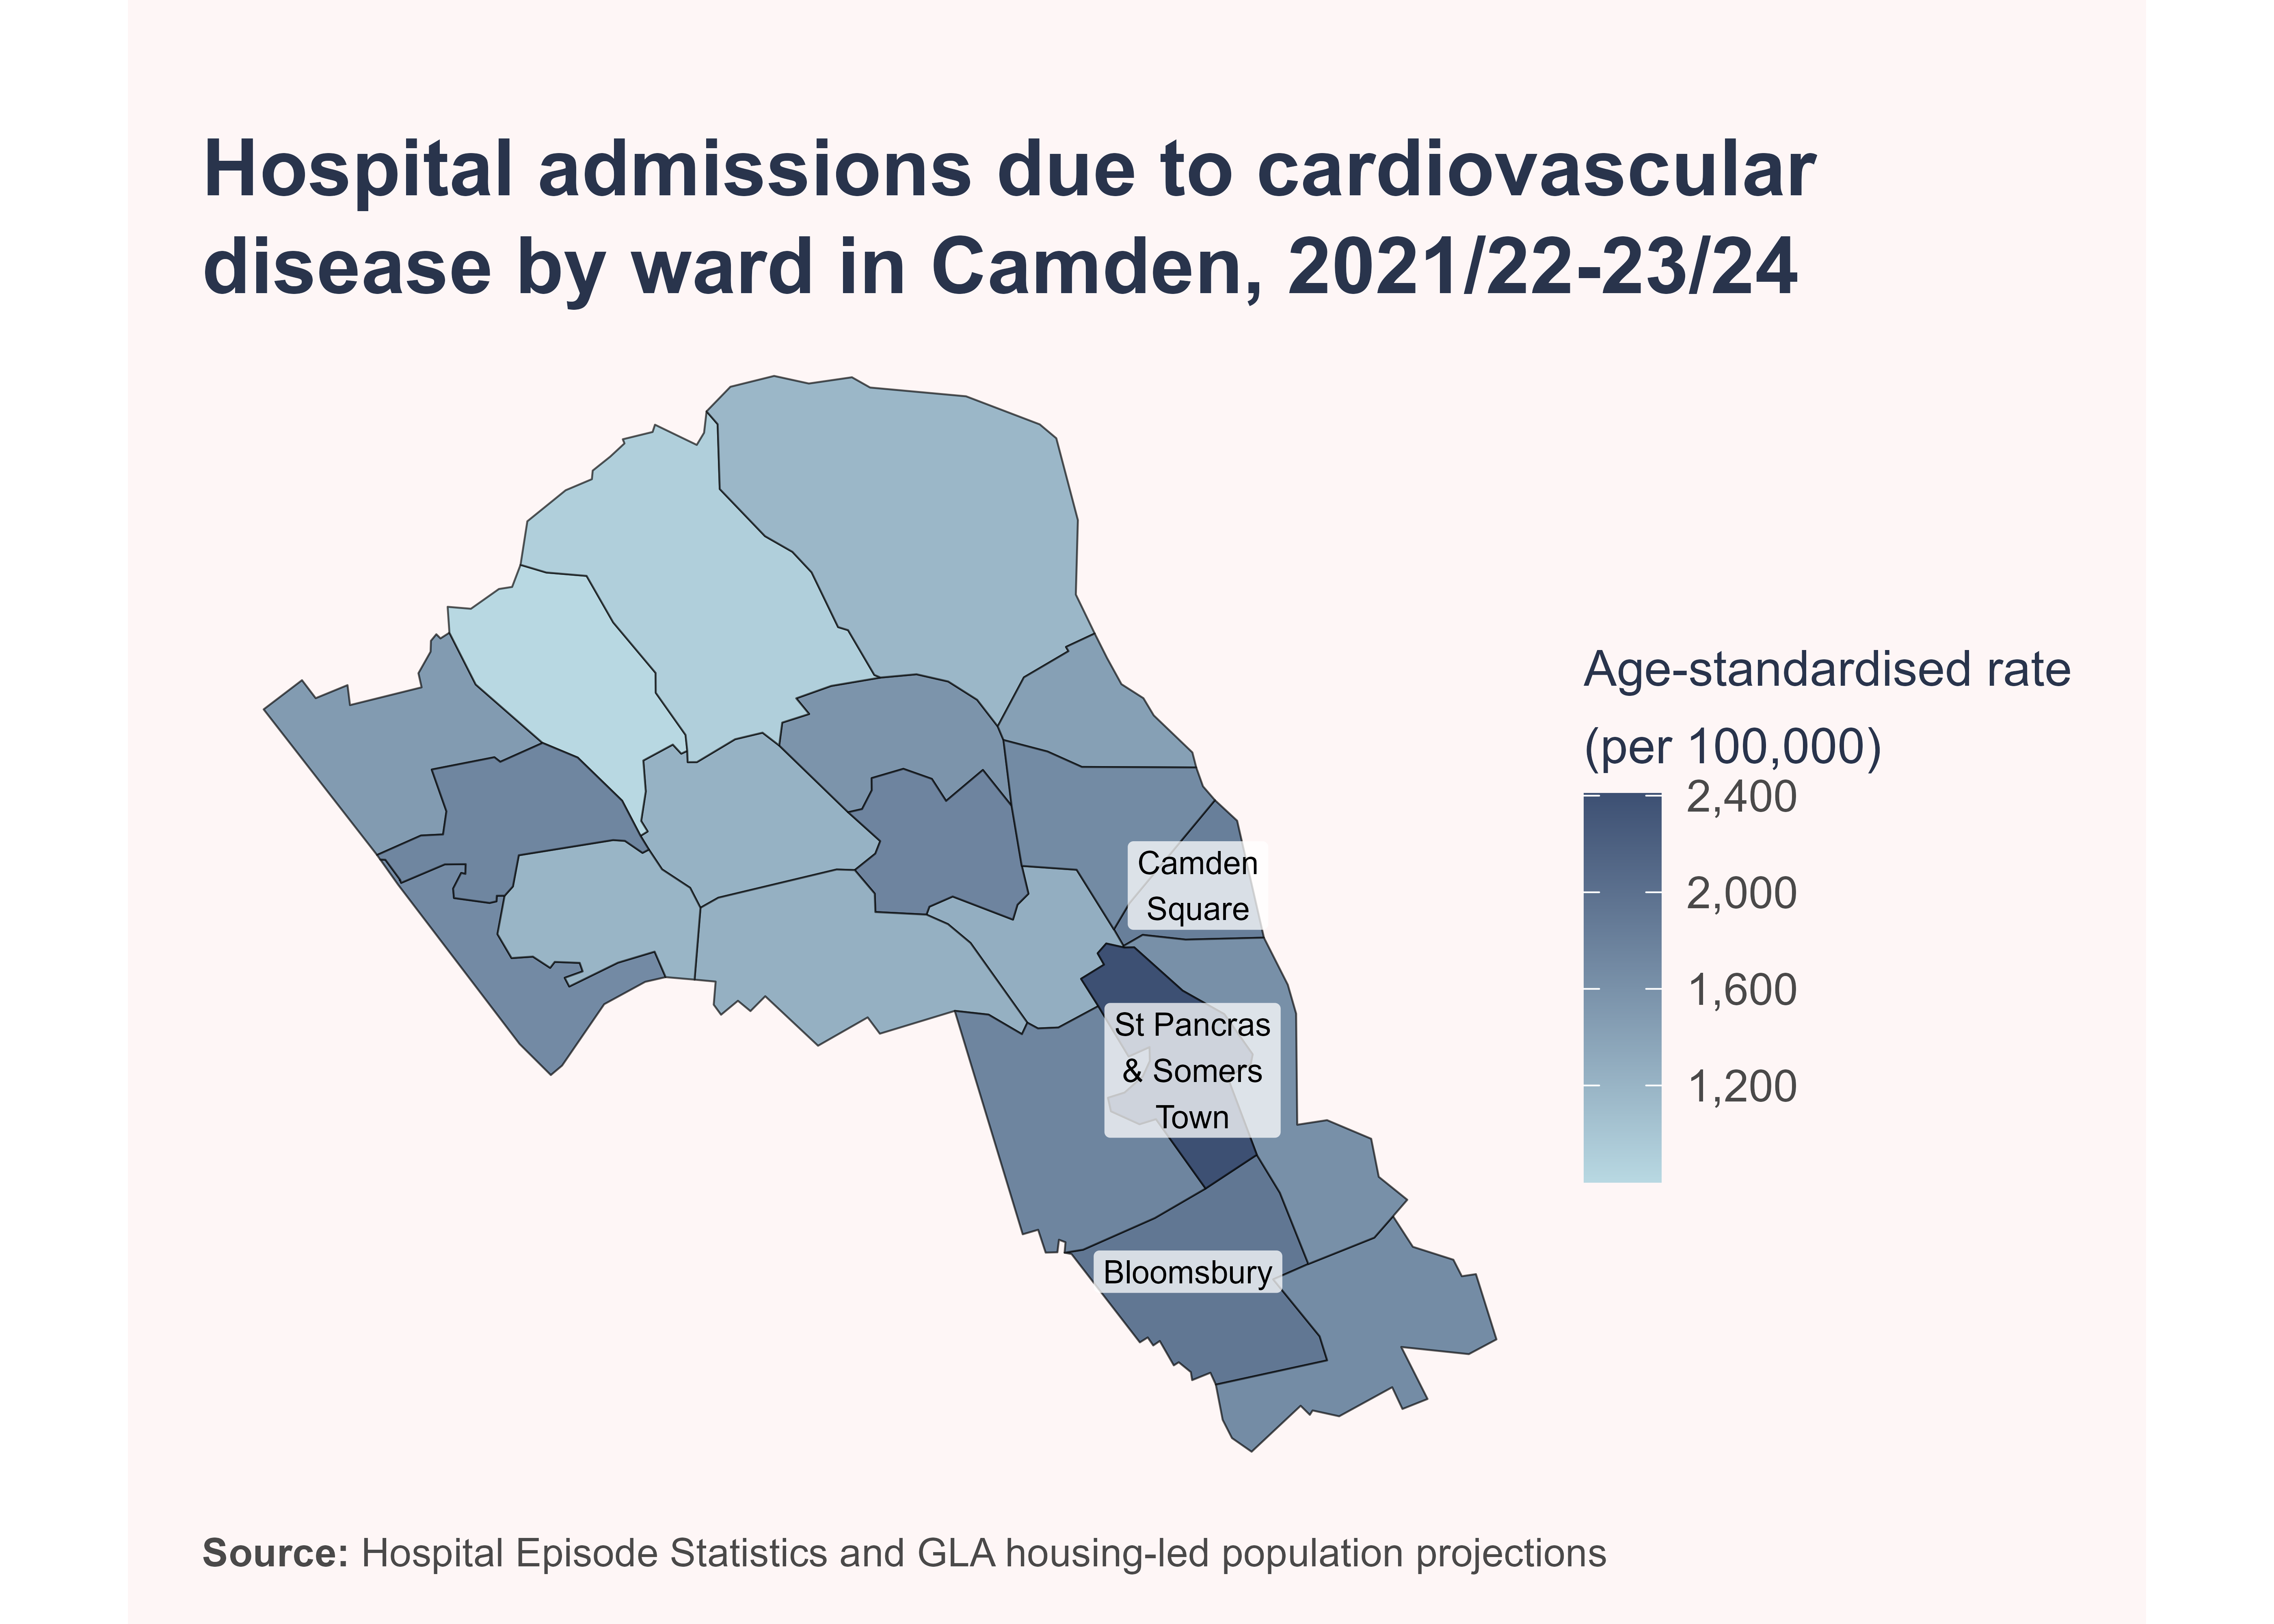
There are also large differences in the rate of hospital admissions for cardiovascular disease by ward. The highest rates are seen in St Pancras & Somers Town, Bloomsbury and Camden Square.
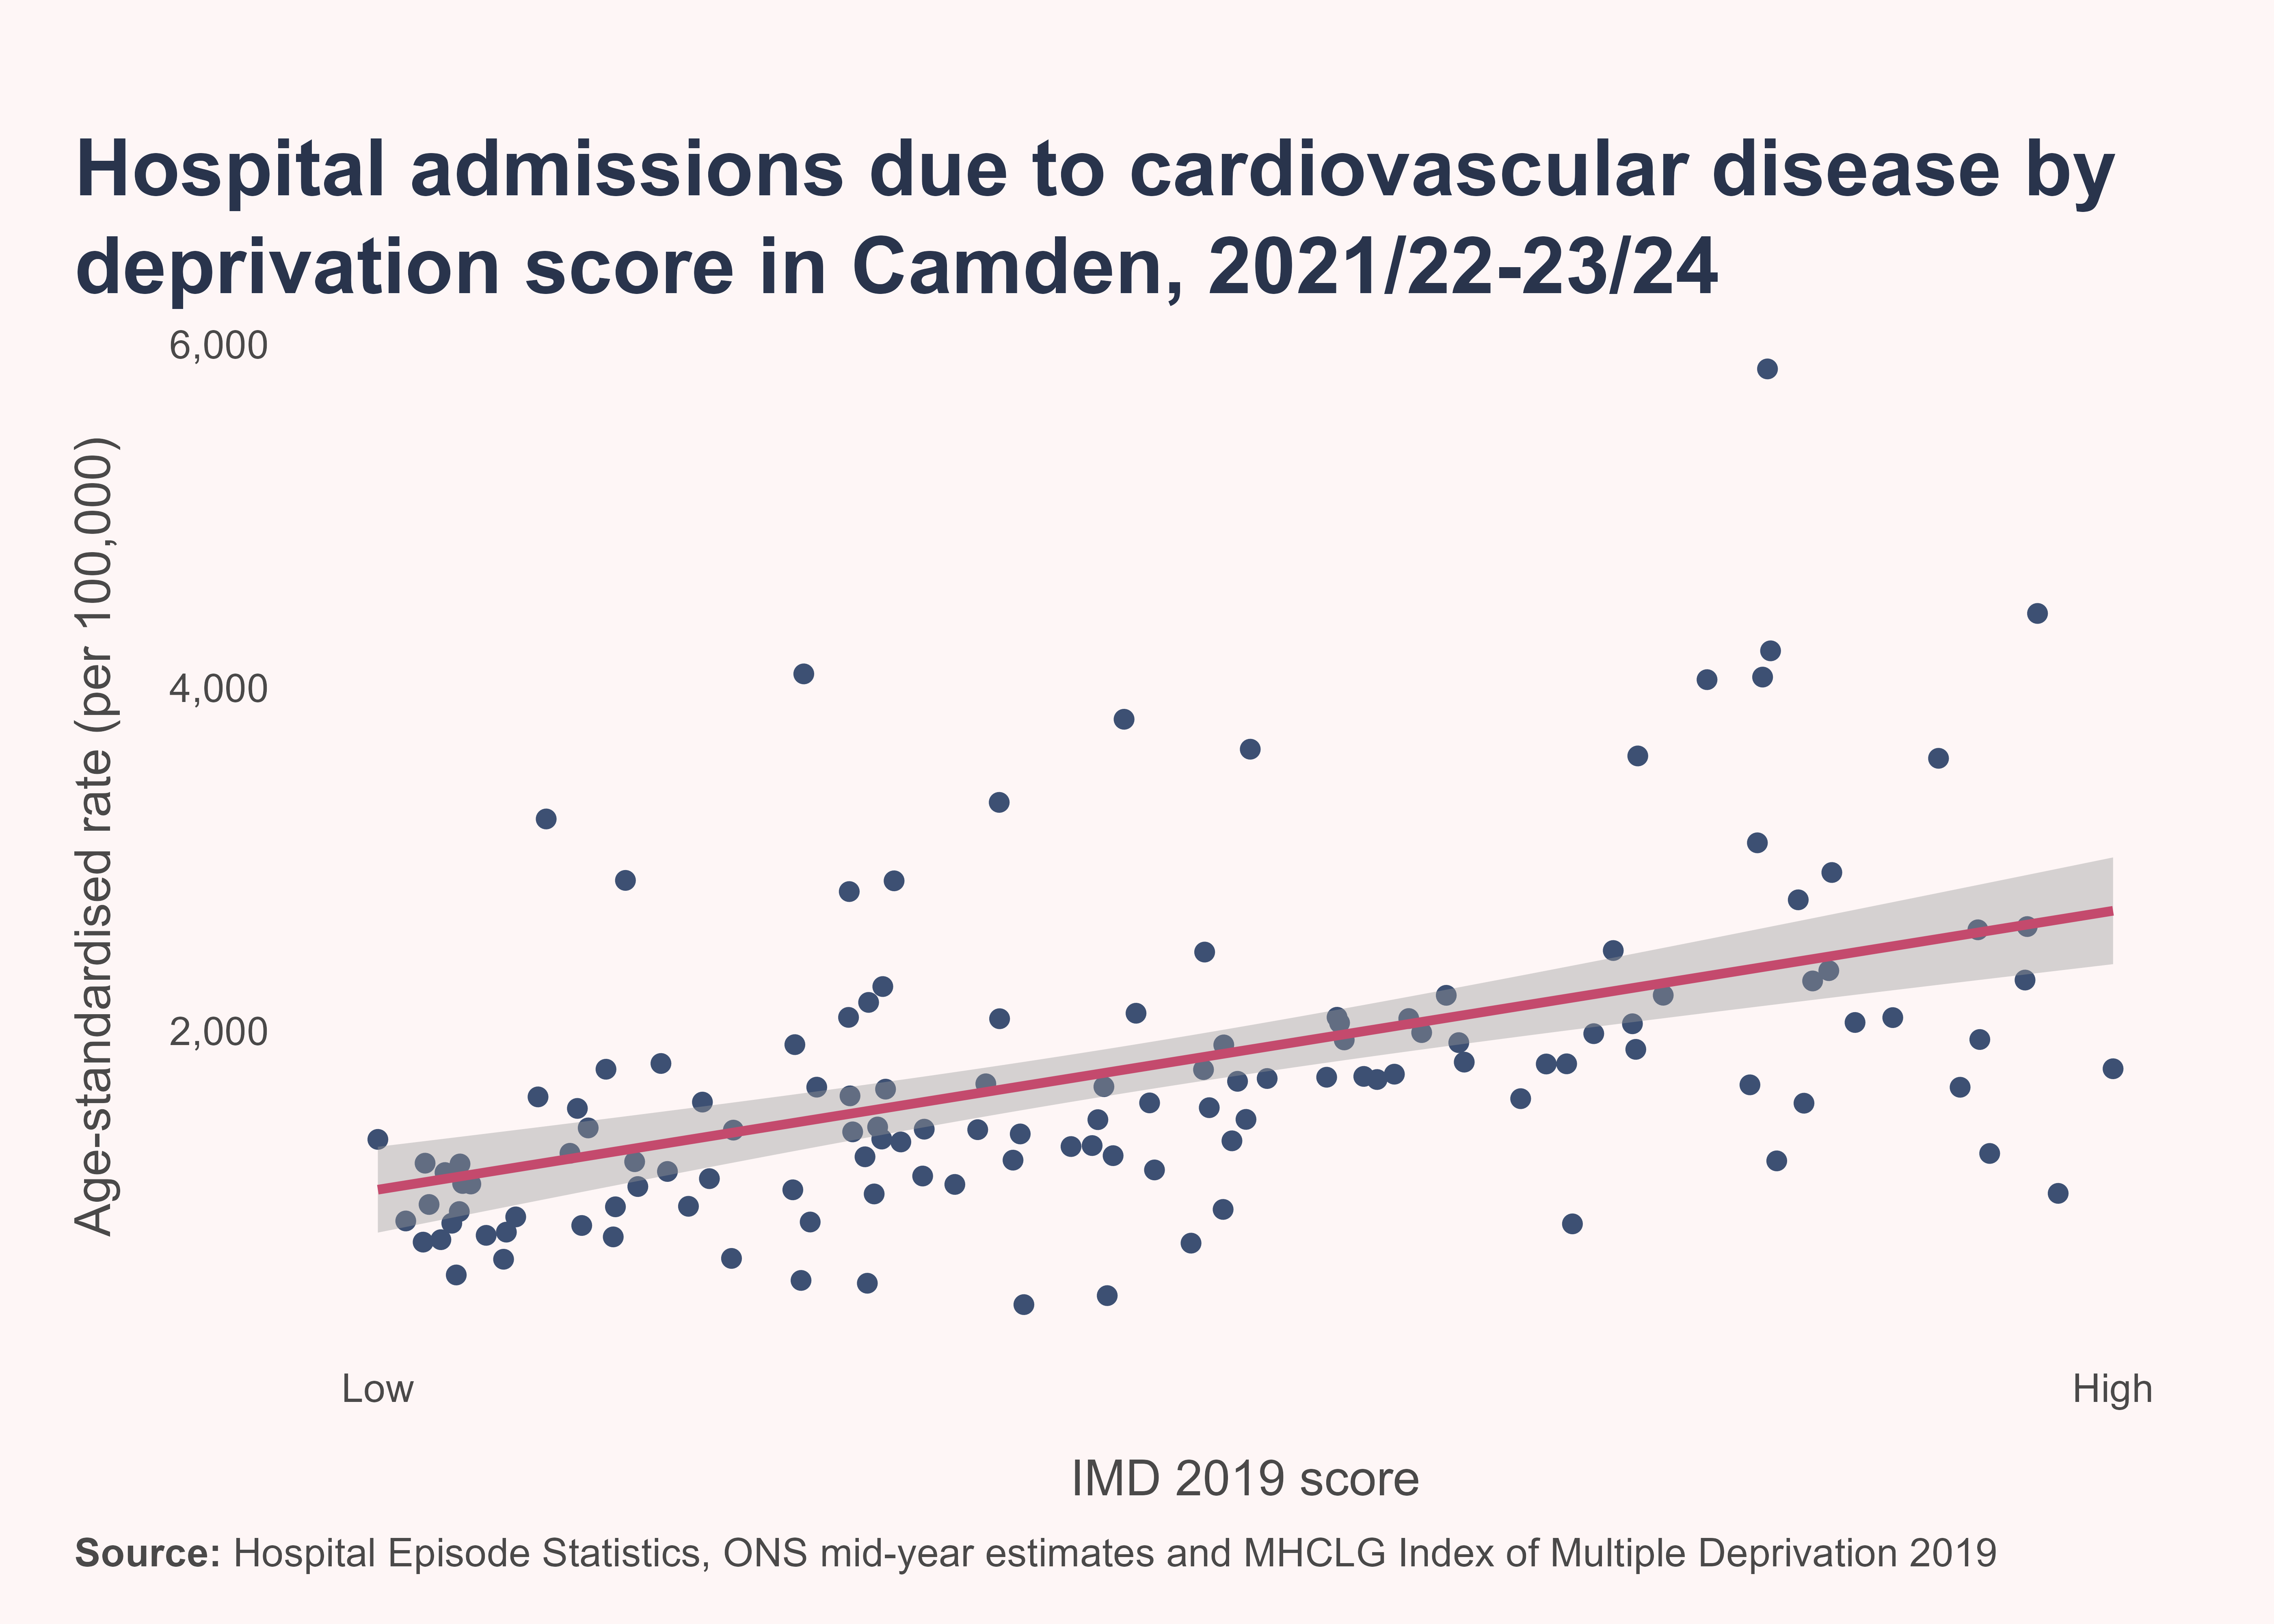
There is a significant positive association between deprivation score and the rate of hospital admissions for cardiovascular disease. Therefore, the geographical variation in hospital admissions is likely to be partly related to differences in levels of deprivation between areas.
Deprivation-based inequalities in CHD progression and pathways
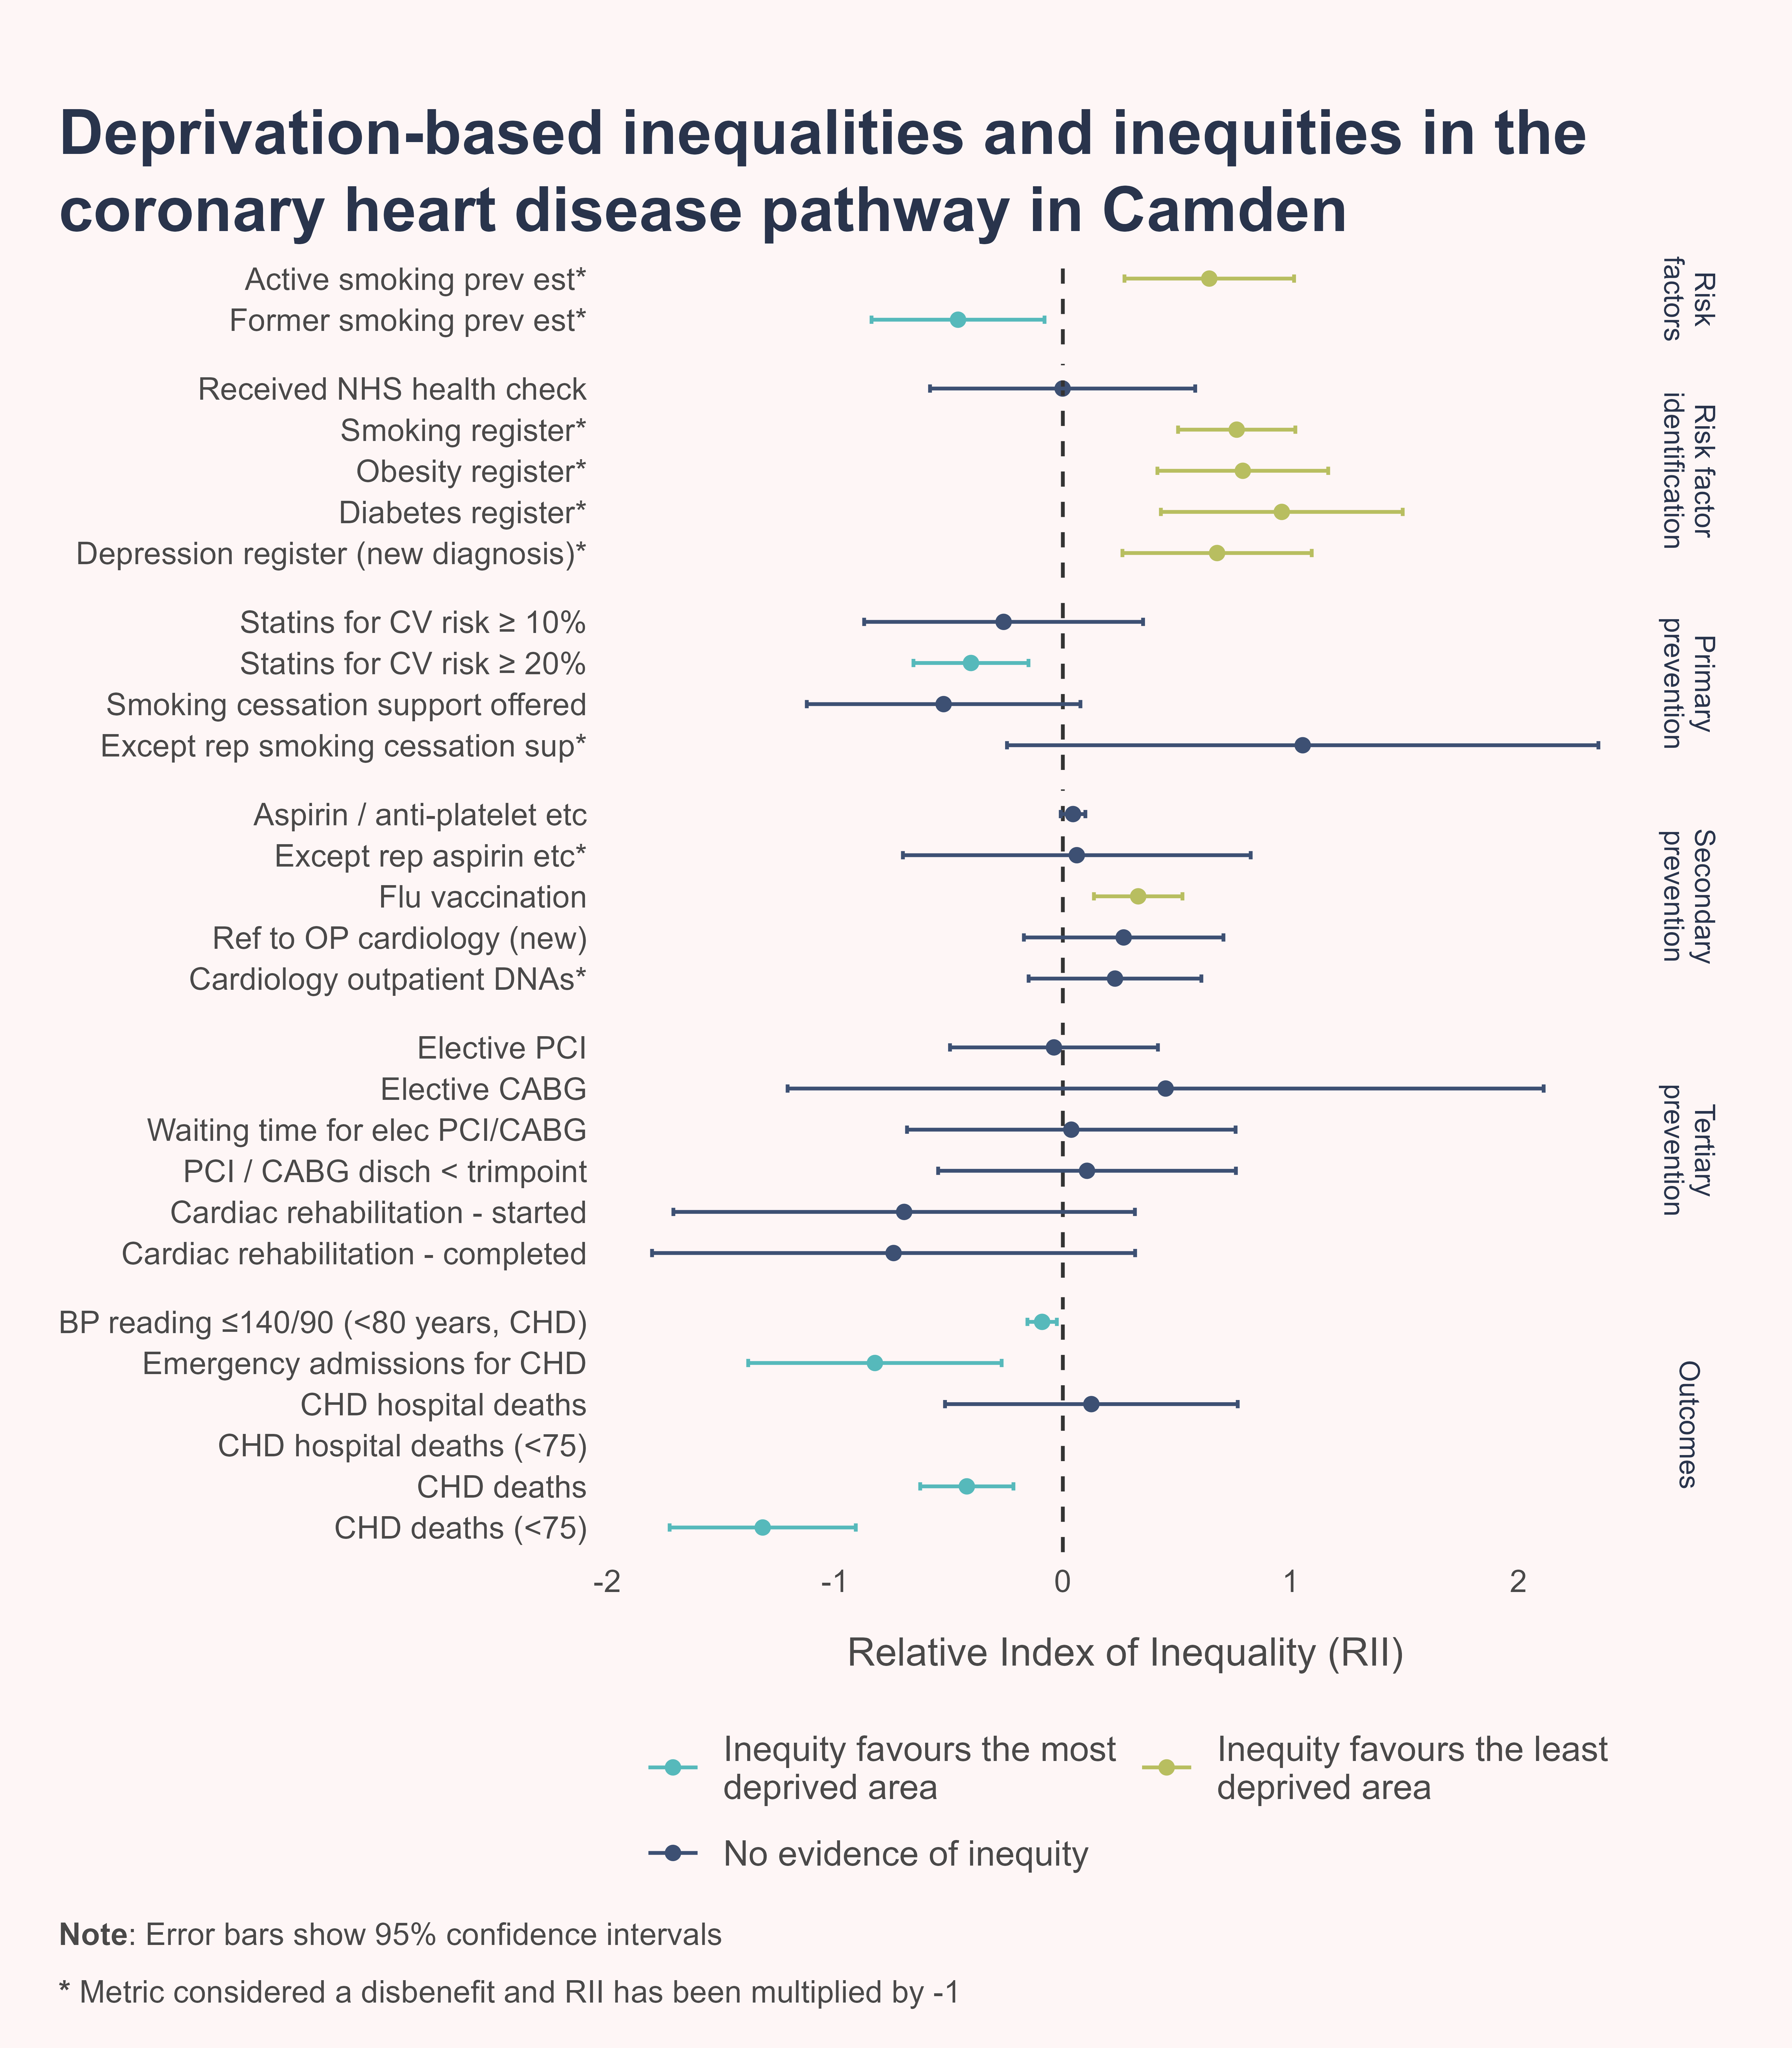
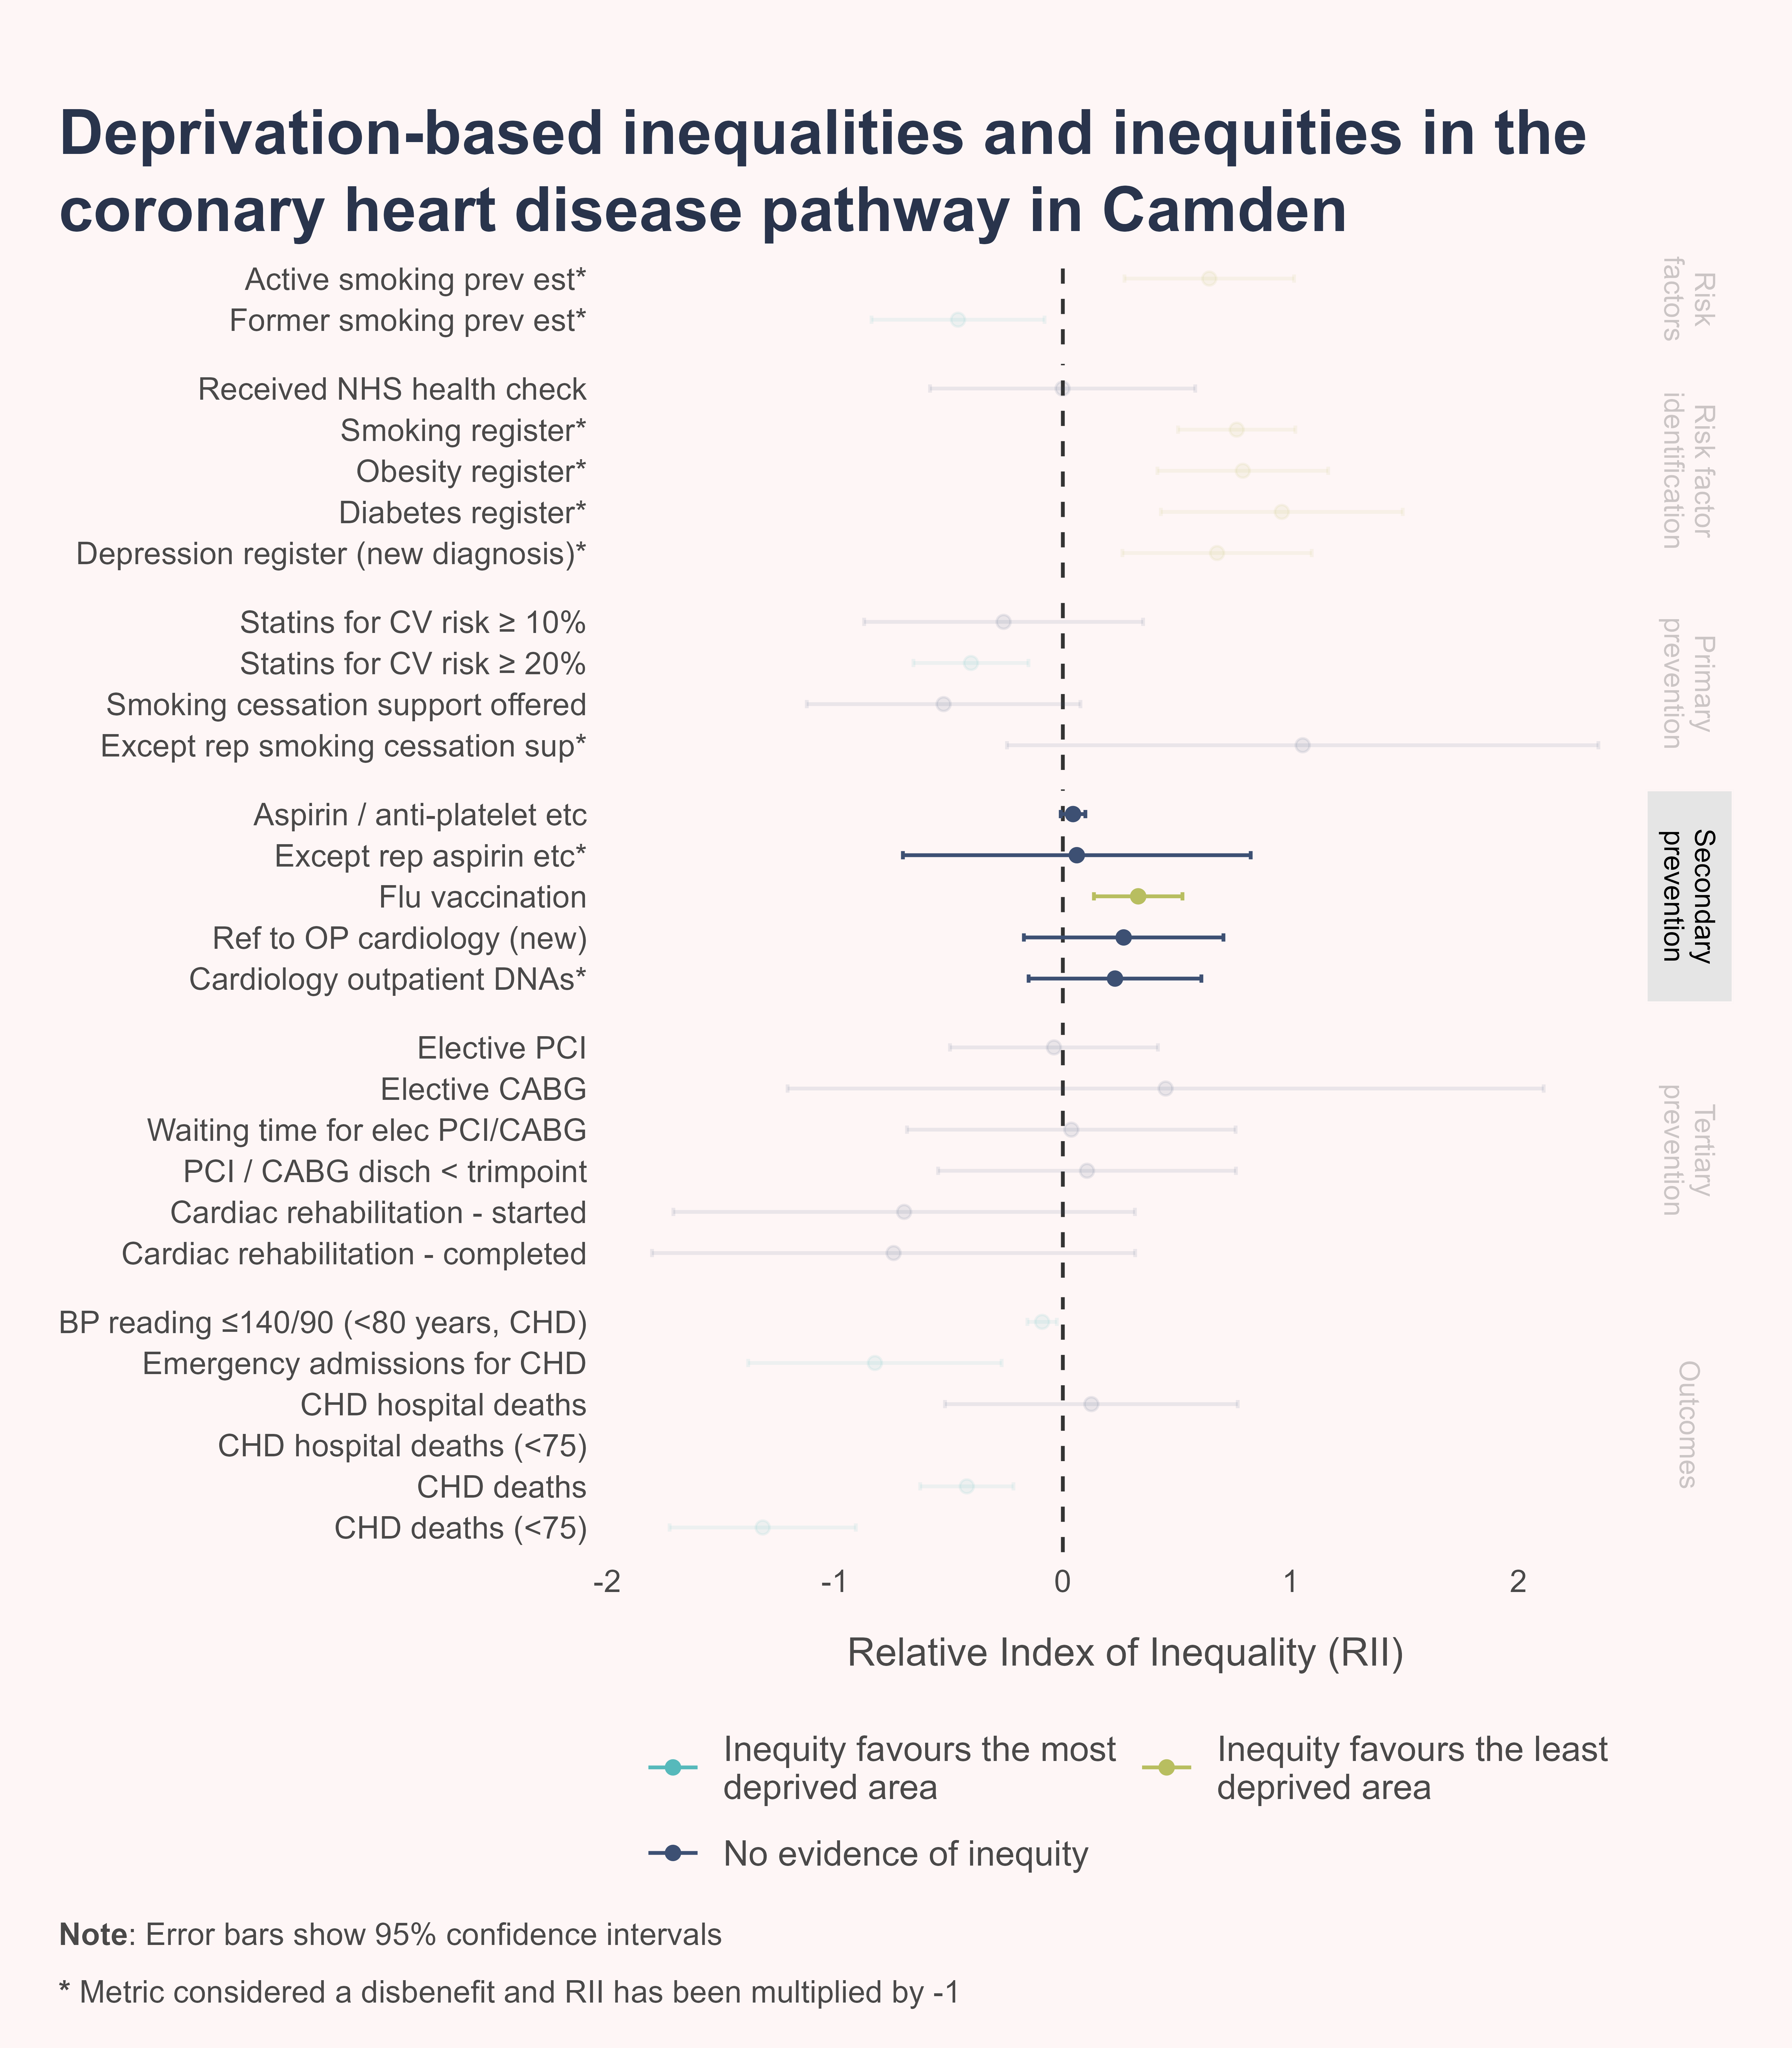
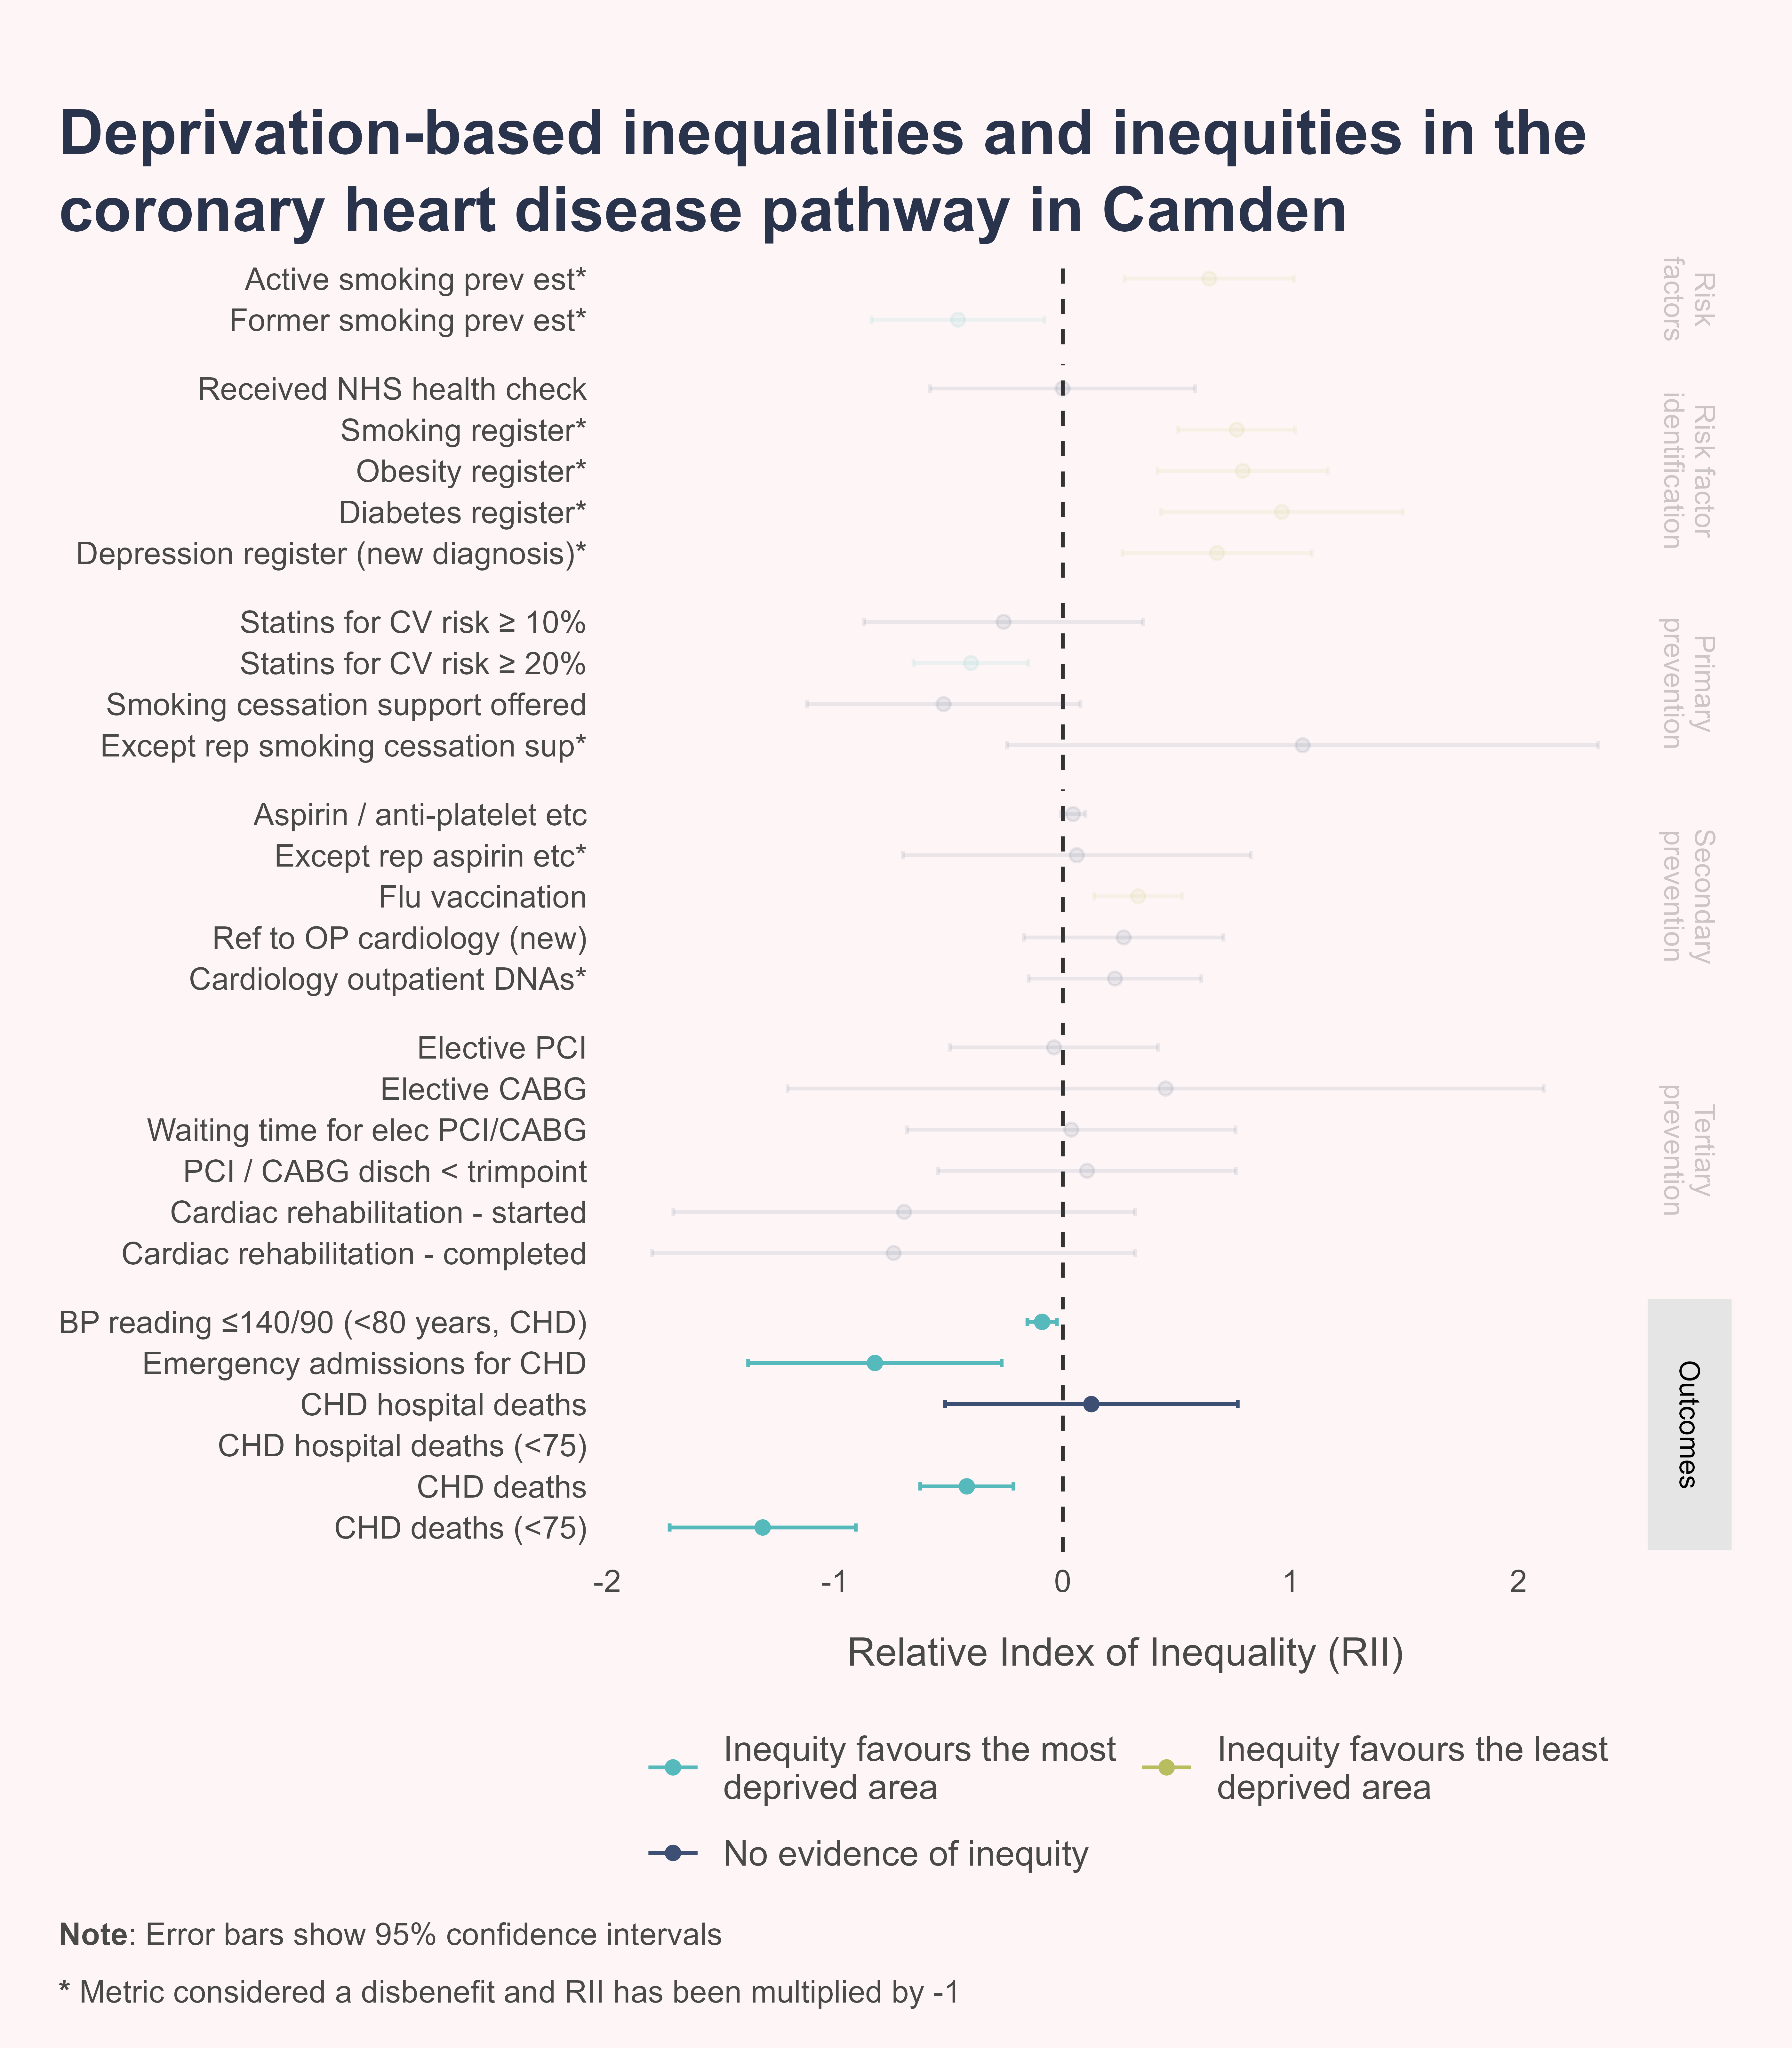
There are considerable inequalities and inequities along the CHD pathway in Camden.
Callout-riiInterpreting the relative index of inequality (RII)
The relative index of inequality (RII) quantifies and illustrates the level of inequity (where the denominator is a measure of need) or inequality (where the denominator is the population size). It represents the inequality gap across the whole population between the most and the least areas and allows for comparison of inequity across different measures.
The sign of the RII indicates the direction of the inequity: a negative RII indicates greater benefit to the most deprived areas, whereas a positive RII indicates greater benefit to the least deprived groups. The absolute value of the RII indicates the size of the inequity (i.e., a metric with an RII of -0.6 demonstrates greater inequity than a metric with an RII of -0.2).
Error bars represent 95% confidence intervals, which means that 95% of the time we are confident that the true value lies within that interval. When confidence intervals overlap with zero, there is no evidence of inequity or inequality for that metric (i.e., no statistically significant difference between the most and least deprived groups).

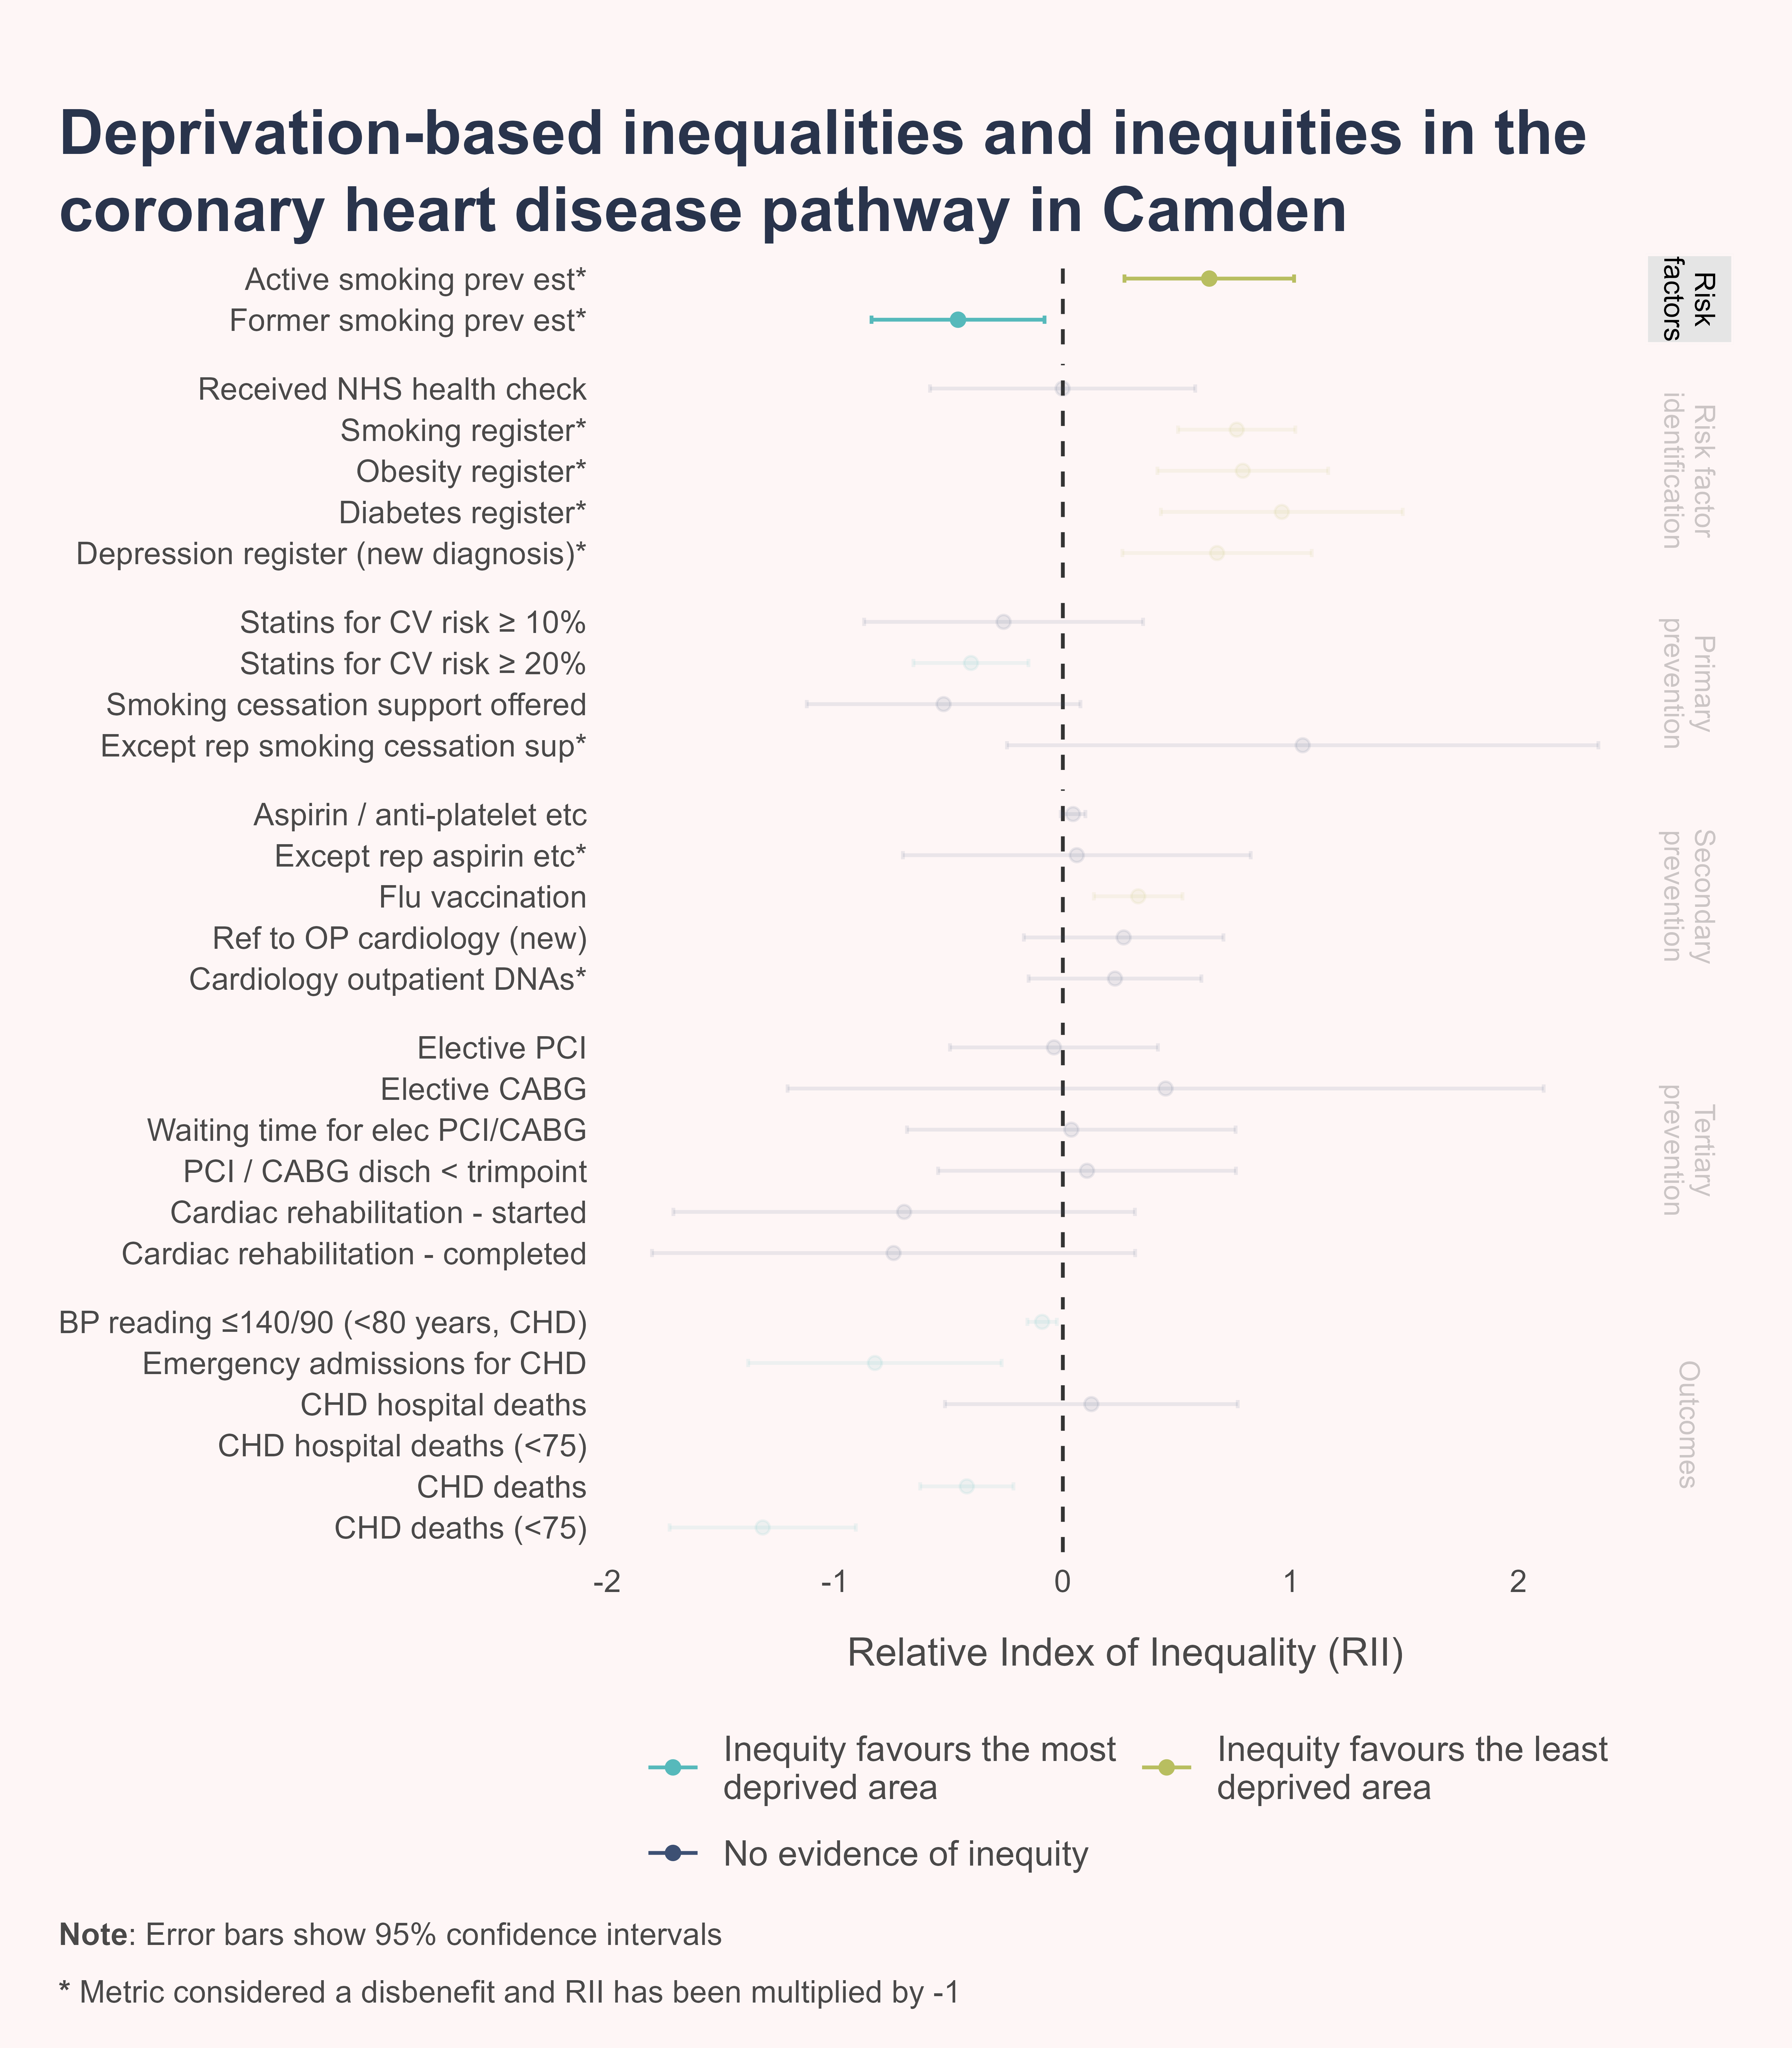
Patients in the least deprived areas are less likely to be current smokers, while those in the most deprived areas are less likely to have smoked previously.
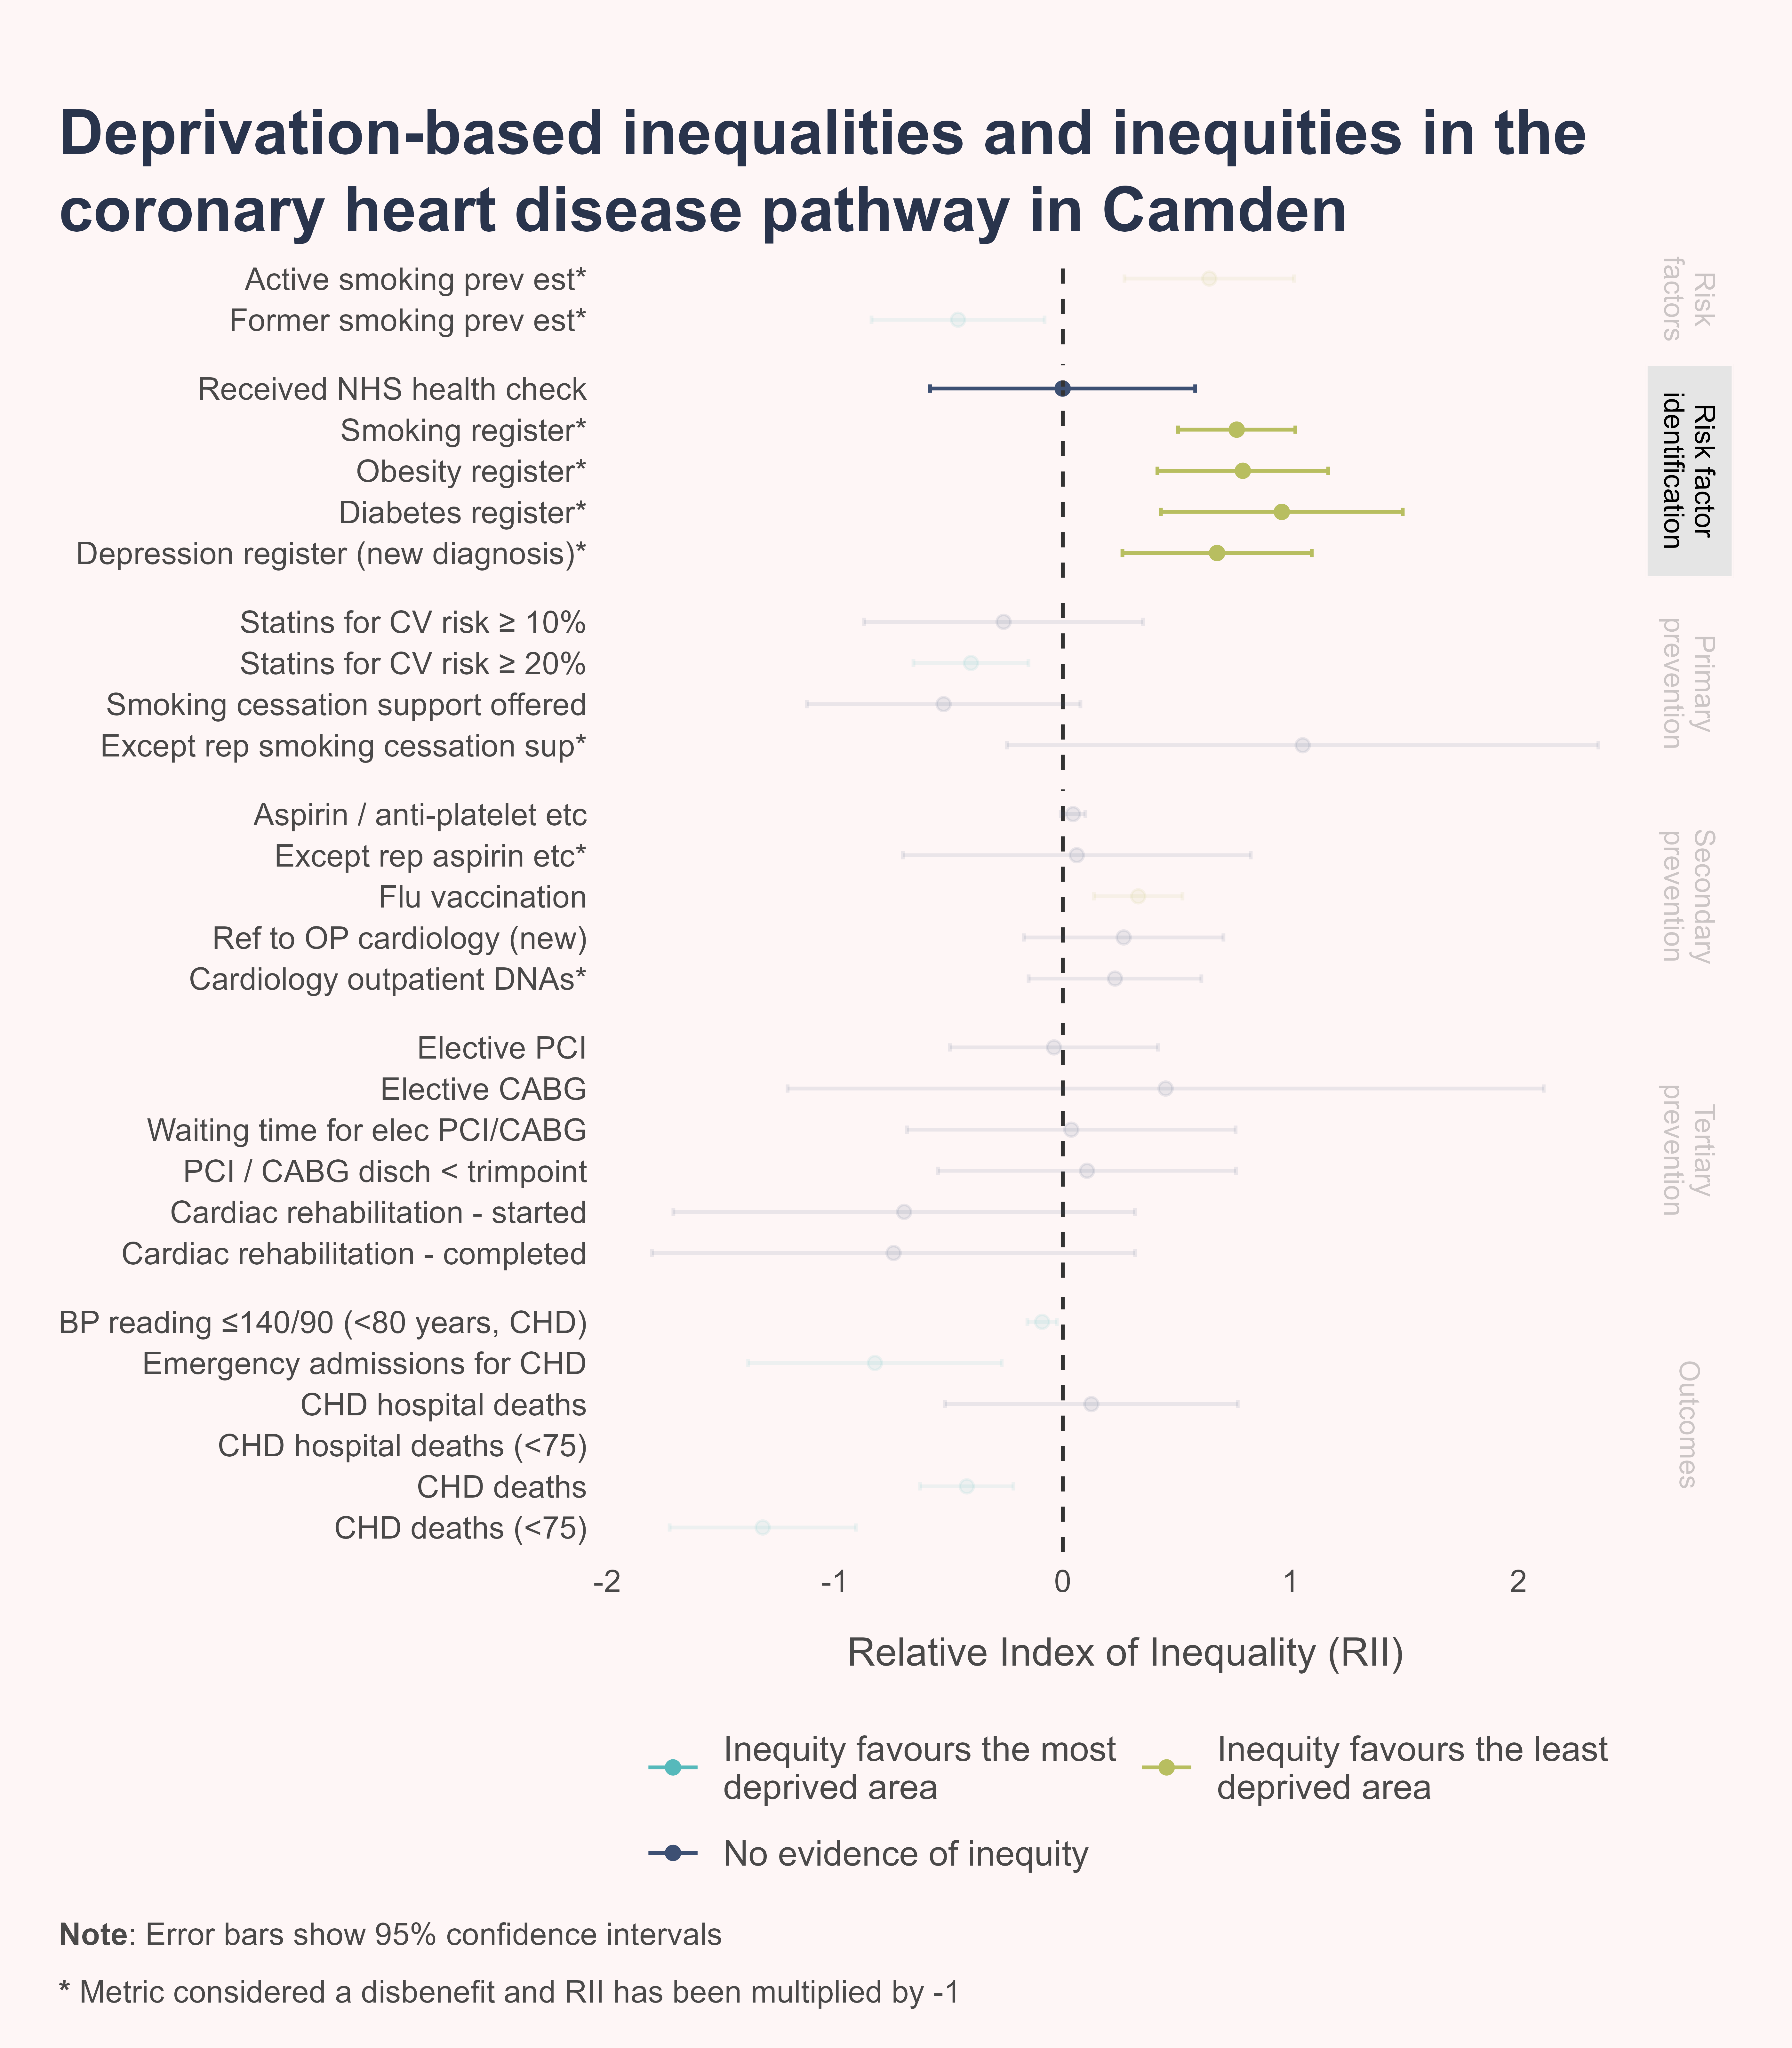
Patients from the least deprived areas are less likely to be identified with risk factors, such as smoking, obesity, diabetes, or depression, by their GP and placed on a register, than patients in the most deprived areas.
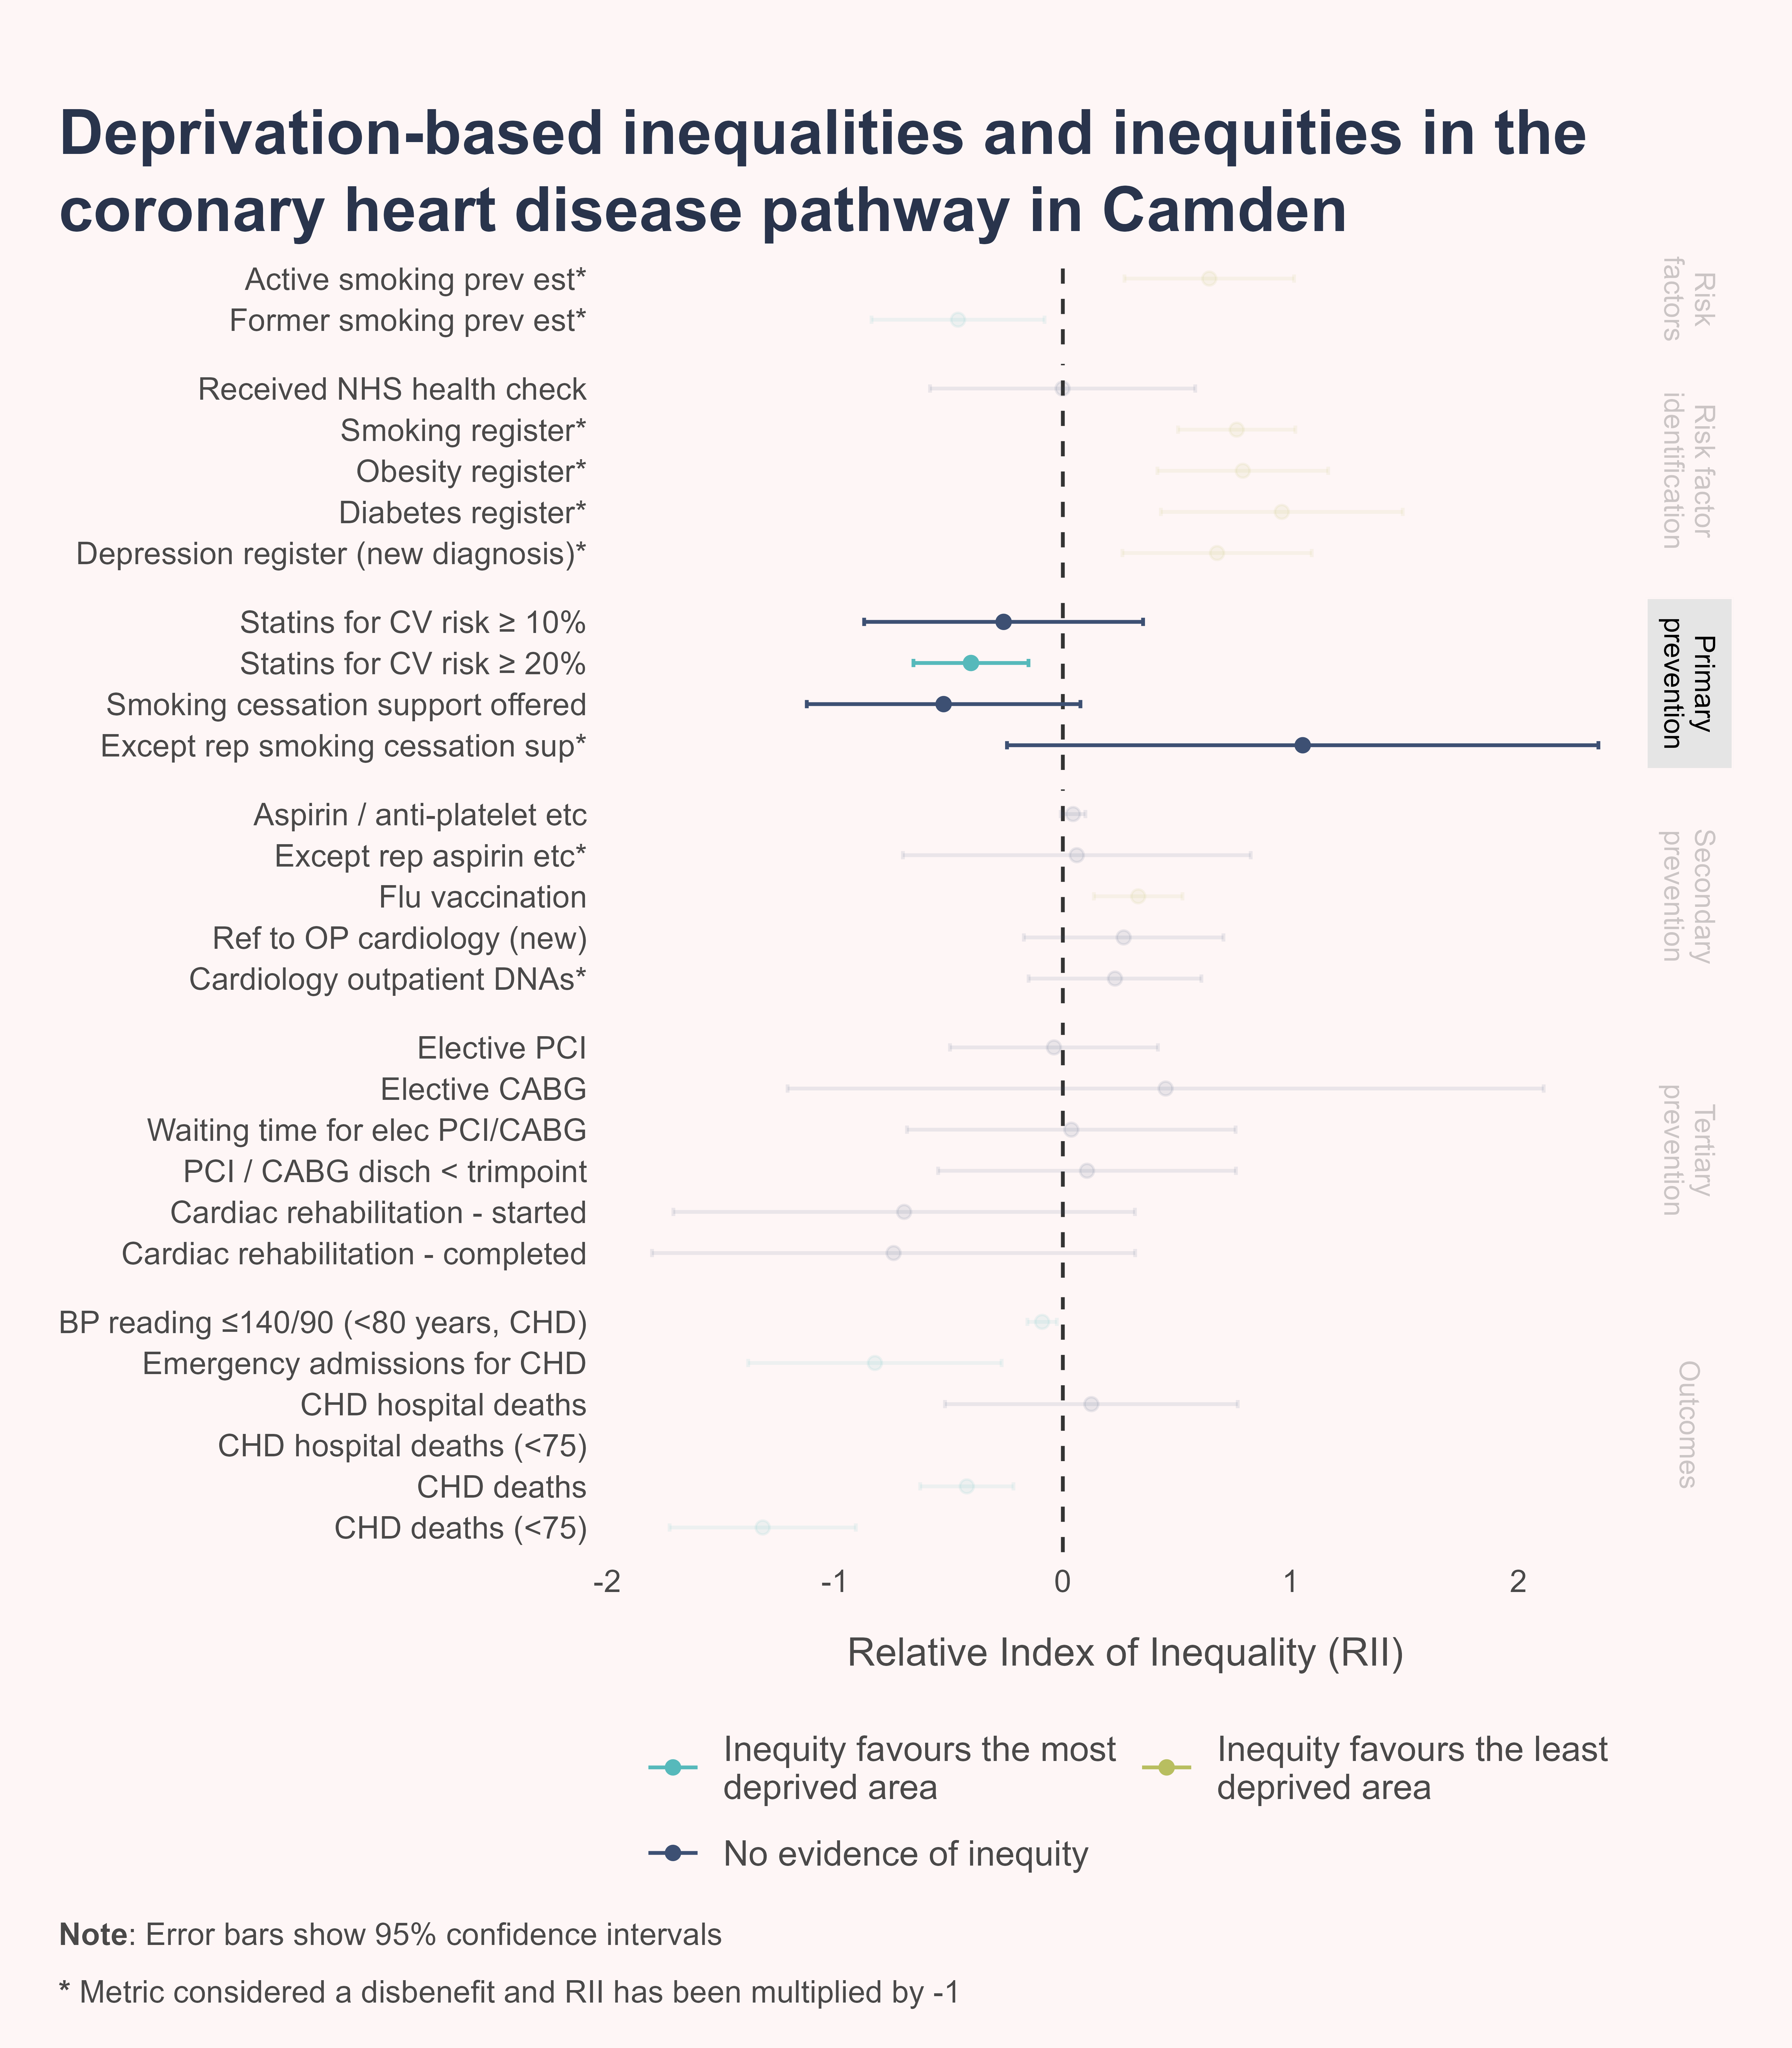
Patients in the most deprived areas are more likely to be prescribed statins when they have been identified as at risk of developing a heart attack or stroke.
Patients from the least deprived areas are more likely to receive a flu vaccination.
Patients from the most deprived areas are more likely to have had a satisfactory blood pressure reading of those measured in the preceding 12 months, and less likely to be admitted to hospital as an emergency with a CHD diagnosis or to die from CHD.
Cardiovascular disease is also a major cause of illness, disability and loss of independence
Disability-adjusted life years (DALYs) are a useful measure of disease burden and are calculated as the sum of years of life lost due to premature death and years lived with disability. One DALY represents the loss of one year of full health.
Despite a 33% reduction in the burden of cardiovascular disease in London over the past two decades, it remained the third leading cause of DALYs in 2023 - after cancer and mental health disorders - accounting for 12.7% of the total [1].
Much of this burden is driven by modifiable risk factors. In London, the leading risk factors for DALYs from cardiovascular disease are hypertension, which is attributable for 40.3% of DALYs, followed by high LDL cholesterol and high body-mass index [1].
The same risk factors are also the leading contributors to deaths from cardiovascular disease, while hypertension is additionally the leading risk factor for all-cause mortality and is responsible for around one in ten deaths in London [1].
Spotlight on hypertension
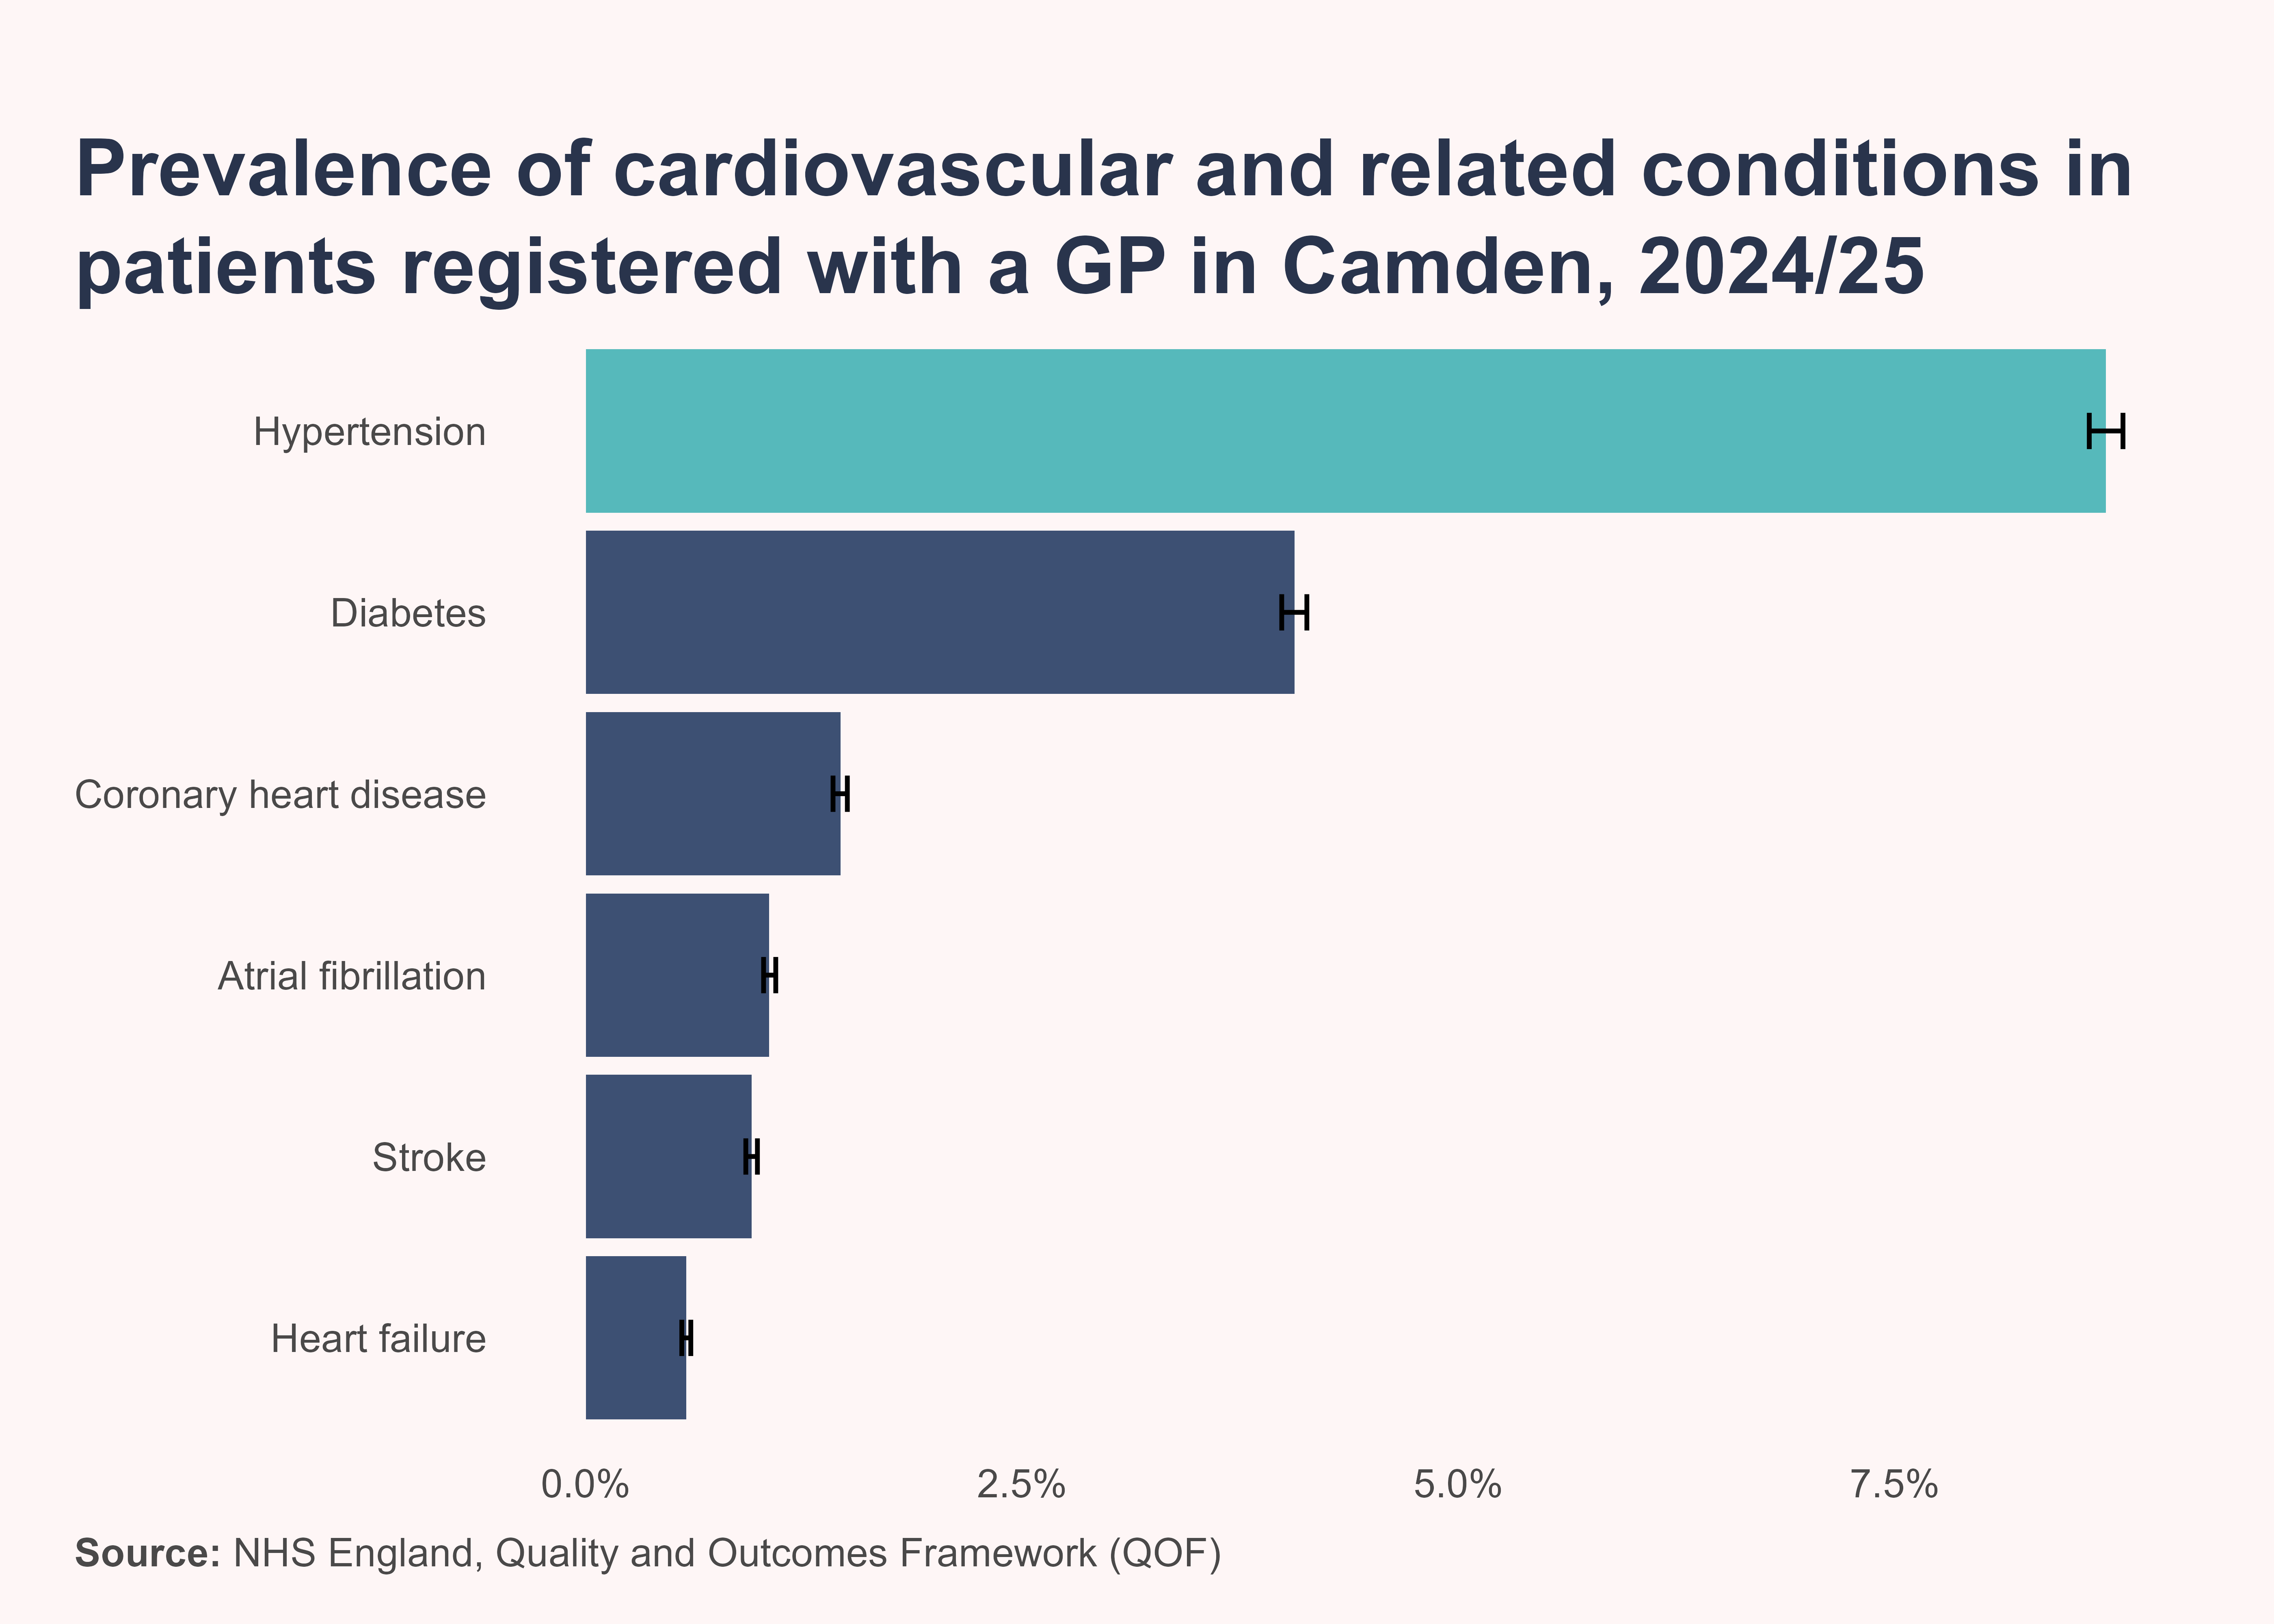
Hypertension is the most commonly diagnosed cardiovascular condition among all patients registered with a GP in Camden, with around 28,500 (8.7%) patients living with a diagnosis in 2024/25.
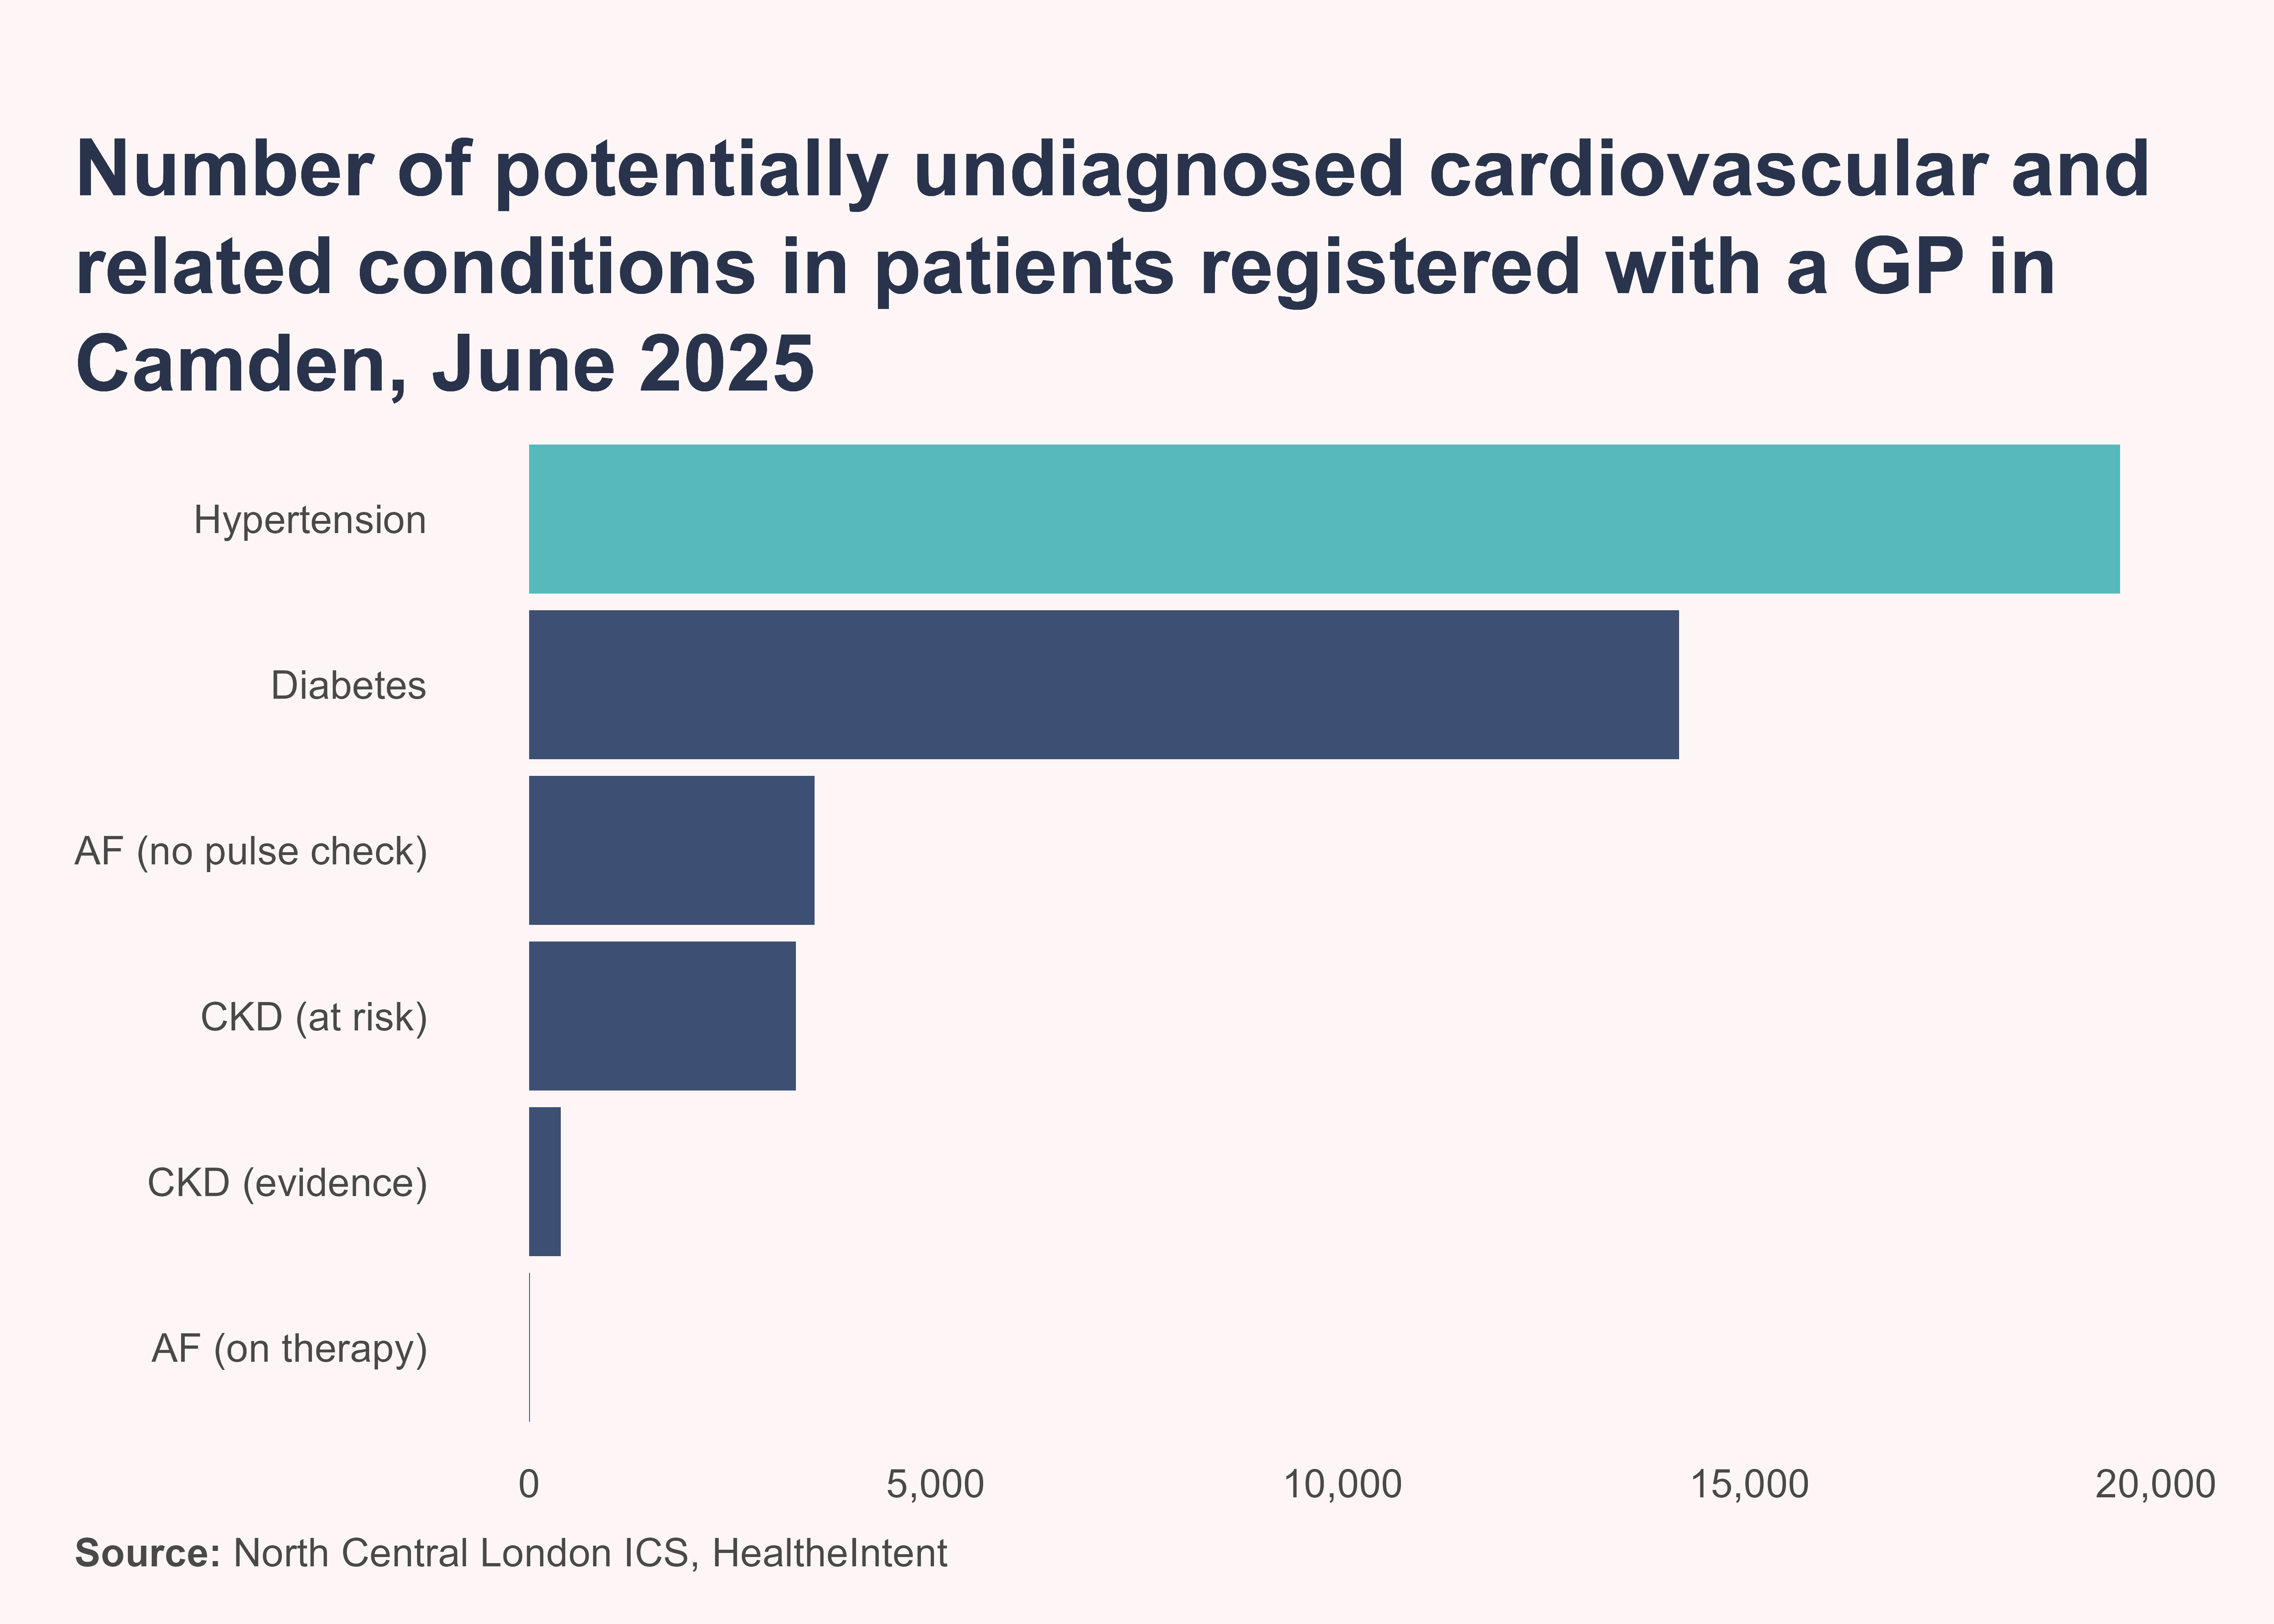
However, hypertension rarely causes symptoms, meaning many cases remain undiagnosed, and critically, untreated. A local case-finding tool has estimated that around 19,560 people registered with a GP in Camden are living with potentially undiagnosed hypertension.
Callout-more-infoFind out more
For more data and evidence on cardiovascular disease in Camden visit the Cardiovascular Disease JSNA Profile.
References
[1]
Institute for Health Metrics and Evaluation (IHME). GBD Compare Data Visualization 2025. https://vizhub.healthdata.org/gbd-compare/ (accessed March 27, 2026).