Key points
Cardiovascular disease (CVD) is one of the primary causes of ill health, disability and death in England, despite the fact that many cardiovascular conditions are preventable.
In Camden, the leading risk factors driving risk associated with CVD are high blood pressure, high cholesterol and obesity, as the impact of particulate matter and smoking has decreased over the previous 10 to 15 years.
Since the turn of the century rates of mortality linked to CVD (including stroke and heart disease) in Camden, London and England have decreased, though the rate of decline has levelled off over the last decade.
The prevalence of disease and risk factors (such as hypertension) remain stable and in some cases have increased, in some circumstances this is due to more successful identification and diagnosis.
CVD impacts certain cohorts of the population disproportionately. Rates of mortality linked to CVD are higher in males than it is in females, whilst those living in more deprived areas are two times more likely to die prematurely as a result of CVD.
Why it matters
Cardiovascular disease (CVD) is an umbrella term for all diseases of the heart and blood vessels. This includes everything from conditions that are inherited or occur from birth, to those that develop later, such as coronary heart disease, atrial fibrillation, heart failure, and stroke.[1] Over 6.4 million people in England are living with CVD and it causes just over a quarter of all deaths in England – an average of 390 people each day or one death every four minutes.[1] The British Heart Foundation estimates the healthcare costs relating to heart and circulatory diseases in England at £10 billion each year.[1]
[1]
British Heart Foundation. England Factsheet. British Heart Foundation 2025.
[2]
British Heart Foundation. Cardiovascular inequalities in England: An analysis. British Heart Foundation 2025.
[3]
Commission on Race and Ethnic Disparities. Ethnic disparities in the major causes of mortality and their risk factors – a rapid review. GOVUK 2021.
CVD remains a significant public health challenge in London, mirroring national trends across the UK. It is one of the leading causes of premature mortality and a major contributor to health inequalities.[2] There is a disproportionate burden in certain communities, particularly in areas of high socioeconomic deprivation and among some ethnic groups;risk factors such as hypertension, obesity, smoking, and physical inactivity are disproportionately represented in these communities, fuelling the health inequality gap.[2,3]
Targeted public health strategies, improved access to preventive care, and culturally tailored health interventions are essential to reducing the impact of cardiovascular disease and addressing the disparities that exist within London’s population.[4]
[4]
Thomas T, Health TT, correspondent inequalities. Structural racism leading to stark health inequalities in London, report shows. The Guardian 2024.
Causes and risk factors
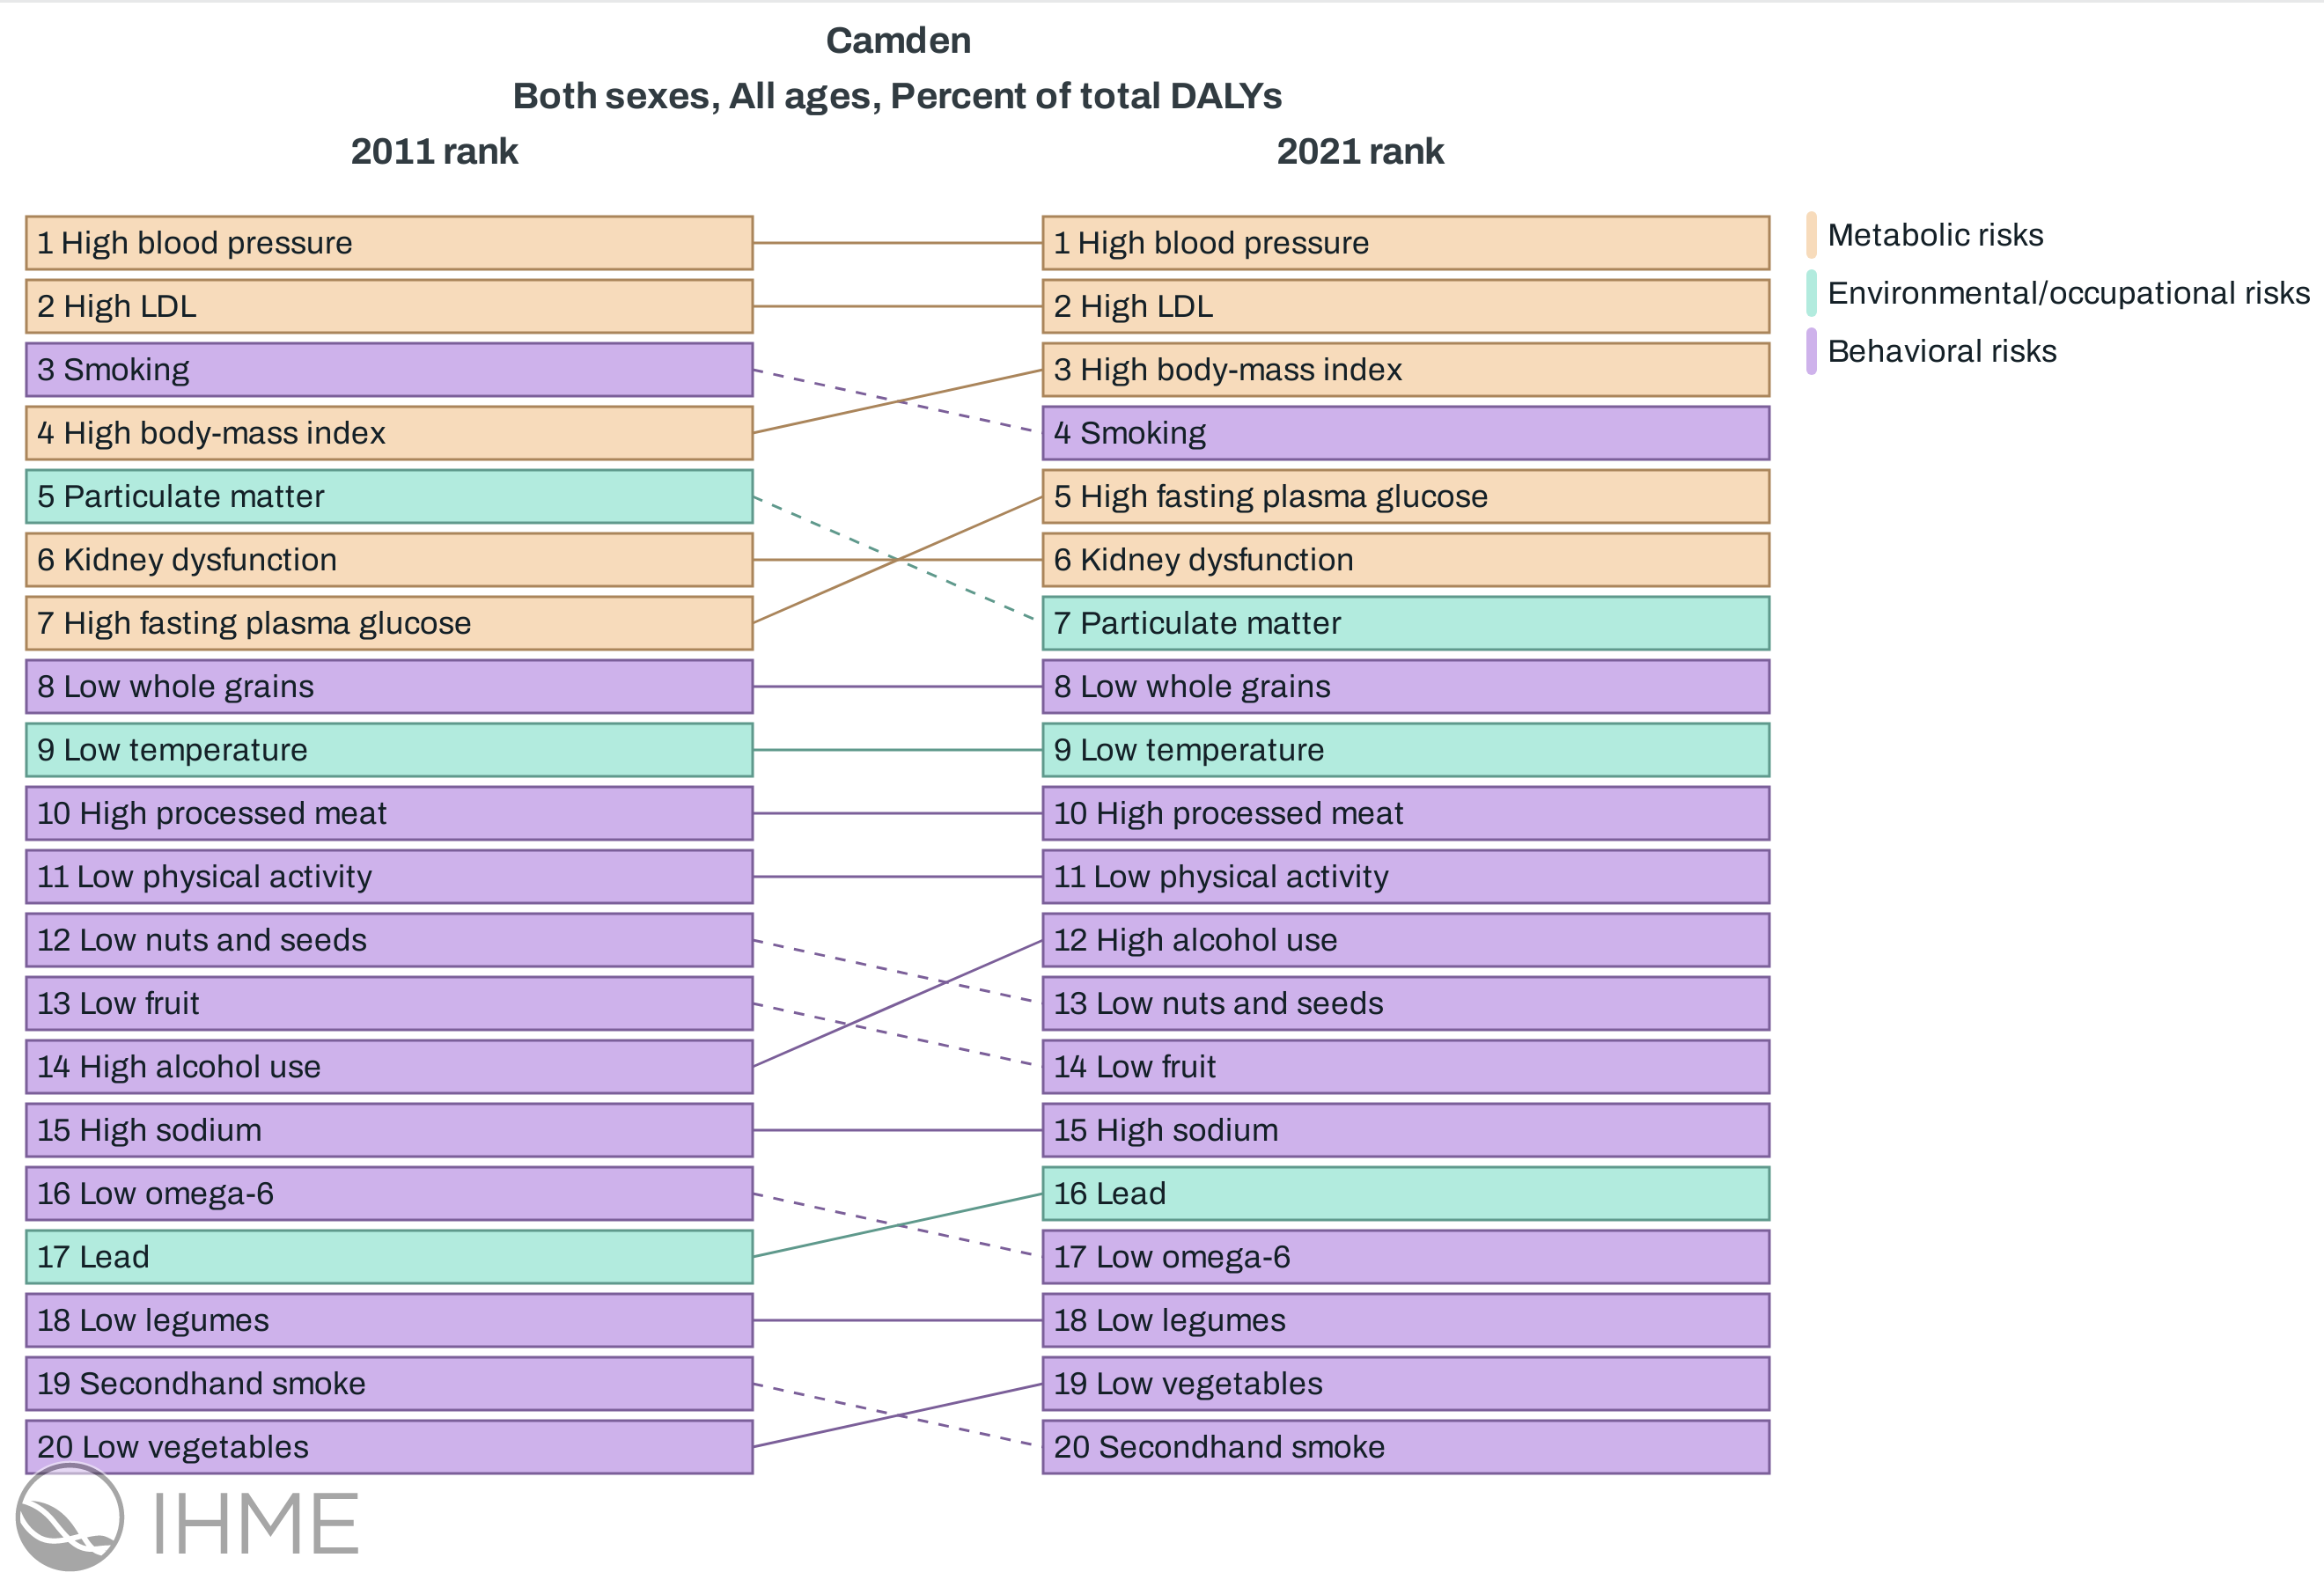
There are numerous risk factors that contribute to the onset of cardiovascular disease. The Global Burden of Disease (GBD) study outlines the relative risk associated with the burden of cardiovascular disease in Camden.[5] The following ranks the risks and shows how the extent of the risk changed between 2011 and 2021.
[5]
GBD Compare. Institute for Health Metrics and Evaluation 2015.
High blood pressure and high LDL were the two largest risk factors contributing to disability-adjusted life years (DALY) linked to CVD, which reflected the narrative ten years prior in 2011. Smoking and high body-mass index were also in the top five risk factors in both 2011 and 2021. In 2011, particulate matter pollution was ranked in the top five risk factors, however this was displaced in 2021 by high fasting plasma glucose (hyperglycemia).
The following section explores some of the risk factors above and the impact they have on the population of Camden.
Hypertension
Hypertension is defined as a level of blood pressure consistently above 140/90 mmHg.[6] This is itself impacted by multiple lifestyle factors, including smoking status and physical activity, as well as certain demographic factors, including socioeconomic group and ethnicity.
[6]
National Institue for Health and Care Excellence. Hypertension: What is it? 2025.
High blood pressure increases risks of cardiovascular disease, including heart disease, strokes and heart failure. The following graphs outline the prevalence of hypertension in Camden over time.
Between 2022/23 and 2023/24, Camden experienced an increase in the prevalence of hypertension from 8.75% to 8.83%. This was not a significant change. NCL ICB, London and England observed prevalences of hypertension that were significantly greater than the Camden geography, which may be explained by the younger age demographic in Camden.
Hypertension is under-diagnosed nationally
It is important to note that there are a number of individuals living with undiagnosed hypertension. Based on surveys conducted in private households by the Health Survey for England in 2021, an estimated 7.5% of Camden’s population had not been formally diagnosed with hypertension by a doctor or nurse, despite their mean blood pressure being greater than or equal to 140mmHg systolic and/or 90mmHg diastolic.[7]
[7]
Office for Health Improvement and Disparities. Public health profiles. Office for Health Improvement and Disparities 2024.
High cholesterol
Cholesterol is a fatty substance in your blood which your body can produce naturally as well as obtain from foods that we eat. Smoking, physical activity and diet all have an effect on the amount of cholesterol in the blood (as well as uncontrollable factors such as ageing). The build up of bad cholesterol (non-high density lipo-proteins or non-HDL) in the bloods leads to the narrowing of blood vessels, which in turn increases the likelihood of cardiovascular disease, along with added risk of a stroke and a heart attack in particular.
The QRISK score is a tool used by the NHS to determine the risk individuals will have a stroke or heart attack in the next 10 years, based on known risk factors (e.g. age, gender, ethnicity, smoking status and others). The higher the percentage score, the higher the risk of cardiovascular disease. Individuals with a score greater than 20% are at the highest risk.
The following chart depicts the proportion of patients in Camden PCN’s that have a QRISK score of at least 20% and are currently on lipid-lowering treatment (LLT). NHS Operational Planning Guidance 2023/24 established the primary prevention objective of increasing the proportion of patients with a high QRisk score prescribed LLT to 65%.[8] The below graph presents the proportion of those at risk of CVD recorded to be on lipid-lowering treatment at the Camden and at the ICB level. To note, the counts and denominator for Camden have been established by summing the suppressed values across the PCN’s within Camden.
[8]
NHS England. NHS England: Priorities and operational planning guidance 2024/25 2024.
In the six months leading to December 2024 the proportion of the population with a QRisk score of >20% already on LLT in females was statistically similar to that observed in males, with values of 61.1% and 61.4% respectively.
Those with a QRisk of >20% within the female population of Camden already on LLT (61.1%) was significantly lower than the NCL ICB average (63.7%). The proportion of the female population with a QRisk score of >20% already on LLT was significantly lower than the 65% NHS target. There was no significant difference in the male population with a QRisk score of >20% already on LLT between Camden and NCL ICB. The proportion of the male population with a QRisk score of >20% already on LLT was significantly lower than the 65% NHS target.
In the six months leading to December 2024, all ethnic groups except for the multiple/mixed population had a significantly greater proportion of their at risk populations prescribed LLT compared to the white ethnic group. Comparisons against the NCL average and the NHS operational target are outlined below the graph.
Asian:
In the latest time period, those with a QRisk of >20% within the asian population of Camden already on LLT (73.4%) was significantly greater than the NCL ICB average (69.8%). The proportion of the asian population with a QRisk score of >20% already on LLT was significantly greater than the 65% NHS target.
Black:
There was no significant difference in the black population with a QRisk score of >20% already on LLT between Camden and NCL ICB. The proportion of the black population with a QRisk score of >20% already on LLT was statistically similar to the 65% NHS target.
Mixed/Multiple Ethnic Groups:
There was no significant difference in the multiple ethnic groups population with a QRisk score of >20% already on LLT between Camden and NCL ICB. The proportion of the multiple ethnic groups population with a QRisk score of >20% already on LLT was statistically similar to the 65% NHS target.
Other Ethnic Group:
There was no significant difference in the other ethnic group population with a QRisk score of >20% already on LLT between Camden and NCL ICB. The proportion of the other ethnic group population with a QRisk score of >20% already on LLT was statistically similar to the 65% NHS target.
White:
In the latest time period, those with a QRisk of >20% within the white population of Camden already on LLT (57.2%) was significantly lower than the NCL ICB average (60.9%). The proportion of the white population with a QRisk score of >20% already on LLT was significantly lower than the 65% NHS target.
NHS Health Check
The NHS Health Check is a free service offered to those aged between 40 - 74 who do not have any pre-existing diagnoses of heart disease, CKD, hypertension and other conditions. These checks result in a risk score for cardiovascular events like a heart attack or stroke. These checks aim to encourage a patient to take action in improving their health, which may involve taking medication or making lifestyle changes.
The following graph depicts the proportion of the eligible population that have received an NHS health check. The eligible population is the estimated number of Camden’s residents aged between 40 - 74, minus the estimated number of individuals who are already on a health register. Visit OHID Fingertips for more details on NHS Health Checks.
Between 2023/24 and 2024/25, Camden experienced a decrease in the proportion of patients that have received an NHS Health Check from 20.9% to 20.4%. This was not a significant change. In 2024/25 the proportion of patients that have received an NHS Health Check in Camden was significantly greater than that observed in London, with a value of 20.4% compared to a value of 10.9%.
Other risk factors
There are a range of other factors that increase the risk of developing cardiovascular disease. Smoking cigarettes is well known in its aiding of the build-up in fatty material in blood vessels. The clogging of these arteries can lead to both heart attacks and strokes. By reducing the prevalence of smoking, CVD can also be reduced. In the 20 years leading up to 2015, a 35% decline in smoking prevalence was linked to 24% fewer deaths due to Coronary Heart Disease in Finland.[9] This aligns with predictions made by The Health Foundation, anticipating that the prevalence of CVD will decrease by 2040, with the primary driver behind this being a reduction in smoking.[10]
[9]
Keto J, Ventola H, Jokelainen J, Linden K, Keinanen-Kiukaanniemi S, Timonen M, et al. Cardiovascular disease risk factors in relation to smoking behaviour and history: A population-based cohort study. Openheart 2016;3:e000358. https://doi.org/ doi:10.1136/openhrt-2015-000358.
[10]
The Health Foundation. Health inequalities in 2040 2024.
[11]
Wahid A, Manek N, Nichols M, Kelly P, Foster C, Webster P, et al. Quantifying the Association Between Physical Activity and Cardiovascular Disease and Diabetes: A Systematic Review and Meta-Analysis. Journal of the American Heart Association 2016;5:e002495. https://doi.org/10.1161/JAHA.115.002495.
Levels of physical activity and obesity influence the risk of CVD. The British Heart Foundation estimate that exercising can reduce the risk of CVD by 35%, along with other benefits towards mental health, weight and sleep quality. Furthermore, increasing your level of activity from relatively active to the recommended levels (150 minutes of moderate-intensity aerobic activity) can reduce mortality linked to CVD by 23%, while also reducing incidence by 17%.[11]
What the data shows us
Cardiovascular disease
Hospital admissions - overview
Cardiovascular disease is a large contributor to overall hospital admissions across the country, with 100,000 admissions a year related to heart attacks.[12] During 2023/24, there were a total of 2225 admissions linked to residents from the Camden borough.
[13]
Herbert A, Wijlaars L, Zylbersztejn A, Cromwell D, Hardelid P. Data Resource Profile: Hospital Episode Statistics Admitted Patient Care (HES APC). International Journal of Epidemiology 2017;46:1093–1093i. https://doi.org/10.1093/ije/dyx015.
The following uses Hospital Episode Statistics (HES) data and explores how admissions vary through time and across different groups of individuals. The extract includes any secondary care-based activity that requires a hospital bed for treatment.[13]
Between 2022/23 and 2023/24, Camden experienced an increase in the rate of hospital admissions from 1389.4 per 100,000 to 1478.5 per 100,000. This was not a significant change. In 2023/24 the rate of hospital admissions in Camden was statistically similar to that observed in NCL ICB, with values of 1478.5 per 100,000 and 1514.3 per 100,000 respectively.
The following map presents admission rates observed across the wards of Camden. Hover over graph to explore admission rates in the latest year as well as proportional change experienced since the previous year. The lower the rank, the higher the percentage increase in admission rate (i.e. rank 1 indicates the highest increase in admissions rate since the previous year).
The ward with the highest hospital admissions rate in 2023/24 was St Pancras & Somers Town, with a value of 2105.2 per 100,000 population. The ward with the lowest hospital admissions rate in was Frognal, with a value of 776.28 per 100,000 population.
Between 2022/23 and 2023/24, males experienced an increase in the rate of hospital admissions from 1831 per 100,000 to 1919.3 per 100,000. This was not a significant change. Females experienced an increase in the rate of hospital admissions from 1021.9 per 100,000 to 1107.2 per 100,000. This was not a significant change. In 2023/24 the rate of hospital admissions in males was significantly greater than that observed in females, with a value of 1919.3 per 100,000 compared to a value of 1107.2 per 100,000
The following explores how rates of hospital admissions vary by ethnic group. In the latest year of available data (2023/24), 15% of admitted patients had an unknown or not stated ethnicity. This may mean some ethnic groups are under or over-represented.
The population used to derive the following rates were obtained from the ONS, based on the 2021 Census.
In the latest period (2023/24), no groups included in the graph recorded hospital admission rates significantly lower than the white ethnic group. The asian ethnic group, black ethnic group and other ethnic group observed hospital admission rates that were significantly greater than the white ethnic group.
Population estimates are unavailable for the latest year of admissions data - estimates of admission rates are included on the graph and are highlighted by a dotted line. Because the population used in the calculation is that of the previous year, admission rates should be interpreted with caution. Text summaries below refer to the period 2022/23, where both admission figures and population estimates exist.
Between 2021/22 and 2022/23, quintile 1 (most deprived) experienced a decrease in the rate of hospital admissions from 2533 per 100,000 to 2062.8 per 100,000. This was a significant change. Quintile 5 (least deprived) experienced a decrease in the rate of hospital admissions from 1026.3 per 100,000 to 1024.6 per 100,000. This was not a significant change. In 2022/23 the rate of hospital admissions in quintile 1 (most deprived) was significantly greater than that observed in quintile 5 (least deprived), with a value of 2062.8 per 100,000 compared to a value of 1024.6 per 100,000
Mortality - overview
Cardiovascular disease is responsible for a large proportion of deaths across the globe. In 2021, CVD caused an estimated 20 million deaths, equating to roughly 1 out of 3 deaths globally.[14]
In the UK, CVD accounts for a quarter of deaths in the under 75 age group.[15] The following looks at preventable cardiovascular mortality from Fingertips. The following looks at U75 mortality linked to CVD by sex.
Between 2020 - 22 and 2021 - 23, Camden experienced a decrease in the under 75 CVD mortality rate (all population) from 72.8 per 100,000 to 71.1 per 100,000. This was not a significant change. In 2021 - 23 the under 75 CVD mortality rate (all population) in Camden was statistically similar to that observed in London, with values of 71.1 per 100,000 and 74.5 per 100,000 respectively.
Between 2020 - 22 and 2021 - 23, Camden experienced a decrease in the under 75 CVD mortality rate (females) from 42.7 per 100,000 to 41.4 per 100,000. This was not a significant change. In 2021 - 23 the under 75 CVD mortality rate (females) in Camden was statistically similar to that observed in London, with values of 41.4 per 100,000 and 43.4 per 100,000 respectively.
Between 2020 - 22 and 2021 - 23, Camden experienced a decrease in the under 75 CVD mortality rate (males) from 107 per 100,000 to 105 per 100,000. This was not a significant change. In 2021 - 23 the under 75 CVD mortality rate (males) in Camden was statistically similar to that observed in London, with values of 105 per 100,000 and 109 per 100,000 respectively.
Preventable mortality - overview
The following explores mortality that is linked to preventable death. A death is considered preventable if the underlying cuase, in the light of the understanding the determinants of health at the time of death, could have mainly been avoided with effective public health or primary prevention intervention. For further information in regard to the rationale behind preventable mortality, visit OHID Fingertips.
Between 2020 - 22 and 2021 - 23, Camden experienced a decrease in the rate of preventable under 75 mortality from 30.7 per 100,000 to 30.1 per 100,000. This was not a significant change. In 2021 - 23 the rate of preventable under 75 mortality in Camden was statistically similar to that observed in London, with values of 30.1 per 100,000 and 29.9 per 100,000 respectively.
Between 2020 - 22 and 2021 - 23, Camden experienced a decrease in the rate of preventable under 75 mortality (females) from 16.8 per 100,000 to 15.7 per 100,000. This was not a significant change. In 2021 - 23 the rate of preventable under 75 mortality (females) in Camden was statistically similar to that observed in London, with values of 15.7 per 100,000 and 16 per 100,000 respectively.
Between 2020 - 22 and 2021 - 23, Camden experienced a decrease in the rate of preventable under 75 mortality (males) from 46.5 per 100,000 to 46.4 per 100,000. This was not a significant change. In 2021 - 23 the rate of preventable under 75 mortality (males) in Camden was statistically similar to that observed in London, with values of 46.4 per 100,000 and 45.1 per 100,000 respectively.
Cardiovascular disease and SMI
Individuals who have severe mental illness (SMI) are twice as likely to smoke as the general population, and have a higher risk of obesity, diabetes and cardiovascular disease. Among those aged under 75 years, individuals who are in contact with mental services have death rate that is 3.3 times higher than the general population.[16]
[16]
Public Health England. Severe mental illness (SMI) and physical health inequalities: briefing. GOVUK 2018.
Between 2020 - 22 and 2021 - 23, Camden experienced an increase in the rate of premature mortality in adults with SMI from 25 per 100,000 to 28.2 per 100,000. This was not a significant change. In 2021 - 23 the rate of premature mortality in adults with SMI in Camden was statistically similar to that observed in London, with values of 28.2 per 100,000 and 22.2 per 100,000 respectively. In 2021 - 23 the rate of premature mortality in adults with SMI in Camden was significantly greater than that observed in England, with a value of 28.2 per 100,000 compared to a value of 20.4 per 100,000.
Coronary heart disease
Coronary heart disease is often referred to as ischaemic heart disease (IHD). Coronary heart disease occurs when the coronary arteries become narrowed due to fatty deposits within their walls. This prevents blood from being pumped to the heart. The British Heart Foundation estimates that around 2.3 million people live with CHD in the UK.[12]
Between 2022/23 and 2023/24, Camden experienced a decrease in the IHD admission rate (all population) from 330 per 100,000 to 320 per 100,000. This was not a significant change. In 2023/24 the IHD admission rate (all population) in Camden was significantly less than that observed in England, with a value of 320 per 100,000 compared to a value of 391 per 100,000.
The following sections outlines mortality due to IHD by sex. Across the UK, around 66,000 individuals die due to IHD a year, with it being largest contributor to deaths in the male population group.[12]
[12]
British Heart Foundation. Facts and figures. British Heart Foundation 2025.
Between 2020 - 22 and 2021 - 23, Camden experienced a decrease in the under 75 IHD mortality rate (all population) from 43.5 per 100,000 to 42.8 per 100,000. This was not a significant change. In 2021 - 23 the under 75 IHD mortality rate (all population) in Camden was statistically similar to that observed in London, with values of 42.8 per 100,000 and 38.9 per 100,000 respectively.
Between 2020 - 22 and 2021 - 23, Camden experienced a decrease in the under 75 IHD mortality rate (females) from 21 per 100,000 to 19.2 per 100,000. This was not a significant change. In 2021 - 23 the under 75 IHD mortality rate (females) in Camden was statistically similar to that observed in London, with values of 19.2 per 100,000 and 17.1 per 100,000 respectively.
Between 2020 - 22 and 2021 - 23, Camden experienced an increase in the under 75 IHD mortality rate (males) from 69 per 100,000 to 69.6 per 100,000. This was not a significant change. In 2021 - 23 the under 75 IHD mortality rate (males) in Camden was statistically similar to that observed in London, with values of 69.6 per 100,000 and 62.9 per 100,000 respectively.
Atrial Fibrillation
Atrial Fibrillation (AF) is a form of arrhythmia, which is a problem that leads to an inconsistent or irregular heartbeat. The random nature of the heartbeat means blood may not be pumped around the body as effectively as it could be. AF is commonly associated with high blood pressure, heart valve disease, diabetes and obesity.
The prevalence of AF has increased nationally over the previous two decades.[14] This is primarily down to increased diagnosis and improved survival of those with heart disease. The compounded nature of these risk factors increase the chances of heart disease, heart failure and strokes.
[14]
British Heart Foundation. Global heart & circulatory diseases factsheet 2025.
Between 2022/23 and 2023/24, Camden experienced an increase in the prevalence of AF from 1.01% to 1.05%. This was not a significant change. In 2023/24 the prevalence of AF in Camden was significantly less than that observed in London, with a value of 1.05% compared to a value of 1.15%.
Peripheral arterial disease (PAD)
Peripheral arterial disease (PAD) occurs when fat deposits accumulate in an individuals peripheral arteries, as opposed to the those around the heart (coronary heart disease). According to the British Heart Foundation, PAD affects roughly 1 in 5 individuals above the age of 60 in the UK.[17] Smoking, physical activity and hypertension are all common risk factors, and PAD itself can increase the likelihood of heart disease and stroke.
[17]
British Heart Foundation. Focus on: Peripheral arterial disease. British Heart Foundation 2014.
The following outlines those patients with peripheral arterial disease as recorded on practice disease registers, as per recorded on the Quality and Outcomes Framework. To note, the values for Camden have been derived by aggregating the list size and register sizes from GP’s within a Camden PCN.
Between 2022/23 and 2023/24, Camden experienced an increase in the prevalence of PAD from 0.286% to 0.286%. This was not a significant change. In 2023/24 the prevalence of PAD in Camden was significantly less than that observed in London NHS Region, with a value of 0.286% compared to a value of 0.311%.
Heart failure
Heart failure is a broad term which describes the hearts inability to effectively pump blood around the body. Heart failure means oxygenated blood is not getting to the muscles and organs that need it, which can cause fatigue, shortness of breath and the feeling of being lightheaded. Heart failure can be caused by prolonged hypertension, cardiomyopathy and a heart attack.[18]
[18]
British Heart Foundation. Heart failure. British Heart Foundation 2022.
Between 2022/23 and 2023/24, Camden experienced an increase in the prevalence of heart failure from 0.574% to 0.59%. This was not a significant change. In 2023/24 the prevalence of heart failure in Camden was statistically similar to that observed in London, with values of 0.59% and 0.615% respectively.
Between 2022/23 and 2023/24, Camden experienced an increase in the heart failure admission rate (all population) from 168 per 100,000 to 188 per 100,000. This was not a significant change. In 2023/24 the heart failure admission rate (all population) in Camden was statistically similar to that observed in England, with values of 188 per 100,000 and 180 per 100,000 respectively.
Stroke / TIA
A stroke or a transient ischaemic attacks (TIA) occurs when there is a short or prolonged interruption of blood flow into the brain through an artery. When this happens, damage to brain cells occur due to a lack of oxygenated blood and other important nutrients.[19] Strokes can have a significant impact on the long term health of an individual and are the single largest cause of severe disability in the UK.[20] Risk factors associated with strokes include levels of physical activity, diet and smoking status. Those with diabetes are twice as likely to have a stroke.
[19]
British Heart Foundation. Stroke - causes, signs and symptoms. British Heart Foundation 2024.
[20]
Brain Research UK. Stroke – Neurological condition n.d.
Between 2022/23 and 2023/24, Camden experienced an increase in the prevalence of strokes/TIA’s from 0.88% to 0.93%. This was not a significant change. In 2023/24 the prevalence of strokes/TIA’s in Camden was significantly less than that observed in London, with a value of 0.93% compared to a value of 1.11%.
Between 2022/23 and 2023/24, Camden experienced an increase in the stroke admission rate (all population) from 172 per 100,000 to 180 per 100,000. This was not a significant change. In 2023/24 the stroke admission rate (all population) in Camden was statistically similar to that observed in England, with values of 180 per 100,000 and 173 per 100,000 respectively.
Strokes can be severe and they cause 34,000 deaths a year in the UK.[21] Although still a large contributor, mortality from strokes have decreased since the start of the century due to better identification of symptoms and treatment methods.
[21]
British Heart Foundation. Stroke research. British Heart Foundation n.d.
Between 2020 - 22 and 2021 - 23, Camden experienced an increase in the under 75 stroke mortality rate (all population) from 10.8 per 100,000 to 11.1 per 100,000. This was not a significant change. In 2021 - 23 the under 75 stroke mortality rate (all population) in Camden was statistically similar to that observed in London, with values of 11.1 per 100,000 and 13.2 per 100,000 respectively.
Between 2020 - 22 and 2021 - 23, Camden experienced an increase in the under 75 stroke mortality rate (females) from 8.13 per 100,000 to 8.69 per 100,000. This was not a significant change. In 2021 - 23 the under 75 stroke mortality rate (females) in Camden was statistically similar to that observed in London, with values of 8.69 per 100,000 and 10 per 100,000 respectively.
Between 2020 - 22 and 2021 - 23, Camden experienced a decrease in the under 75 stroke mortality rate (males) from 13.8 per 100,000 to 13.7 per 100,000. This was not a significant change. In 2021 - 23 the under 75 stroke mortality rate (males) in Camden was statistically similar to that observed in London, with values of 13.7 per 100,000 and 16.7 per 100,000 respectively.