Why it matters
The rising prevalence of childhood overweight and obesity is a growing public health concern. In England, nearly one in four children are living with overweight or obesity in reception, rising to one in three in year 6 [1].
Children living with obesity are more likely to become adults living with obesity, and consequently have a greater risk of many health conditions, including cardiovascular disease, type 2 diabetes and some types of cancer, disability and premature mortality [2]. The risk of children living with obesity becoming adults living with obesity increases with age [2].
What we did
This report presents analysis of the National Child Measurement Programme (NCMP) data exploring how primary school children moved between body mass index (BMI) categories from reception (age 4 to 5 years) to year 6 (age 10 to 11 years) in state-maintained schools in Camden. This report links records for children who were in reception between the 2016/17 - 2018/19 academic years and year 6 between 2022/23 - 2024/25.
Record matching
Record matching was completed using the pupil reference ID column.
Data cleaning
There were 2,642 records in the NCMP dataset for children attending participating state-maintained schools who had measurements recorded in both reception (2016/17 - 2018/19) and year 6 (2022/23 - 2024/25). There are various reasons why a child may not have a measurement recorded in year 6, including:
- the child was absent on the day of measurement
- the child no longer attended a participating state-maintained school in Camden
- a parent or carer did not provide consent for measurement
- the child did not want to be measured
- the school did not participate in the NCMP.
Children’s BMI categories are defined using sex-specific growth charts. Therefore, individuals for whom their recorded sex was different between their reception and year 6 measurements were removed from the analysis, leaving 2,588 children in the analytical sample. Thus, 61.8% of eligible records for children measured in reception 2016/17 - 2018/19 were matched to their measurement record in year 6.
Child body mass index classification
Defining overweight and obesity in children is more complex than in adults because children of different ages and sexes grow and develop at different rates. This means that a different method is used to calculate BMI in children than is used for adults.
A child’s BMI is calculated by dividing their weight (in kilograms) by the square of their height (in metres). However, unlike in adults, the BMI value is not used on its own. Instead, it is compared with the British 1990 (UK90) growth reference, a reference sample of measurements gathered in 1990. This comparison accounts for expected differences in growth by age and sex and produces a BMI centile, which indicates how a child’s BMI compares with that of children of the same age and sex in the reference population.
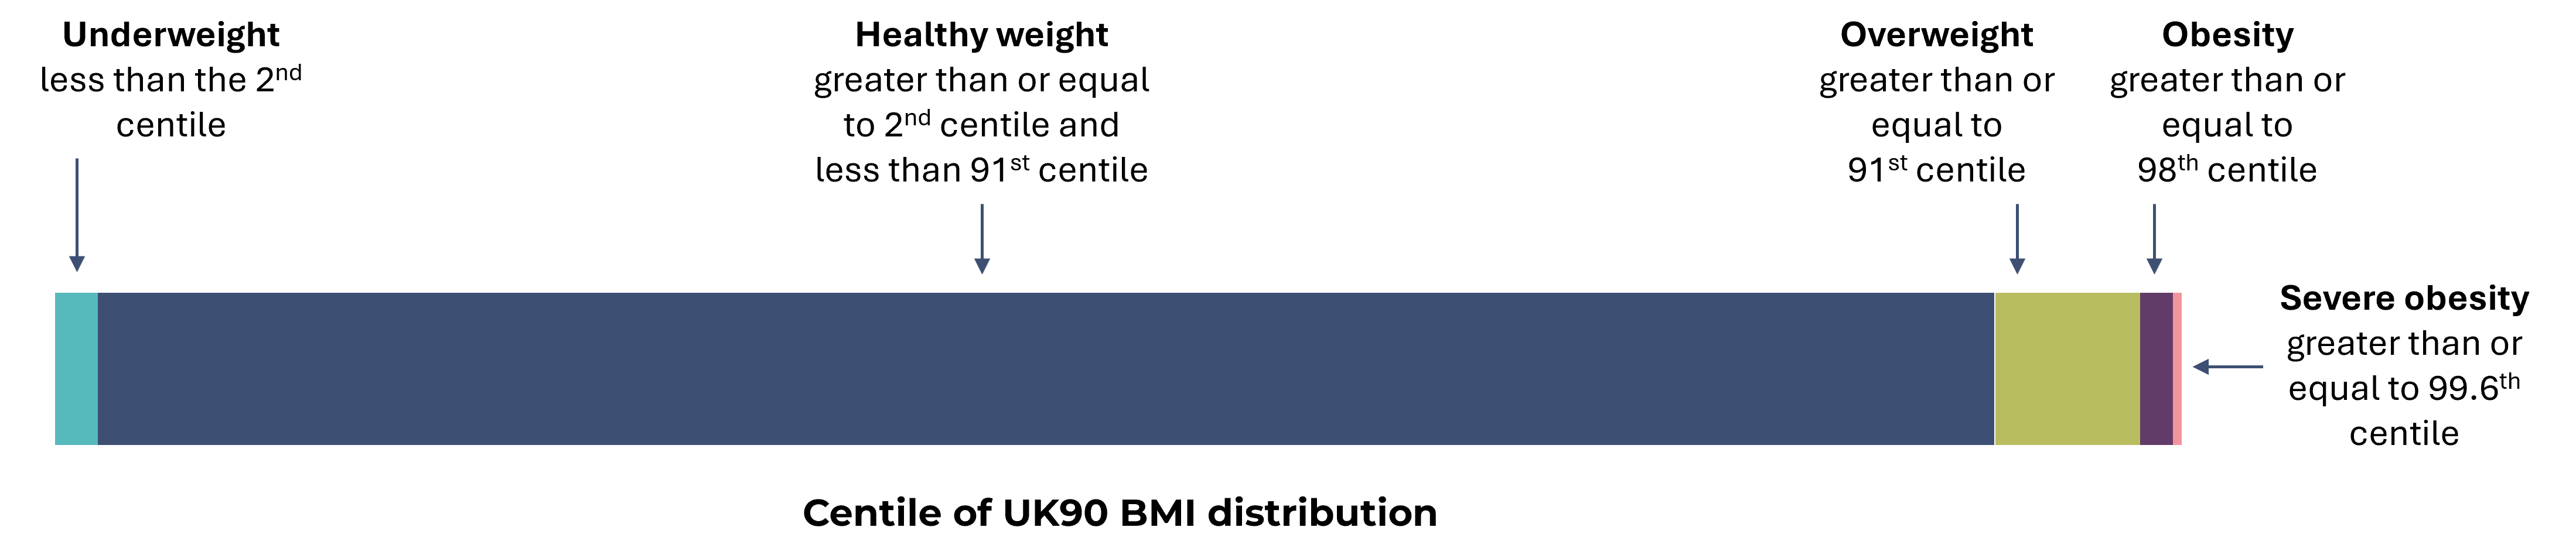
When reporting population prevalence using NCMP data, population monitoring thresholds (85th centile for overweight and 95th centile for obesity) based on the UK90 growth reference are typically used [3]. However, as this report follows individual children over time rather than describing population prevalence, clinical thresholds were used. Under these thresholds, BMI is classified as:
- underweight: less than the 2nd centile
- healthy weight: greater than or equal to the 2nd centile and less than the 91st centile
- overweight: greater than or equal to 91st centile
- obesity: greater than or equal to 98th centile
- severe obesity: greater than or equal to 99.6th centile.
Body mass index (BMI) clinical classification definitions
Deprivation
For analysis by deprivation, the Lower Super Output Area (LSOA) recorded in reception was used to assign the Index of Multiple Deprivation (IMD) 2019 quintile [4]. This ensured any interventions delivered in response to the child’s BMI category in reception were more likely to be allocated to the area where the child was living when the intervention took place.
Disclosure control
Values based on numerators equal to or less than seven have been suppressed, and all numerators and denominators have been rounded to the nearest five [5]. Prevalence rates were calculated using these rounded values [5]. Confidence intervals were calculated on the unrounded numerators and denominators [5]. Note that row/column totals will be calculated and then rounded, which means that the total of rounded values may differ from the rounded total [5]. Where counts are suppressed they won’t appear in the chart.
What the data shows
Changes from reception to year 6
In total, 61.8% (n=2,588) of reception measurement records were matched to a year 6 measurement record. Therefore, the matched records may be subject to selection bias.
Overall, nearly three quarters (73.4%; n=1,900) of children remained in their original weight category, while 21.4% (n=555) moved to a heigher weight category and 5.2% (n=135) moved to a lower weight category.
In Camden, the majority of children were a healthy weight in reception (84.6%; n=2,190), of which 78.3% (n=1,715) remained a healthy weight in year 6, while 19.9% (n=435) moved into a higher BMI category. Meanwhile, among the 13.5% (n=350) of children who were living with overweight or obesity in reception, the majority (78.9%; n=280) remained living with overweight or obesity in year 6, while 21.1% (n=75) moved to a healthy weight.
The Sankey diagram shows the change in BMI category for children from reception to year 6, with flows that are thicker and wider representing a larger number of children.
In Camden, a higher number of children moved from a healthy weight in reception to an unhealthy BMI category (underweight, overweight or living with obesity) in year 6 (18.3% of all children; n=475) than the number who moved from an unhealthy weight to a healthy weight between reception and year 6 (4.1% of all children; n=105). This is reflected in the higher prevalence of overweight and obesity in year 6.
Changes by sex
There are sex-based differences in how children move between weight categories from reception to year 6 in Camden. A significantly lower proportion of boys (75.2%; n=790) than girls (81.1%; n=925) who were a healthy weight in reception remained a healthy weight in year 6, while a significantly higher proportion of boys (23.3%; n=245) than girls (16.7%; n=190) moved from a healthy weight to living with overweight or obesity.
Changes by deprivation
There is a strong correlation between BMI category and deprivation, with a higher proportion of children in more deprived areas living with overweight or obesity than those in less deprived areas.
Data in this section is presented using the Index of Multiple Deprivation (IMD), a measure of relative deprivation for small areas. Areas have been divided into quintiles based on their deprivation rank, ranging from the most deprived (quintile 1) to the least deprived (quintile 5). Only data for the cohort of children who were a healthy weight in reception have been included in this section, due to small numbers of children in the other weight categories meaning confidence intervals were very wide. For this reason, we have also combined the overweight and obesity categories.
IMD quintile differed between reception and year 6 for 82.8% (n=2,143) of pupils. However, there was no significant difference in the overall distribution of children across deprivation quintiles between reception and year 6.
Compared with children who were a healthy weight in reception, a significantly lower proportion of children living in the most deprived quintile in reception (72.3%; n=430) remained a healthy weight in year 6 than those living in the least deprived quintile (94.1%; n=160) and a significantly higher proportion of children in the most deprived areas moved to a higher BMI category in year 6 (24.4%; n=145) compared to those in the least deprived areas (5.9%; n=10).
Callout-more-infoFurther reading
- Changes in BMI category of children between the first and final years of primary school in England, 2023 to 2024. This report presents analysis examining how primary school children have moved between body mass index (BMI) categories from reception (age 4 to 5 years) to year 6 (age 10 to 11 years) in England.
- National Child Measurement Programme Annual Report Camden 2024/25. An overview of National Child Measurement Programme (NCMP) data for children attending participating state-maintained schools in Camden during the 2024/25 academic year.
References
[1]
OHID. Obesity profile: Statistical commentary on patterns and trends in child height, February 2025 2025. https://www.gov.uk/government/statistics/obesity-profile-february-2025-update/obesity-profile-statistical-commentary-on-patterns-and-trends-in-child-height-february-2025 (accessed December 11, 2025).
[2]
Simmonds M, Llewellyn A, Owen CG, Woolacott N. Predicting adult obesity from childhood obesity: A systematic review and meta-analysis. Obes Rev 2016;17:95–107. https://doi.org/10.1111/obr.12334.
[3]
Cole TJ, Freeman JV, Preece MA. Body mass index reference curves for the UK, 1990. Arch Dis Child 1995;73:25–9. https://doi.org/10.1136/adc.73.1.25.
[4]
MHCLG. English indices of deprivation 2019 2019. https://www.gov.uk/government/statistics/english-indices-of-deprivation-2019 (accessed September 10, 2026).
[5]
NHS Digital. Changes to the National Child Measurement Programme 2019-20 publication content and disclosure control methodology 2023. https://digital.nhs.uk/data-and-information/find-data-and-publications/statement-of-administrative-sources/methodological-changes/changes-to-the-national-child-measurement-programme-2019-20-publication-content-and-disclosure-control-methodology (accessed December 10, 2025).