Why it matters
Excess body weight is associated with an increased risk of many health conditions - including type 2 diabetes, cardiovascular disease, stroke and several types of cancer - as well as increased morbidity and mortality [1]. It is also linked to poorer mental well-being and lower self-esteem.
Children living with obesity are much more likely to remain overweight or obese into adulthood than children who grow up at a healthy weight [1]. Therefore, increasing the proportion of healthy weight children is a key public health priority.
The National Child Measurement Programme (NCMP) involves annually measuring the height and weight of children in reception (aged 4-5 years) and year 6 (aged 10-11 years) in state-maintained primary schools across England, to assess overweight and obesity levels.
The main aims of the programme are to:
- inform local planning and delivery of services for children;
- gather population-level data to allow analysis of trends in growth patterns and obesity;
- increase public and professional understanding of weight issues in children; and
- be a vehicle for engaging with children and families about healthy lifestyles and weight issues.
This profile provides an overview of NCMP data for children attending participating state-maintained schools in Camden during the 2024/25 academic year.
What we did
Child body mass index classification
Defining overweight and obesity in children is more complex than in adults because children of different ages and sexes grow and develop at different rates. This means that a different method is used to calculate BMI in children than is used for adults.
A child’s BMI is calculated by dividing their weight (in kilograms) by the square of their height (in metres). Rather than using the BMI value alone, it is compared with the British 1990 (UK90) growth reference, a reference sample of measurements gathered in 1990. This comparison accounts for expected differences in growth by age and sex and produces a BMI centile, which indicates how a child’s BMI compares with that of children of the same age and sex in the reference population.
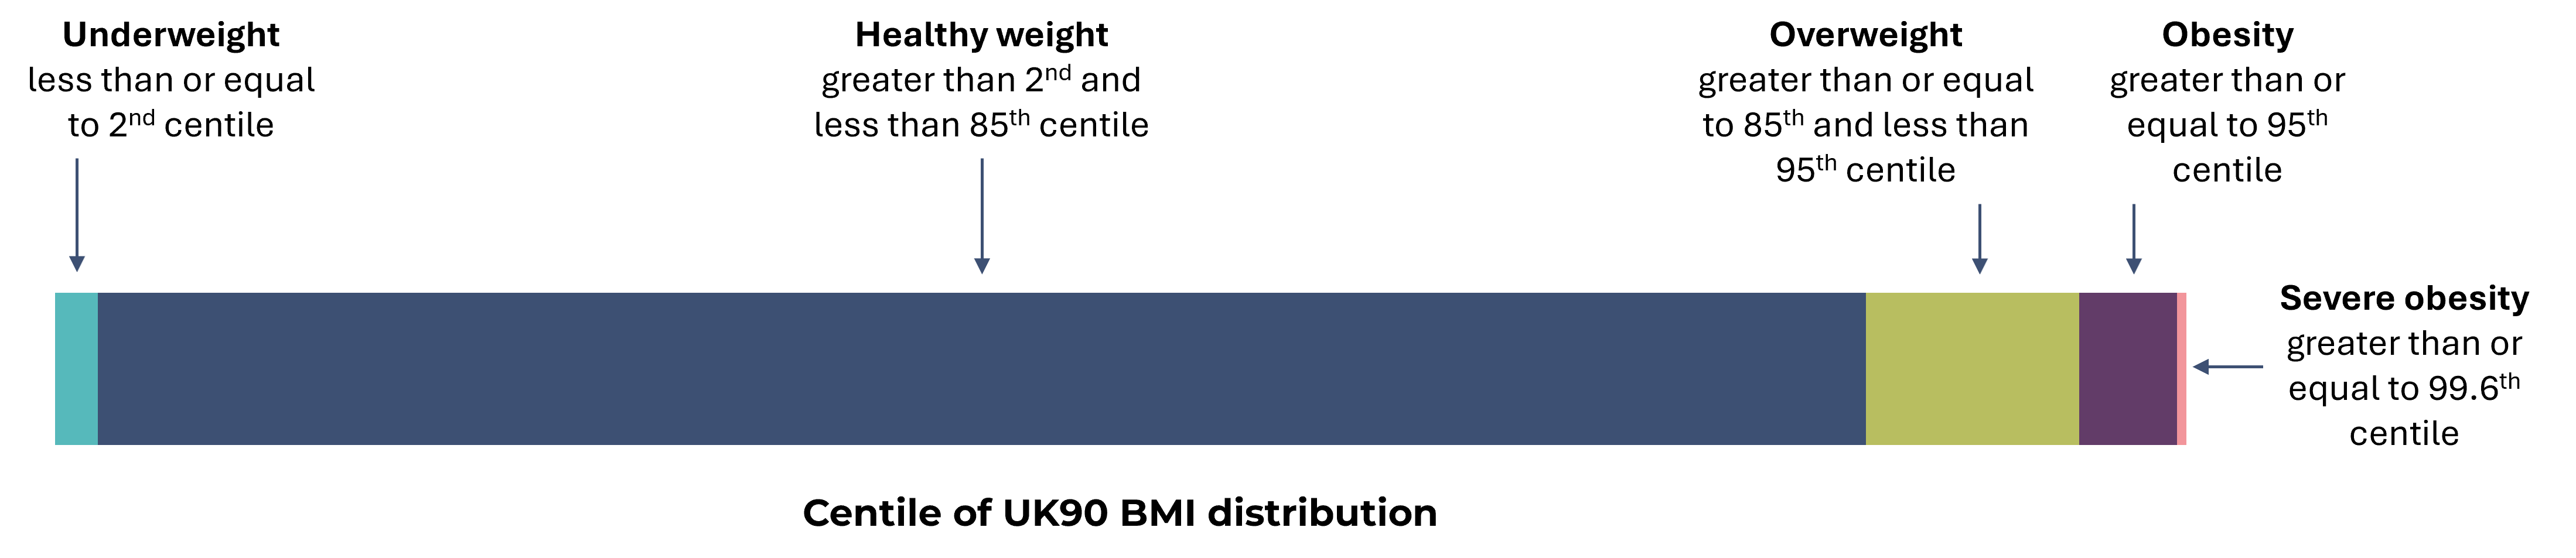
The NCMP uses the population monitoring cut-offs of the UK90 growth reference data to define the BMI categories [2]. These cut-offs are based on the assumption that around 15% of the baseline population were overweight, of which one third (5% of the total population) were living with obesity in 1990. The population monitoring cut-offs for overweight and obesity are lower than the clinical cut-offs (85th centile for overweight and 95th centile for obesity, rather than the clinical cut-offs of 91st and 98th centiles, respectively) used to assess individual children; this is to capture children in the population in the clinical overweight or obesity BMI categories plus those who are at high risk of moving into the clinical overweight or clinical obesity categories. This helps ensure that adequate services are planned and delivered for the whole population to treat and prevent obesity and promote healthy growth for all children.
Body mass index (BMI) population classification definitions
Population
This analysis refers to the data of children attending schools in Camden. Not all children included in the analyses live in the borough, while children who reside in Camden but do not attend a participating state-maintained school in the borough are not included. Therefore, the Camden averages in this data pack will differ slightly from those in Fingertips[3], which are based on all children residing in Camden, rather than those attending school in the borough. Deprivation and ward-level analyses are based on the postcode of the child’s home address which is mapped to Lower layer Super Output Area (LSOA) level. Only children residing in Camden are included in the ward-based analyses.
Prevalence estimates for London and England geographies were derived from the postcode of child residency and were sourced from Fingertips [3].
Calculation of participation rates
The participation rate is the percentage of children who have been measured in mainstream state-maintained schools out of those eligible for measurement (this excludes children who could not be measured due to physical or mental impairment). Children eligible for measurement are sometimes not measured due to a variety of reasons, such as the child being absent on the day of measurement or not consenting to be measured. This means that the NCMP dataset is a sample and the prevalence rates of the body mass index (BMI) categories in this report are estimates assumed to apply to the entire population in each age group.
Calculation of prevalence
The prevalence of children in a BMI category was calculated by dividing the number of children in that BMI category by the total number of children with a valid height and weight measured by the NCMP and multiplying the result by 100.
Confidence intervals
Error bars represent 95% confidence intervals, which have been calculated using the Wilson Score method [4]. When confidence intervals do not overlap the differences are said to be statistically significant.
Disclosure control
Any value based on a numerator equal to or less than seven has been suppressed, and all numerators and denominators of sub-national statistics have been rounded to the nearest five [5]. Prevalence rates for all sub-national geographies have been calculated using these rounded values [5]. Confidence intervals have been calculated on the unrounded numerators and denominators [5]. Note that row/column totals will be calculated and then rounded, which means that the total of rounded values may differ from the rounded total [5].
Impact of the COVID-19 pandemic on NCMP data collection
The NCMP data collection during the 2019/20 academic year stopped in March 2020 when schools closed due to the COVID-19 pandemic. In a usual NCMP collection year, national participation rates are around 95% of all eligible children, however in 2019/20 the number of children measured was around 75% of previous years, while in Camden, coverage was around 64% [6].
The start of the 2020/21 NCMP data collection was delayed due to the COVID-19 pandemic response. Local authorities were asked to collect a representative 10% sample of data which enabled the production of national and regional estimates of prevalence by BMI category. As the final sample was not fully representative of the child population, weighting was applied to the analysis to adjust for under or over representation of demographic and socioeconomic groups and make it comparable to previous years of NCMP data [7].
The 2021/22 NCMP was the first data collection since the COVID-19 pandemic that was unaffected by school closures and other public health measures.
What the data shows
Participation rate
In 2024/25, the participation rate for pupils attending school in Camden was 95.4%. This was a -0.8 percentage point change from 2023/24.
The most common reason for non-participation of eligible pupils in the latest year was parent opt out, accounting for 52.4% (n=55) of non-measurements, followed by child absence (38.1%; n=40).
In 2024/25, the participation rate for reception pupils attending school in Camden was 95.2%. This was a -1.5 percentage point change from 2023/24.
The most common reason for non-participation of eligible pupils in the latest year was parent opt out, accounting for 50% (n=25) of non-measurements, followed by child absence (40%; n=20).
In 2024/25, the participation rate for year 6 pupils attending school in Camden was 95.6%. This was a -0.5 percentage point change from 2023/24.
The most common reason for non-participation of eligible pupils in the latest year was parent opt out, accounting for 54.5% (n=30) of non-measurements, followed by child absence (36.4%; n=20).
Trends in prevalence
The charts in this section show patterns in prevalence over time by BMI category and school year. When interpreting the data, it is important to note the impact of the COVID-19 pandemic on NCMP data collection. As a result, data for Camden in the 2019/20 and 2020/21 academic years is less robust due to fewer measurements having taken place.
It is also important to note that prevalence estimates for London and England are based on the resident population. In contrast, Camden data is based on children attending schools in the borough.
Prevalence trends in reception
In the 2024/25 academic year, 1,095 (95.2%) reception aged children were measured at state-maintained schools in Camden as part of the NCMP collection.
Almost four in five children were a healthy weight (79.5%). However, 19.6% of children were living with overweight or obesity and 1.4% were underweight. There has been no significant change in the reception prevalence of underweight, healthy weight or overweight in recent years, while the trend in prevalence of obesity and severe obesity could not be calculated.
In 2024/25, the prevalence of underweight in reception in Camden was 1.4% (n=15). This proportion was similar to the London (1.8%) and England (1.1%) averages. There has been no significant change in the prevalence of underweight in Camden in recent years.
In 2024/25, 79.5% (n=870) of children in reception in Camden were a healthy weight. This proportion was similar to the London average (77.1%) and significantly higher than the England average (75.4%). There has been no significant change in the prevalence of healthy weight in Camden in recent years.
In 2024/25, the prevalence of overweight in reception in Camden was 9.6% (n=105). This proportion was similar to the London average (11.3%) and significantly lower than the England average (13%). There has been no significant change in the prevalence of overweight in Camden in recent years.
In 2024/25, the prevalence of obesity (including severe obesity) in reception in Camden was 9.6% (n=105). This proportion was similar to the London (9.8%) and England (10.5%) averages. The recent trend in Camden could not be calculated.
In 2024/25, the prevalence of severe obesity in reception in Camden was 2.7% (n=30). This proportion was similar to the London (3%) and England (2.9%) averages. The recent trend in Camden could not be calculated.
Prevalence trends in year 6
In the 2024/25 academic year, 1,200 (95.6%) year 6 children were measured at state-maintained schools in Camden as part of the NCMP collection.
Around two thirds of year 6 children were a healthy weight (65.4%), and this proportion has been increasing and getting better in recent years. However, 32.9% of children were living with overweight or obesity and 1.7% were underweight. In recent years, there has been no significant change in the year 6 prevalence of overweight, obesity or severe obesity, while the trend in prevalence of underweight could not be calculated due to insufficient data.
In 2024/25, the prevalence of underweight in year 6 in Camden was 1.7% (n=20). This proportion was similar to the London (2.2%) and England (1.6%) averages. The recent trend in Camden could not be calculated.
In 2024/25, 65.4% (n=785) of children in year 6 in Camden were a healthy weight. This proportion was significantly higher than the London (60.5%) and England (62.2%) averages. The prevalence of healthy weight has been increasing in Camden in recent years.
In 2024/25, the prevalence of overweight in year 6 in Camden was 11.7% (n=140). This proportion was significantly lower than the London (14%) and England (13.9%) averages. There has been no significant change in the prevalence of overweight in Camden in recent years.
In 2024/25, the prevalence of obesity (including severe obesity) in year 6 in Camden was 20.8% (n=250). This proportion was similar to the London (23.2%) and England (22.2%) averages. There has been no significant change in the prevalence of obesity (including severe obesity) in Camden in recent years.
In 2024/25, the prevalence of severe obesity in year 6 in Camden was 5.8% (n=70). This proportion was similar to the London (6%) and England (5.6%) averages. There has been no significant change in the prevalence of severe obesity in Camden in recent years.
School year
There is considerable variation in children’s weight status by school year, with the proportion of children living with obesity or severe obesity more than doubling between reception and year 6.
In Camden, a significantly higher proportion of children were a healthy weight in reception (79.5%) than in year 6 (65.4%) in 2024/25.
A similar proportion of children were underweight in reception (1.4%) and year 6 (1.7%). The prevalence of overweight was also similar between reception and year 6 (9.6% and 11.7%, respectively). However, obesity and severe obesity were significantly more prevalent in year 6, with rates of 15.4% and 5.8%, respectively, compared with 7.3% and 2.7% in reception.
Sex
Both regionally and nationally, there are sex-based differences in the distribution of children’s weight status, with girls more likely to be a healthy weight compared to boys [3].
In reception, in 2024/25, the prevalence of overweight (including obesity) was similar in boys (18.3%) compared to girls (19.8%).
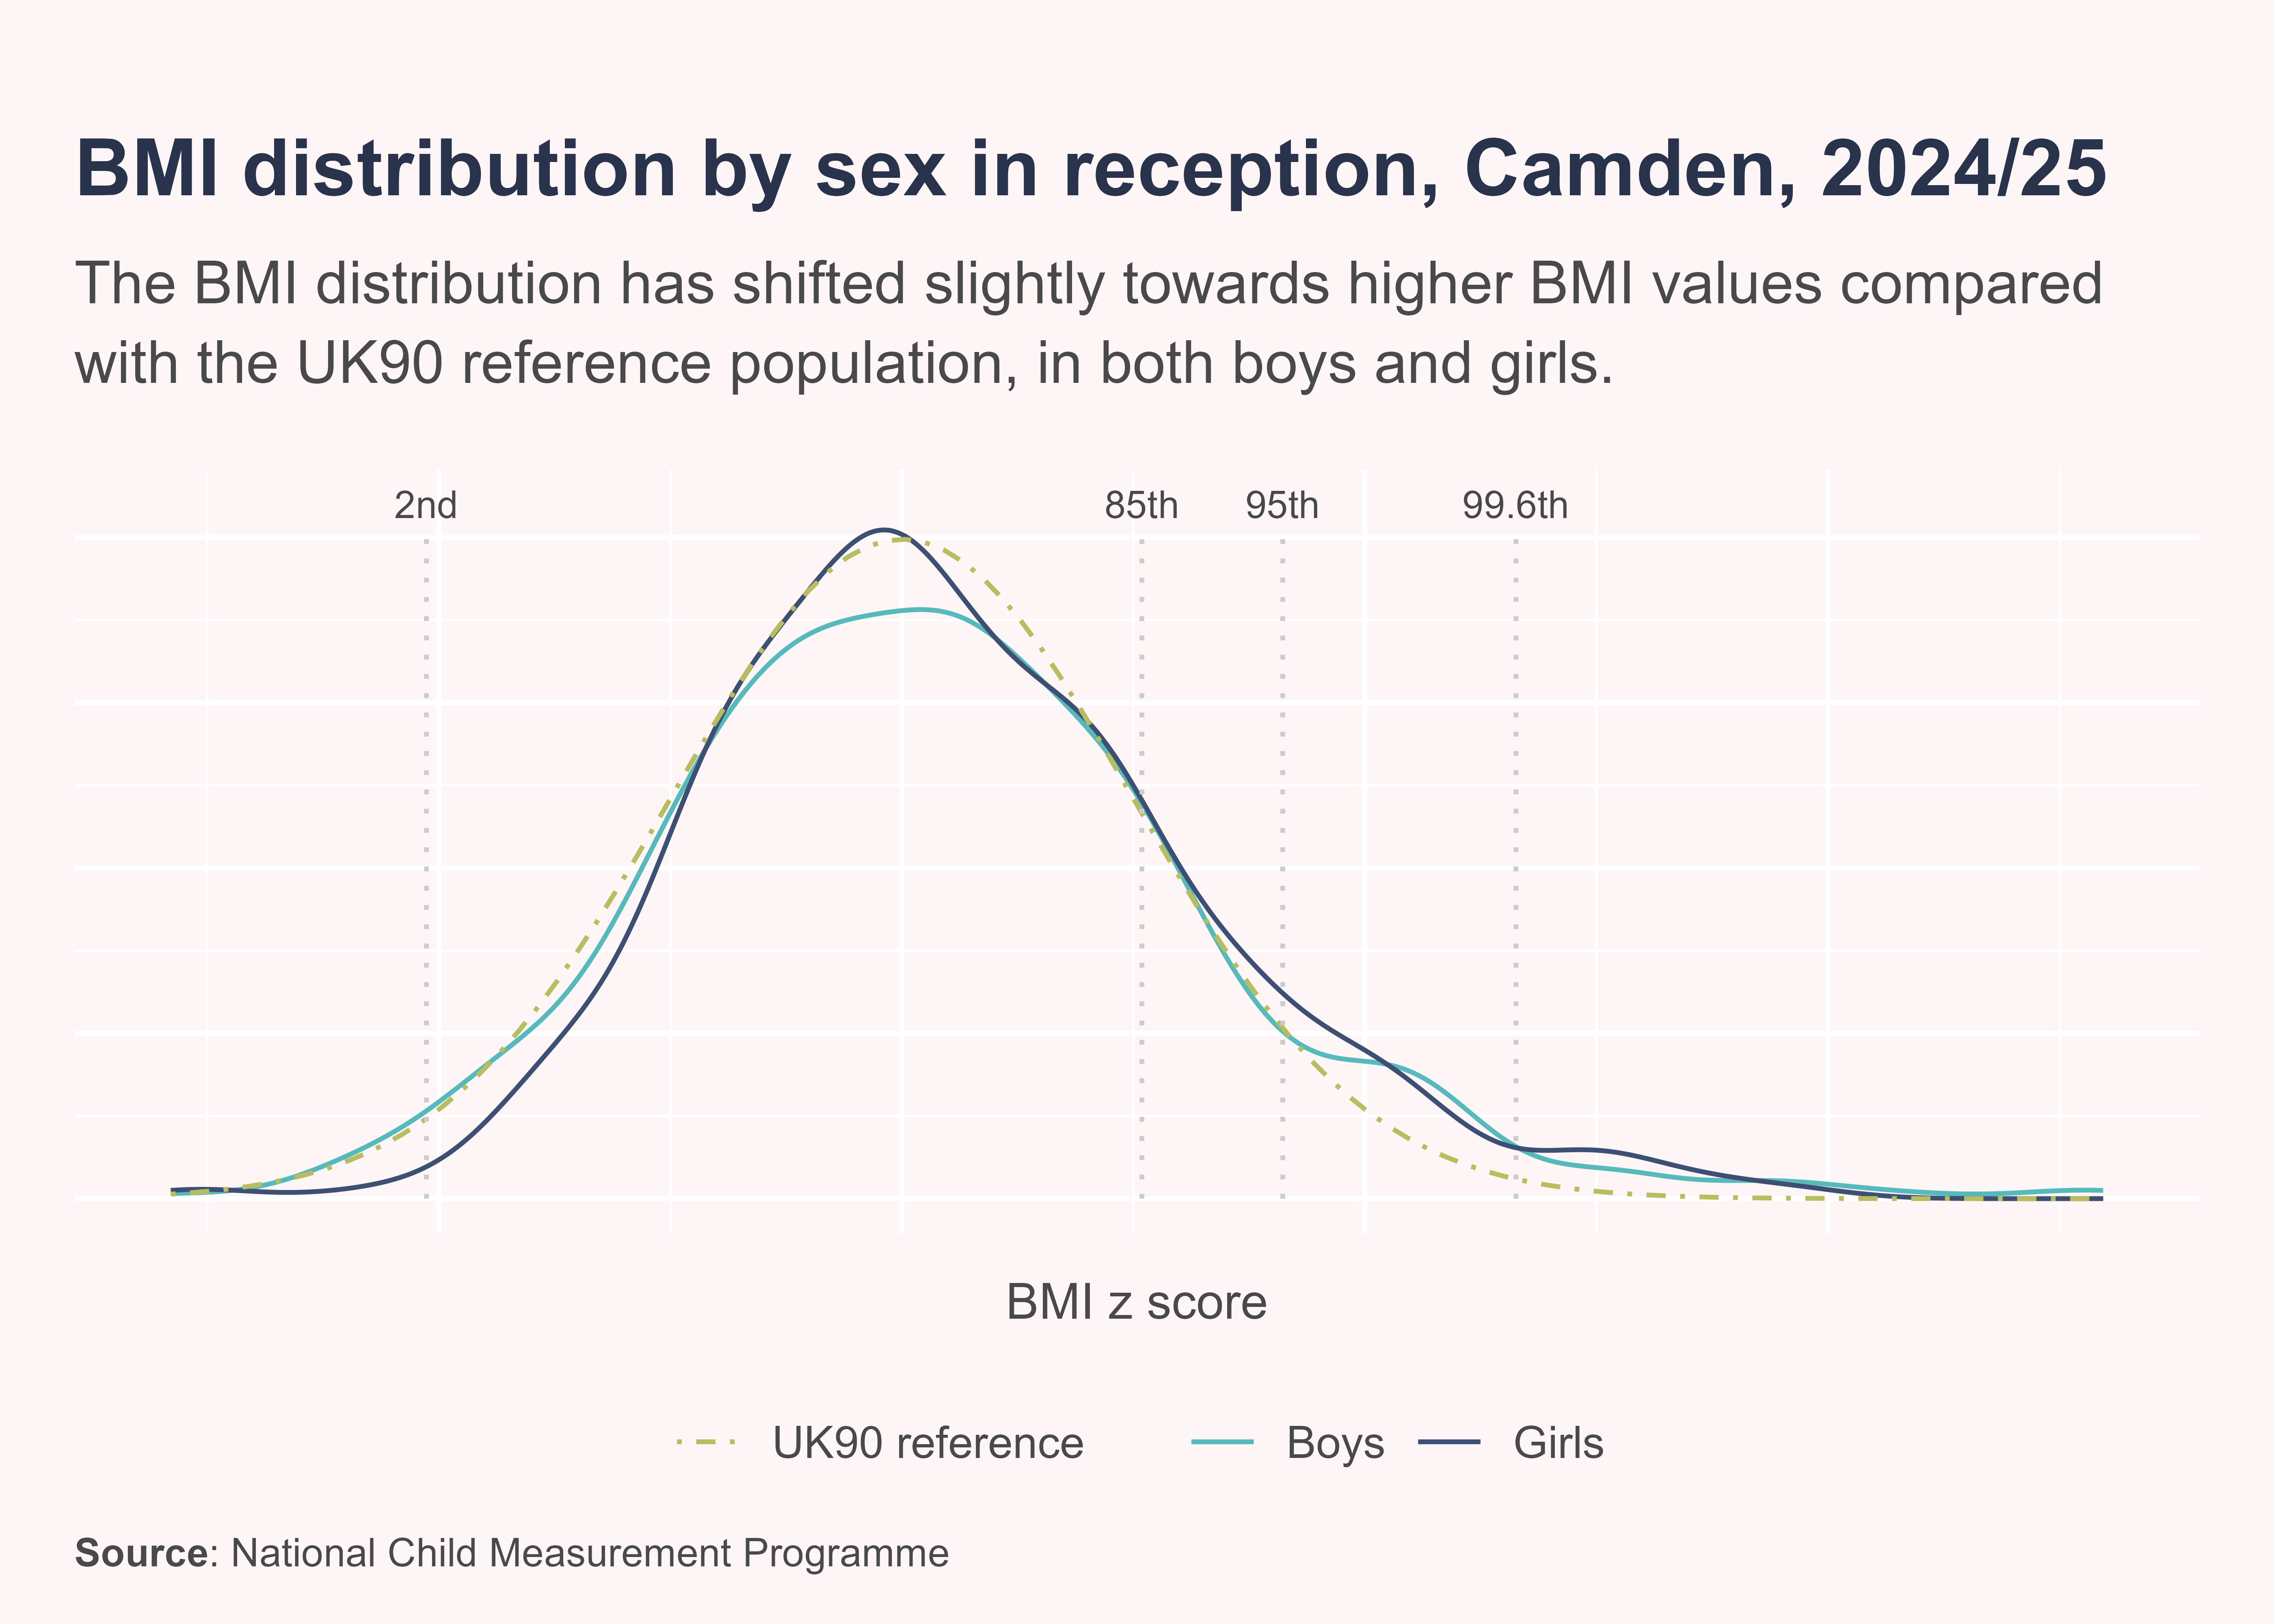
In Camden, for both reception boys and girls, the distribution of BMI z scores compared to the British 1990 (UK90) growth reference baseline has shifted slightly to the right, indicating increases in BMI. The mean BMI centile has increased among reception children from the 50th centile in the UK90 reference population to 53rd centile for boys and 55th centile for girls in 2024/25.
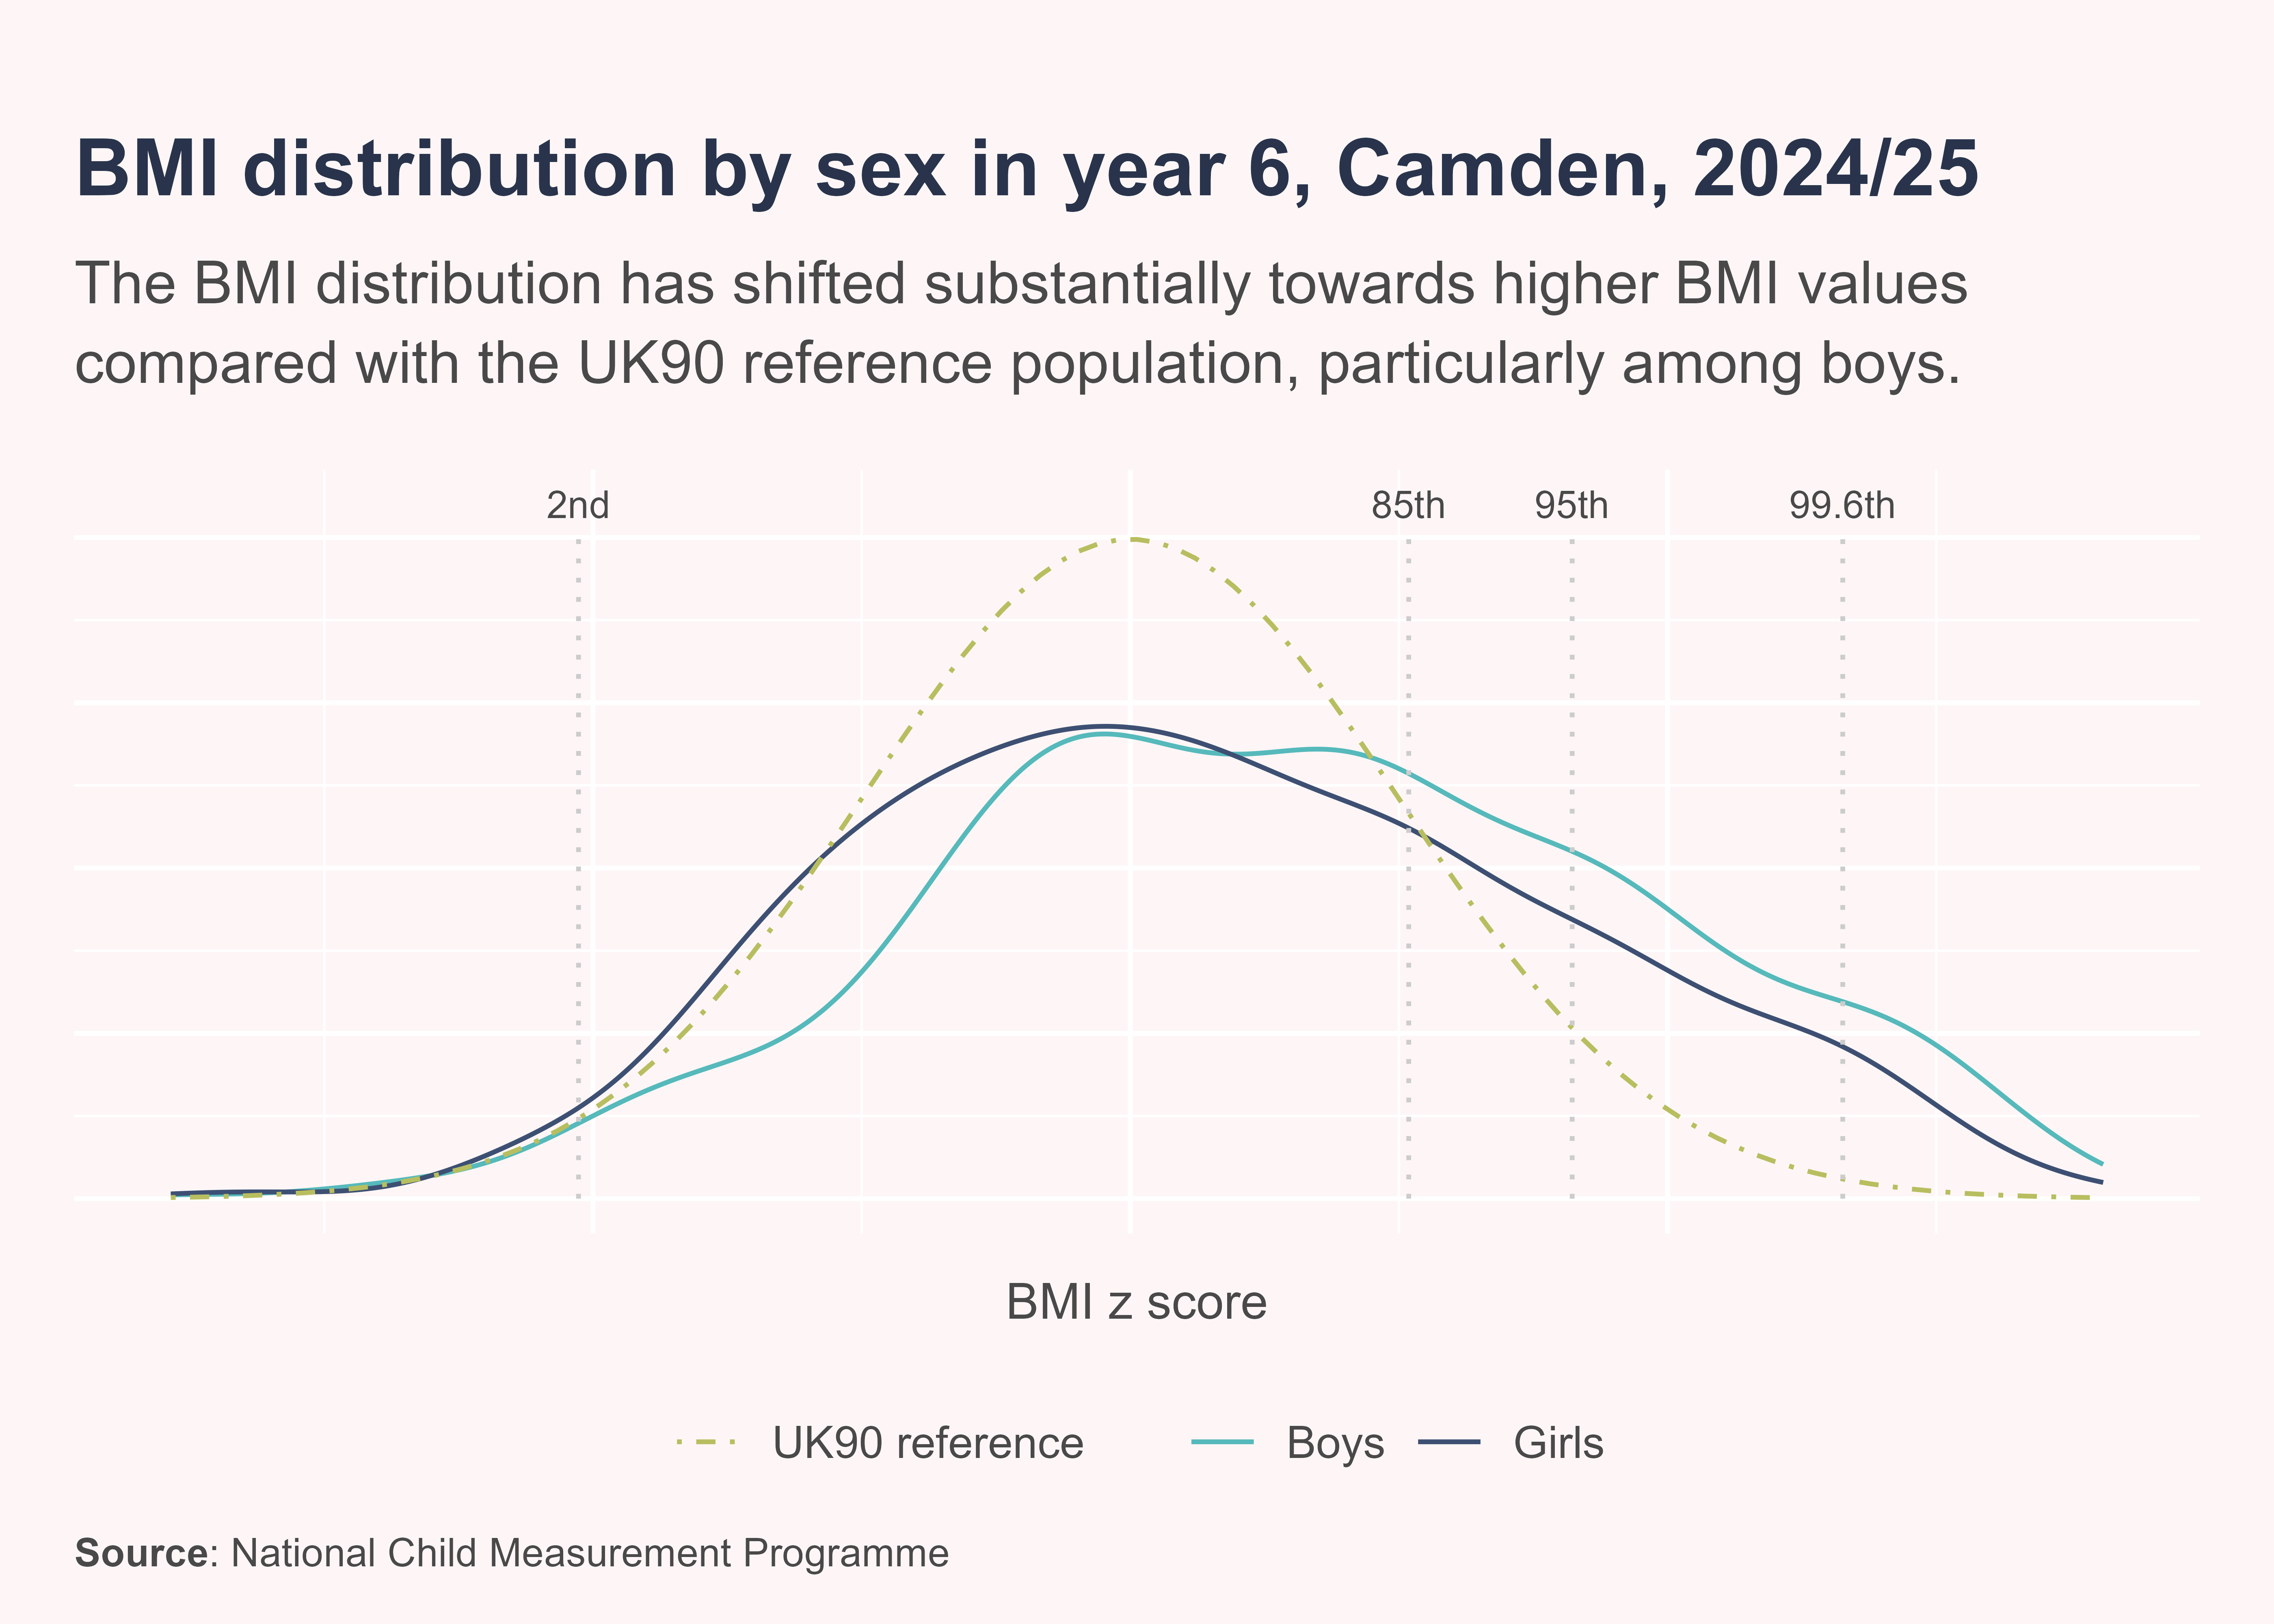
In year 6, in 2024/25, the prevalence of overweight (including obesity) was significantly higher in boys (36.4%) compared to girls (28.7%).
In Camden, the distribution of BMI z scores among year 6 children has shifted considerably to the right since the 1990 baseline, meaning a higher proportion of children have higher BMI values. The BMI distribution for boys appears more skewed to the right than the distribution for girls, with a higher proportion of boys having a BMI over the 85th centile. The mean BMI centile has increased among year 6 children from the 50th centile in the UK90 reference population to the 64th centile for boys and 56th centile for girls in 2024/25.
Deprivation
There is a strong association between overweight and level of deprivation, with children living in more deprived areas experiencing a higher prevalence of overweight and obesity than those living in less deprived areas.
In this section, deprivation is measured using the Index of Multiple Deprivation (IMD) quintile assigned to the postcode of the child’s home address. Quintile 1 represents the most deprived areas, while quintile 5 represents the least deprived.
Between 2022/23-24/25, the reception prevalence of overweight (including obesity) was significantly higher in children living in the most deprived quintile compared with children living in the least deprived quintile (20.4% vs 13.1%).
Between 2022/23-24/25, the year 6 prevalence of overweight (including obesity) was significantly higher in children living in the most deprived quintile compared with children living in the least deprived quintile (39.5% vs 16.9%).
Ward
There is variation in the prevalence of overweight and obesity by ward. These differences are closely linked to patterns of deprivation and other wider determinants.
Ward-level analyses are based on the postcode of the child’s home address.
Between 2022/23-24/25, the reception prevalence of overweight (including obesity) was highest among children living in Kilburn (26.5%), Haverstock (24.5%) and South Hampstead (24%).
Between 2022/23-24/25, the year 6 prevalence of overweight (including obesity) was highest among children living in Holborn & Covent Garden (44.1%), Kilburn (43.2%) and Regent’s Park (42.2%).
Neighbourhood
Camden is divided into five neighbourhoods, each made up of wards.
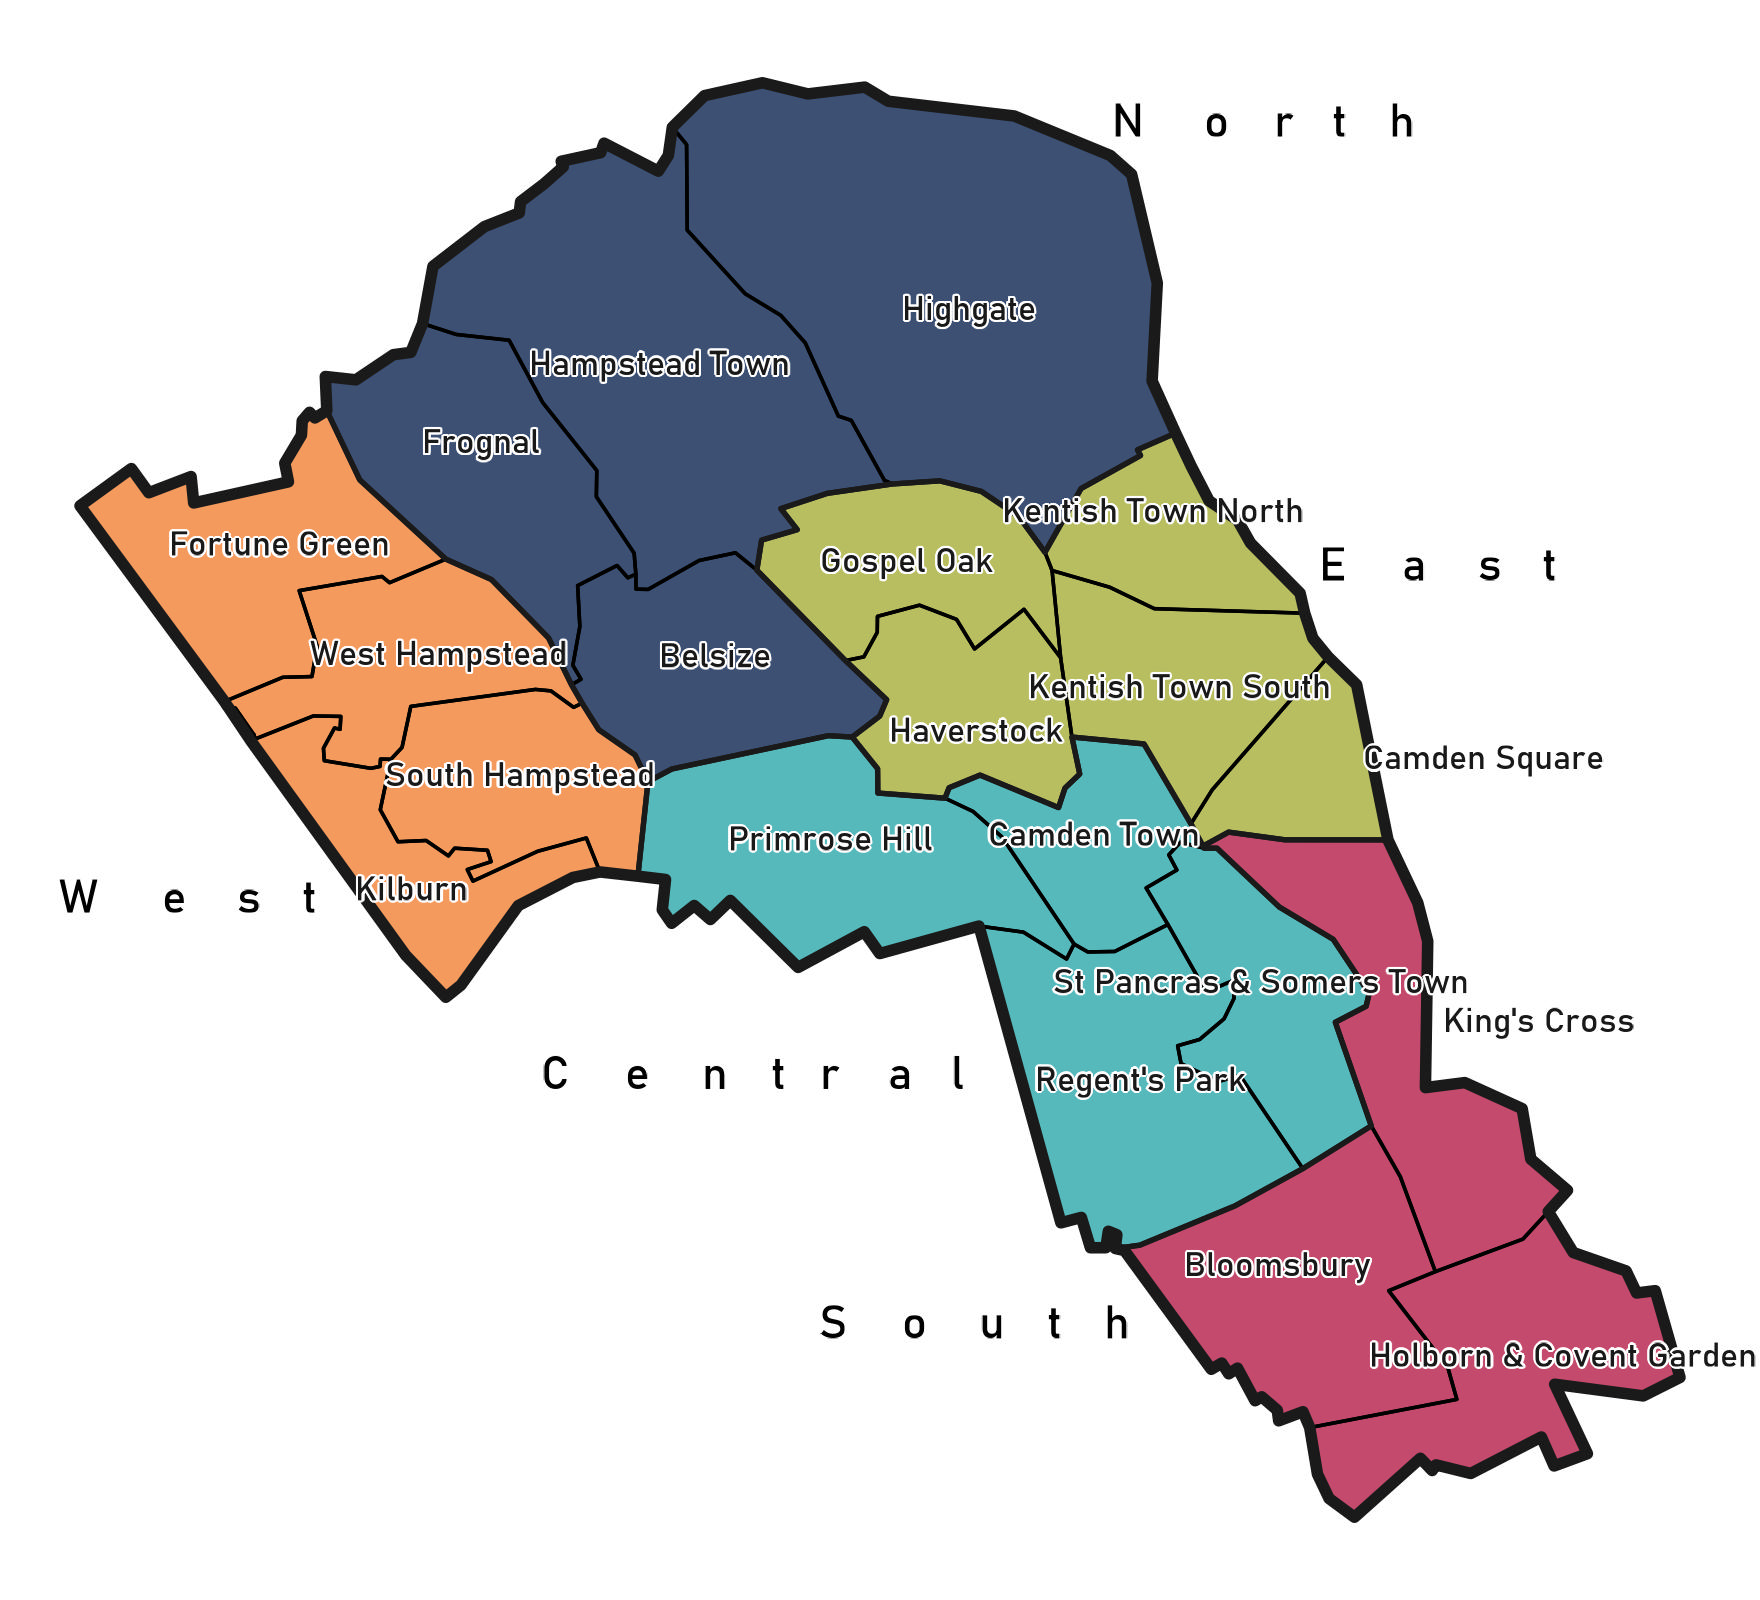
Between 2022/23-24/25, the reception prevalence of overweight (including obesity) was highest among children living in the West (22.4%), Central (18.6%) and East (18.6%) neighbourhoods. However, there was no significant difference in prevalence between neighbourhoods.
Between 2022/23-24/25, the year 6 prevalence of overweight (including obesity) was highest among children living in the Central (39.6%), South (38.8%) and East (36.5%) neighbourhoods. The Central, South, East and West neighbourhoods all have a significantly higher prevalence of overweight than the North neighbourhood, which is the least deprived neighbourhood in Camden.
Appendices
Appendix 1: Schools overview
School-level analyses are based on the postcode of the school the child attends which is then mapped to a neighbourhood.
Appendix 2: Child height
Although around 80% of the variation in human height is attributed to genetic factors, environmental factors also play a crucial role, particularly exposures occurring during critical periods of development [8]. Such factors include maternal smoking during pregnancy, passive smoke exposure, maternal overweight or obesity, diet and nutrition, living conditions, childhood diseases and psychological stress [8].
At a population level, these environmental factors have a key modifiable role in child growth, therefore, changes in child height and growth patterns in a population may indicate an improvement or worsening of the wider social or economic environment [8].
As children are growing continuously, it is important to ensure any observed changes in average height are not due to children being measured earlier or later in the academic year. For this reason, height estimates have been standardised to represent the height of a child aged exactly 5 years and 0 days for reception year, and exactly 11 years and 0 days for year 6.
In the 2024/25 academic year, boys were on average taller than girls at age 5 years in Camden, with a mean height of 110.4 cm compared to 108.8 cm.
In the 2024/25 academic year, girls were on average taller than boys at age 11 years in Camden, with a mean height of 147.4 cm compared to 146.9 cm.
Callout-more-infoFurther reading
- National Child Measurement Programme (NCMP) annual report, academic year 2024 to 2025, England. This report presents the findings from the 2024/25 NCMP showing the latest patterns and trends in child body mass index (BMI) category for children in reception and year 6.
- Analysis of changes in body mass index category between the first and final years of primary school in Camden. This report explores how individual children’s BMI category changed between their NCMP measurements in reception and year 6, for those attending state-maintained schools in Camden.
References
[1]
Simmonds M, Llewellyn A, Owen CG, Woolacott N. Predicting adult obesity from childhood obesity: A systematic review and meta-analysis. Obes Rev 2016;17:95–107. https://doi.org/10.1111/obr.12334.
[2]
Cole TJ, Freeman JV, Preece MA. Body mass index reference curves for the UK, 1990. Arch Dis Child 1995;73:25–9. https://doi.org/10.1136/adc.73.1.25.
[3]
OHID. Obesity, physical activity and nutrition - Data Fingertips Department of Health and Social Care 2025. https://fingertips.phe.org.uk/profile/obesity-physical-activity-nutrition/data#page/1 (accessed January 7, 2026).
[4]
[5]
NHS Digital. Changes to the National Child Measurement Programme 2019-20 publication content and disclosure control methodology 2023. https://digital.nhs.uk/data-and-information/find-data-and-publications/statement-of-administrative-sources/methodological-changes/changes-to-the-national-child-measurement-programme-2019-20-publication-content-and-disclosure-control-methodology (accessed December 10, 2025).
[6]
NHS Digital. National Child Measurement Programme, England 2019/20 School Year 2020. https://digital.nhs.uk/data-and-information/publications/statistical/national-child-measurement-programme/2019-20-school-year (accessed November 13, 2025).
[7]
NHS Digital. National Child Measurement Programme, England 2020/21 School Year 2021. https://digital.nhs.uk/data-and-information/publications/statistical/national-child-measurement-programme/2020-21-school-year (accessed November 13, 2025).
[8]
OHID. Obesity profile: Statistical commentary on patterns and trends in child height, February 2025 2025. https://www.gov.uk/government/statistics/obesity-profile-february-2025-update/obesity-profile-statistical-commentary-on-patterns-and-trends-in-child-height-february-2025 (accessed December 11, 2025).