Introduction
Long-term conditions (LTCs) are broadly defined as conditions that require ongoing management and that generally cannot currently be cured but can be controlled with medication and therapies. Examples include diabetes, cancer, arthritis, asthma, heart disease, dementia, and mental health conditions [1]. Estimates suggest approximately 41% of adults in England, around 20 million people, are living with at least one LTC, and they are more common in people over the age of 65 years and those living in more deprived areas [2,3].
[1]
NICE. Multimorbidity: What is multimorbidity? 2023.
[3]
NHS England. Health Survey for England, 2022 Part 2 2024.
[5]
NICE. Multimorbidity: How common is it? 2023.
[6]
Kingston A, Robinson L, Booth H, Knapp M, Jagger C, for the MODEM project. Projections of multi-morbidity in the older population in England to 2035: Estimates from the Population Ageing and Care Simulation (PACSim) model. Age and Ageing 2018;47:374–80. https://doi.org/10.1093/ageing/afx201.
The prevalence of multiple (two or more) long-term conditions (MLTCs), also termed multimorbidity is rising, affecting around one in four of the adult population in England (14.2 million people) [4]. As life expectancy continues to increase, more people are reaching middle and older ages where the risk of developing LTCs significantly increases [5]. Consequently, the prevalence of LTCs, particularly MLTCs, is predicted to continue to increase [6].
This health profile provides an overview of the literature on the impact of LTCs as well as the causes and risk factors that contribute to their development and progression. It highlights data from Camden, to offer insight into how LTCs impact the borough’s population.
Why it matters
Health impact
The rising prevalence of LTCs has significant implications for health outcomes and the overall quality of life for those affected. Individuals living with LTCs often experience a progressive decline in health, with certain LTCs increasing the risk of developing other health conditions, creating a cycle of worsening health over time [7]. This accumulation of health issues often results in complex and compounded health challenges, with patients facing a higher risk of poorer health outcomes including lower healthy life expectancy, mental health conditions, disability, frailty and premature mortality [8,9].
[8]
NIHR. Making sense of the evidence: Multiple long-term conditions (multimorbidity). 2021. https://doi.org/10.3310/collection_45881.
[9]
Nunes BP, Flores TR, Mielke GI, Thumé E, Facchini LA. Multimorbidity and mortality in older adults: A systematic review and meta-analysis. Archives of Gerontology and Geriatrics 2016;67:130–8. https://doi.org/10.1016/j.archger.2016.07.008.
[11]
Richmond Group of Charities. One in four: A manifesto for people with multiple health conditions. 2023.
[12]
NICE. Multimorbidity: What are the complications? 2023.
As conditions evolve, their complexity and severity become harder to manage, placing a growing burden on individuals, their carers, and healthcare services [7,10,11]. The physical challenges of pain, fatigue, and mobility loss are often paired with mental health difficulties including anxiety and depression, which can impact individuals’ ability to manage their conditions, collectively resulting in lower quality of life [7,12,13].
Managing MLTCs also involves practical challenges in co-ordinating multiple healthcare interactions and managing complex medication regimes, alongside adapting to lifestyle changes like reduced mobility, shrinking social networks, loss of ability to engage with work and loss of independence [7,10]. This combination of challenges results in individuals feeling ‘burnt out’ from the self-management of tasks required to manage their health, further impacting their quality of life [7,13].
[7]
Holland E, Matthews K, Macdonald S, Ashworth M, Laidlaw L, Cheung KSY, et al. The impact of living with multiple long-term conditions (multimorbidity) on everyday life – a qualitative evidence synthesis. BMC Public Health 2024;24:3446. https://doi.org/10.1186/s12889-024-20763-8.
[10]
Richmond Group of Charities. Multimorbidity: Understanding the challenge. 2018.
[13]
Steell L, Krauth SJ, Ahmed S, Dibben GO, McIntosh E, Hanlon P, et al. Multimorbidity clusters and their associations with health-related quality of life in two UK cohorts. BMC Medicine 2025;23:1. https://doi.org/10.1186/s12916-024-03811-3.
System impact
The increasing number of people living with MLTCs presents an ever-increasing challenge for the healthcare system. People with MLTCs are more likely to have complex care needs, translating to increased healthcare costs and utilisation [14]. People living with MLTCs account for around 50% of hospital admissions, outpatient visits and primary care consultations. This is also linked to higher spending across the health system, with over 55% of NHS costs and over 75% of the costs of primary care prescriptions being for people with MLTCs [4].
[14]
Soley-Bori M, Ashworth M, Bisquera A, Dodhia H, Lynch R, Wang Y, et al. Impact of multimorbidity on healthcare costs and utilisation: A systematic review of the UK literature. British Journal of General Practice 2021;71:e39. https://doi.org/10.3399/bjgp20X713897.
[17]
Salisbury C, Johnson L, Purdy S, Valderas JM, Montgomery AA. Epidemiology and impact of multimorbidity in primary care: A retrospective cohort study. The British Journal of General Practice: The Journal of the Royal College of General Practitioners 2011;61:e12–21. https://doi.org/10.3399/bjgp11X548929.
[18]
NIHR Applied Research Collaboration West. Improving review appointments for people with long-term conditions. 2024.
The healthcare system is often organised around single conditions, and individuals with MLTCs may be on multiple clinical pathways with little continuity, increasing the risk of uncoordinated and fragmented care with poorer health outcomes [15–17]. There is evidence that highly personalised, integrated and well-coordinated care provides a better patient experience for people experiencing complex health issues and is also more fulfilling for clinicians [18].
Financial impacts of MLTCs on the healthcare system are also significant, as highlighted in the NHS Long Term Plan [19]. The Health Foundation predicts that NHS funding would need to rise by around 3.5% per year through to 2030-31 to meet expected demand [20].
[19]
NHS England. NHS Long Term Plan. 2019.
[20]
The Health Foundation. Health and social care funding projections 2021. 2021.
Wider economic impact
The impact of LTCs also extends to the wider economy, particularly the rise in LTC prevalence among the working age population, leading to increasing pressures on public finances, employers and individuals [21,22].
[22]
The Health Foundation. What we know about the UK’s working-age health challenge. 2023.
People with LTCs are more likely to leave the workforce prematurely or reduce their working hours due to health limitations [22]. Long-term ill-health is the most common reason for being economically inactive, accounting for 2.5 million people in the UK. Around 3.7 million working-age people have a health condition that is ‘work-limiting’, meaning it limits the type or amount of work they can do [22].
In 2023, the economic costs of lost output for UK employers due to illness among working age people were estimated to be around £150 billion per year through lost productivity, sickness absence and recruitment costs, with an additional total cost to the government of around £70 billion in lost tax income, benefits payments and costs to the NHS [21]. The declining health of the working-age population is not slowing, with a projected 17% rise in the proportion of people aged 20–69 years living with major illness by 2040. This has significant implications for the nation’s future economic activity, productivity and wellbeing [23].
Causes and risk factors
Age
The prevalence of LTCs is strongly associated with age. The likelihood of having a LTC increases with age, becoming almost universal in older adults. Around 60% of people aged 55 to 64 years and 80% of people aged over 85 years live with at least one LTC [21]. The proportion of the population aged over 65 years is rapidly increasing, with predictions suggesting that between 2020 and 2035, the population of over 65s will increase by 3 million [21]. At the same time, life expectancy is projected to rise by 1.4 years on average between 2019 and 2040 [23]. Although people are living longer, the average age people are expected to be living with a major illness is anticipated to remain constant at 70 years [23]. As a result, more people will be spending a greater proportion of their later lives in ill-health [24].
[23]
The Health Foundation. Health in 2040: Projected patterns of illness in England. 2023.
[24]
Centre for Ageing Better. The State of Ageing 2025. 2025.
Deprivation
There is a clear graded relationship between the risk of developing MLTCs and socio-economic deprivation [4,25]. Individuals with the lowest incomes are four times more likely to have MLTCs than those with the highest incomes [26]. In England, 28% of people aged 65-74 years living in the most deprived areas have four or more health conditions, compared to 16% in the least deprived areas [27]. Furthermore, MLTCs occur 10-15 years earlier in people living in the most deprived areas compared to those in the least deprived areas, often involving more complex combinations of physical and mental health conditions [2].
[4]
The Health Foundation. Briefing: Understanding the health care needs of people with multiple health conditions. 2018.
[25]
Pathirana TI, Jackson CA. Socioeconomic status and multimorbidity: A systematic review and meta-analysis. Australian and New Zealand Journal of Public Health 2018;42:186–94. https://doi.org/10.1111/1753-6405.12762.
[26]
Ingram E, Ledden S, Beardon S, Gomes M, Hogarth S, McDonald H, et al. Household and area-level social determinants of multimorbidity: A systematic review. Journal of Epidemiology and Community Health 2021;75:232–41. https://doi.org/10.1136/jech-2020-214691.
[27]
Richmond Group of Charities. "Just one thing after another": Living with multiple conditions. 2018.
[2]
Barnett K, Mercer SW, Norbury M, Watt G, Wyke S, Guthrie B. Epidemiology of multimorbidity and implications for health care, research, and medical education: A cross-sectional study. Lancet (London, England) 2012;380:37–43. https://doi.org/10.1016/S0140-6736(12)60240-2.
Ethnicity
Evidence points to the existence of ethnic inequalities in the prevalence of MLTCs, with people from Indian, Pakistani, Bangladeshi, Black African and Black Caribbean communities at higher risk of developing MLTCs, often at a younger age [28]. People from Pakistani and Bangladeshi ethnic backgrounds have more diagnosed chronic pain, diabetes, dementia and cardiovascular disease (CVD), while the White population have more diagnosed anxiety, depression, atrial fibrillation and cancer [29].
[28]
Hayanga B, Stafford M, Bécares L. Ethnic inequalities in multiple long-term health conditions in the United Kingdom: A systematic review and narrative synthesis. BMC Public Health 2023;23:178. https://doi.org/10.1186/s12889-022-14940-w.
[29]
The Health Foundation. Quantifying health inequalities in England. 2022.
Severe mental illness
Mental health conditions are both risk factors for and consequences of long-term physical health conditions. Individuals with severe mental illnesses (SMI) have higher rates of MLTCs, particularly CVD, diabetes, obesity and lung conditions, compared to the general population. This disparity is particularly pronounced in young people aged 15-34 years with SMI, who are five times more likely to have three or more physical conditions than their peers [30]. People with SMI also have higher rates of premature mortality, dying on average 15-20 years earlier than the general population [31]. The reasons for poorer health among people with SMI are complex but may include medication side effects, stigma, reduced physical activity and poorer self-care [30]. The interaction between SMI and physical health symptoms adds to the burden of mental illness, creating a cycle of deterioration and increasing their complexity of care [32].
[30]
Public Health England. Health matters: Reducing health inequalities in mental illness. 2018.
[31]
Public Health England. Severe mental illness (SMI) and physical health inequalities: Briefing. 2018.
[32]
Carswell C, Brown JVE, Lister J, Ajjan RA, Alderson SL, Balogun-Katung A, et al. The lived experience of severe mental illness and long-term conditions: A qualitative exploration of service user, carer, and healthcare professional perspectives on self-managing co-existing mental and physical conditions. BMC Psychiatry 2022;22:479. https://doi.org/10.1186/s12888-022-04117-5.
Lifestyle
A range of lifestyle factors including smoking, excessive alcohol intake, physical inactivity and poor diet have been associated with the development of MLTCs [33]. Smoking is associated with multiple health conditions including heart disease, stroke, cardiac failure, chronic obstructive pulmonary disease (COPD), asthma, dementia and several cancers [34]. Long-term excessive alcohol intake contributes to the development of liver disease, CVD cancers and mental illness [35]. Overweight and obesity are risk factors throughout the life course and can increase the risk of developing or exacerbating several chronic conditions including diabetes, heart disease, stroke, dementia, joint and back problems [36].
[33]
Katikireddi SV, Skivington K, Leyland AH, Hunt K, Mercer SW. The contribution of risk factors to socioeconomic inequalities in multimorbidity across the lifecourse: A longitudinal analysis of the Twenty-07 cohort. BMC Medicine 2017;15:152. https://doi.org/10.1186/s12916-017-0913-6.
[34]
NICE. Alcohol - problem drinking: What are the complications? 2025.
[35]
NICE. Harms caused by smoking 2025.
[36]
NICE. Obesity: What are the complications? n.d.
Gender
Across all age groups, women are more likely to develop MLTCs than men, particularly including hypertension and depression. This is mainly driven by a higher prevalence of combined physical and mental MLTCs in women than in men [37].
[37]
Agur K, McLean G, Hunt K, Guthrie B, Mercer SW. How Does Sex Influence Multimorbidity? Secondary Analysis of a Large Nationally Representative Dataset. International Journal of Environmental Research and Public Health 2016;13:391. https://doi.org/10.3390/ijerph13040391.
What the data shows
Morbidity
Prevalence of long-term conditions
In 2023/24, the LTCs with the highest recorded prevalence rates in patients registered with a GP in Camden were hypertension (8.83%), diabetes (4.04%) and asthma (3.98%). The prevalence of hypertension, chronic obstructive pulmonary disease, heart failure, and dementia has decreased in Camden in recent years, while there has been no significant change in the prevalence of all other conditions.
Incidence of depression
In addition, it was estimated that 1.81% (n=5,040) of patients aged 18 years or over who were registered with a GP in Camden received a new diagnosis of depression in 2023/24, which was significantly higher than the London average (1.25%). The incidence of depression has been increasing in recent years, both locally and regionally.
Age profile of long-term conditions
For the majority of LTCs, the greatest proportion of patients are aged 65+ years. In patients registered with a GP in Camden, this is highest for dementia, where 97.4% of diagnosed patients are aged 65+ years, followed by osteoporosis (91.5%), chronic kidney disease (81.1%) and atrial fibrillation (80.8%). However, asthma, depression and serious mental illness are the exceptions, with the greatest proportion of patients aged between 25 and 49 years.
Potentially undiagnosed long-term conditions
The North Central London Integrated Care System publishes a case finding dashboard which provides a snapshot of patients at risk of developing certain LTCs, to highlight social and demographic inequalities in those who may be affected. This data allows clinicians to access a list of their patients who may benefit from intervention.
In June 2025, it was estimated that there were 40,415 patients with a potentially undiagnosed LTC in Camden, of which 56.2% were male and 43.8% were female. The conditions with the greatest number of people eligible for case finding interventions were hypertension (n=19,560), diabetes (n=14,140) and cardiovascular disease (n=6,025). Meanwhile, the prevalence of potentially undiagnosed LTCs was highest in the Gypsy or Irish Traveller (22.4%), Caribbean (17.9%), and White and Black Caribbean (16.9%) ethnic groups.
Disease burden
The disability-adjusted life-year (DALY) is a measure of health loss due to disease burden, and is calculated as the sum of the years of life lost (YLLs) due to premature death and years of life lived with disability (YLDs). One DALY represents one year of healthy life lost.
The total disease burden in Camden remained largely unchanged from 2010 to 2021, with slight increases in communicable disease DALYs offset by decreased DALYs due to non-communicable diseases (NCDs) and injuries [38]. In 2021, COVID-19 had the largest DALY burden in Camden, accounting for 11.2% of total DALYs. The leading causes of DALYs from NCDs were low back pain (5.1%), major depression (3.9%), ischaemic heart disease (3.6%) and type 2 diabetes (3.1%), comprising 15.7% of all DALYs. Of the leading causes, the biggest increase in disease burden between 2011 and 2021 was seen for type 2 diabetes (43.0%), major depressive disorder (28.4%), alzheimer’s disease and other dementias (16.0%), and anxiety disorders (13.8%).
[38]
Institute for Health Metrics and Evaluation. GBD Compare 2025.
Multimorbidity
Multimorbidity is defined as the presence of two or more long-term conditions, and is associated with a greater risk of functional decline, poorer quality of life, greater healthcare use and mortality [39]. Multimorbidity is significantly associated with age and becomes almost universal in older adults. However it is also more common and occurs at an earlier age in people living in areas of higher socioeconomic deprivation [40].
[39]
Yarnall AJ, Sayer AA, Clegg A, Rockwood K, Parker S, Hindle JV. New horizons in multimorbidity in older adults. Age and Ageing 2017;46:882–8. https://doi.org/10.1093/ageing/afx150.
[40]
Skou ST, Mair FS, Fortin M, Guthrie B, Nunes BP, Miranda JJ, et al. Multimorbidity. Nature Reviews Disease Primers 2022;8:48. https://doi.org/10.1038/s41572-022-00376-4.
In patients registered with a GP in Camden, multimorbidity increases with age, from less than 3.0% of the population aged under 50 years, to 19.6% in the 50-64 years age group, 40.2% in the 65-74 years age group and 61.0% in those aged 75+ years. In the population aged 75+ years, the greatest proportion of patients have 3 or more long-term conditions (39.0%).
Long-term condition complexity
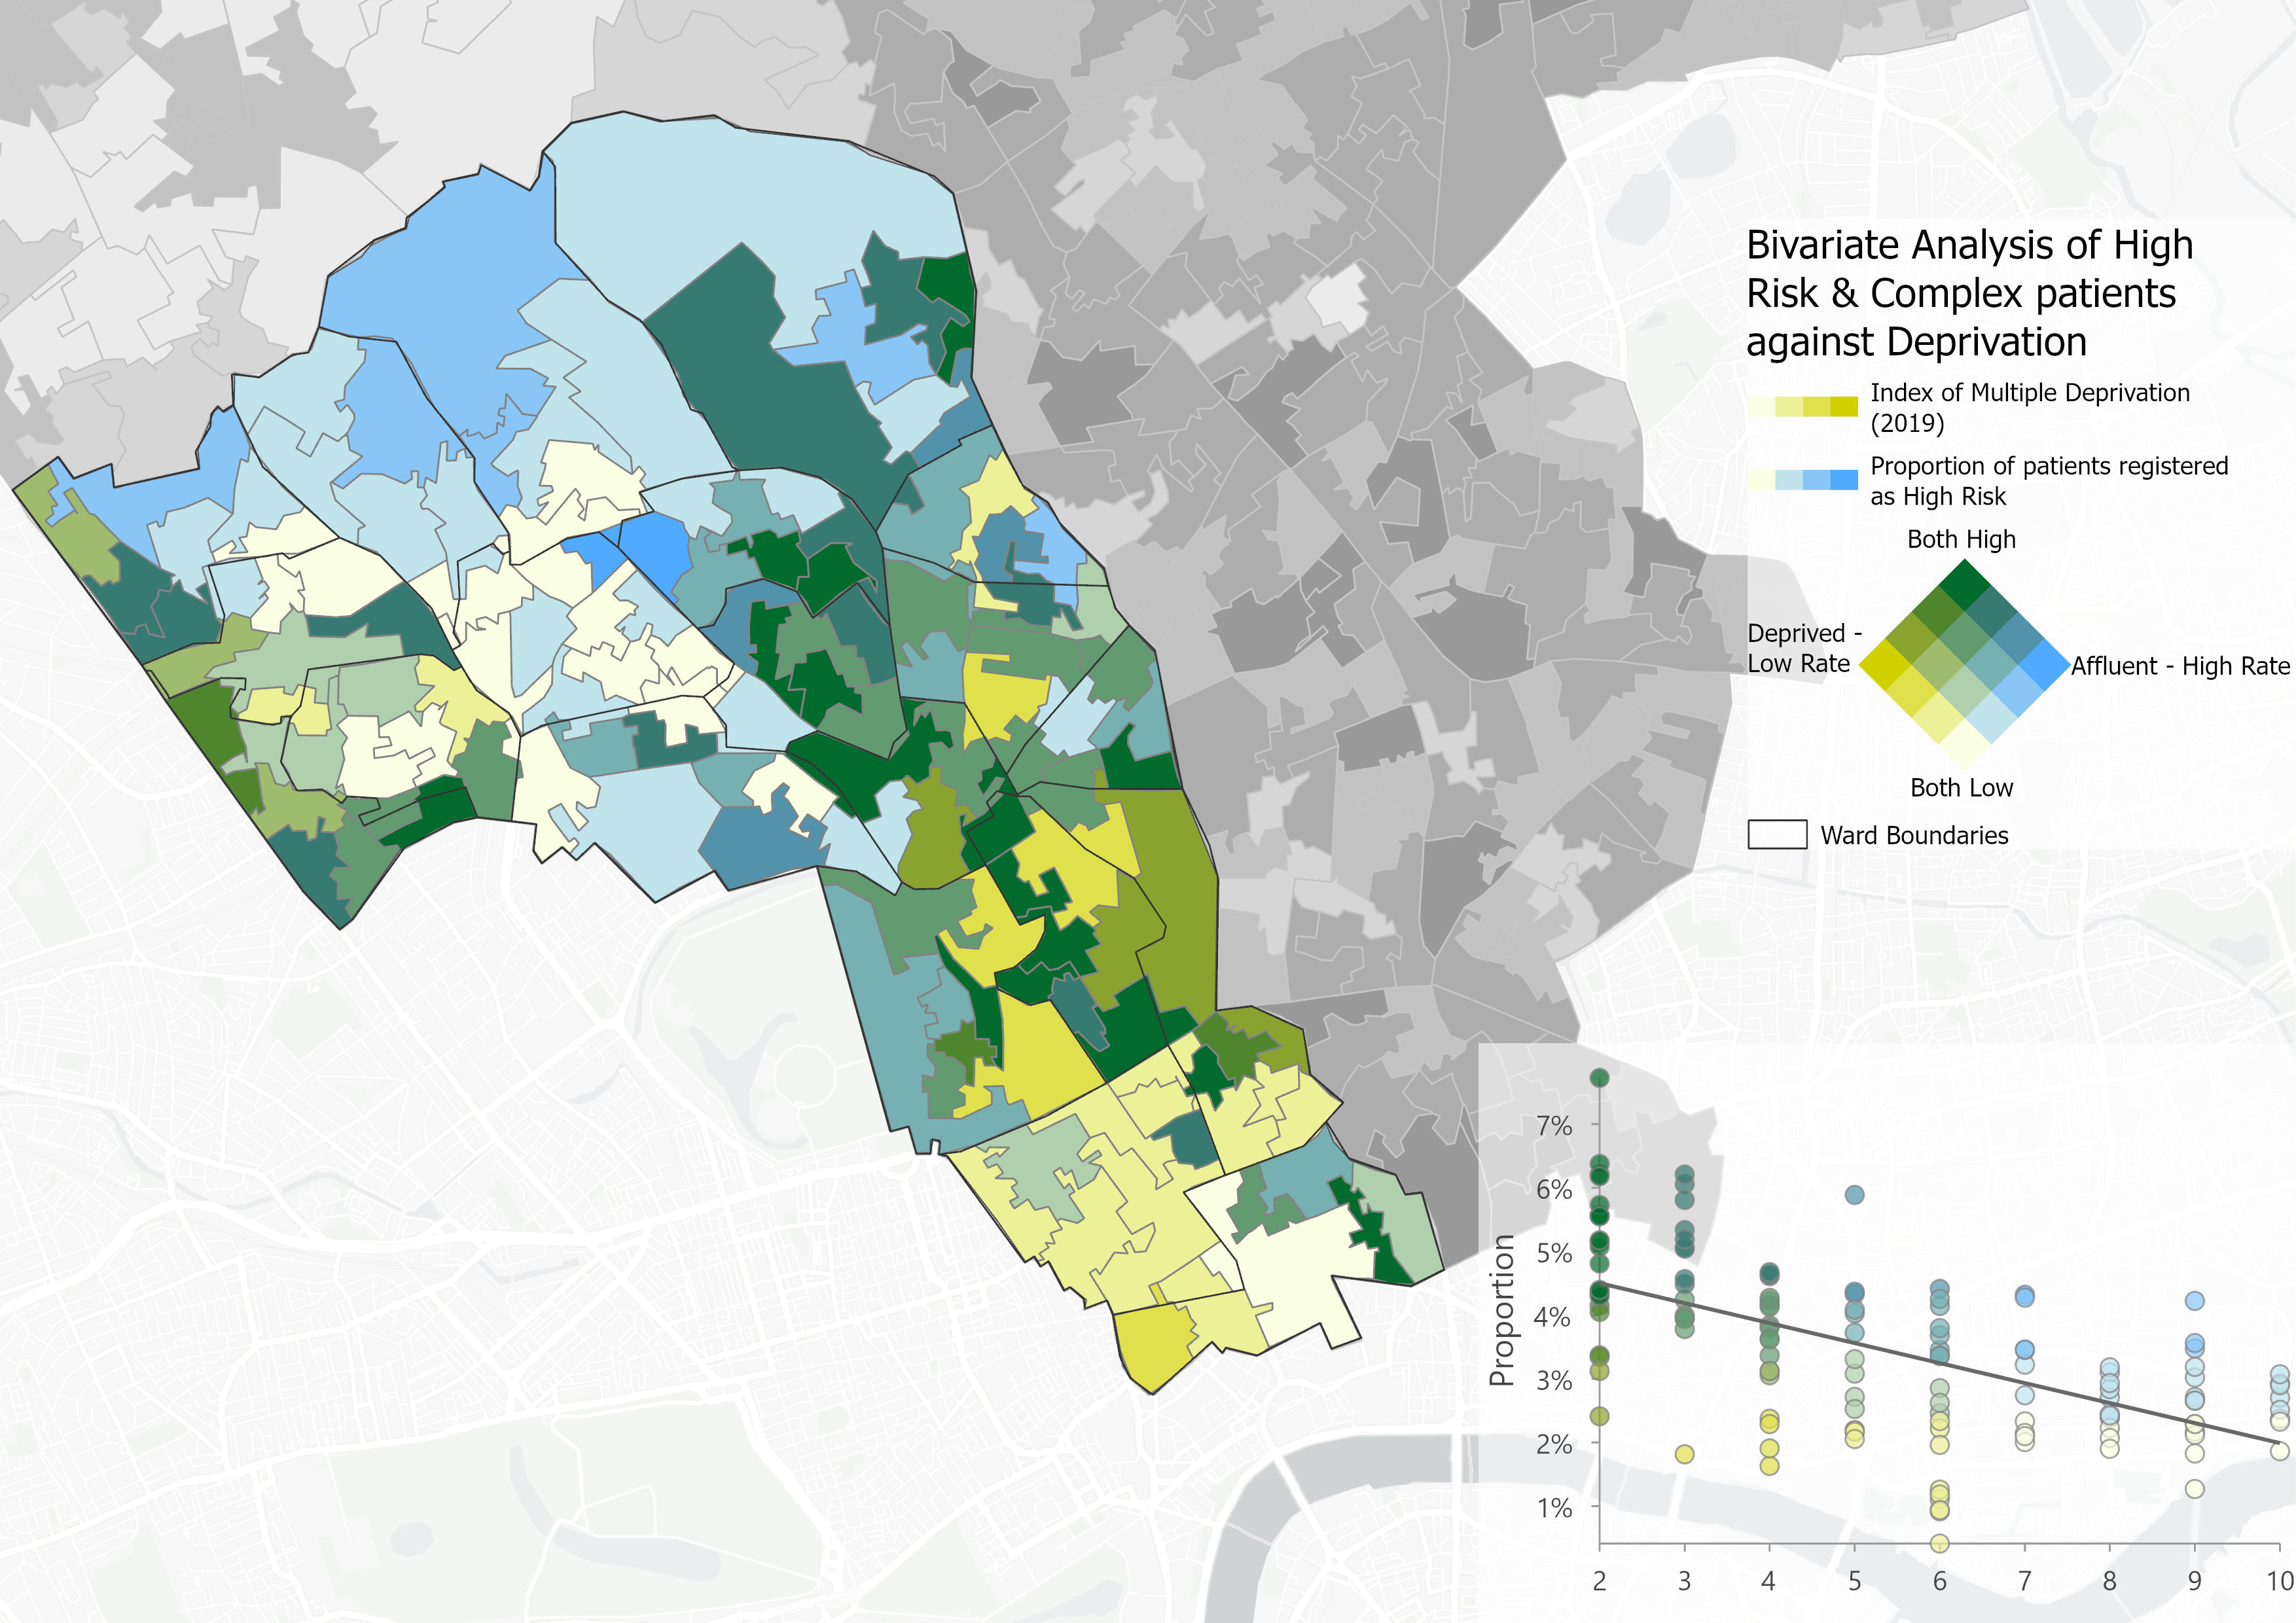
Age and social deprivation are leading risk factors for the development of many LTCs, therefore the burden of LTCs, and multimorbidity, tends to be higher in older and more deprived populations. Patients with multiple LTCs have higher needs for health care, and greater complexity in their management.
In Camden, the Eastern and Central parts of the borough, and those around Kilburn, exhibit both high levels of deprivation and LTC complexity, suggesting these areas are likely to have the greatest health and care needs. The North of the borough also has high levels of LTC complexity, largely due to the older age demographic, although these areas are characterised by low levels of deprivation. Meanwhile, areas around the South show high levels of deprivation but lower LTC complexity, likely due to the younger age demographic.
Mortality
Leading causes of death
In recent decades, there has been a shift in the overall pattern of morbidity and mortality - from infectious diseases to an increasing burden of non-communicable diseases [41]. Therefore, many of the leading causes of death in Camden are now long-term conditions.
[41]
McKee M, Dunnell K, Anderson M, Brayne C, Charlesworth A, Johnston-Webber C, et al. The changing health needs of the UK population. The Lancet 2021;397:1979–91. https://doi.org/10.1016/S0140-6736(21)00229-4.
In 2023, dementia was the leading cause of death for females in Camden, accounting for 14.5% of all deaths, followed by cerebrovascular disease (6.5%) and ischaemic heart disease (6.3%). Meanwhile, in males, ischaemic heart disease was the leading cause of death, accounting for 12.7% of all deaths, followed by dementia (7%) and chronic respiratory disease (5.1%).
Not all deaths can be avoided but those which occur prematurely due to preventable or treatable diseases, illnesses, or injuries, offer the opportunity to reduce mortality by targeting interventions to address the underlying causes. There are several indicators which can be used to describe avoidable mortality, each of which are defined below:
- Premature mortality - all deaths in people under the age of 75 years.
- Preventable mortality - deaths in people under the age of 75 years which could have been avoided through effective public health and primary prevention interventions.
- Treatable mortality - deaths that could have been prevented through timely and effective healthcare interventions, including secondary prevention and treatment.
- Avoidable mortality - all the deaths defined as preventable or treatable.
Premature mortality is a good high-level indicator of the overall health of a population, and is correlated with many other measures of population health.
Since 2001-03, the rate of premature mortality in Camden has fallen by 38% (28% in females and 42% in males). However, the rate of improvement slowed in the decade before the pandemic, while the rate increased between 2014-16 and 2020-22.
In 2021-23, Camden had a similar rate of premature mortality to London (322 vs 324 deaths per 100,000), while the rate was better than the England average (349 deaths per 100,000). Both locally and nationally, the rate of premature mortality was significantly higher in males compared to females.
Between 2021-23, the highest rates of premature mortality in Camden were from cancer (113 deaths per 100,000; n=462) and cardiovascular disease (71.1 per 100,000; n=298), followed by respiratory disease (27.7 per 100,000; n=109) and liver disease (21.2 per 100,000; n=91). These rates were all similar to the London and England averages. In Camden, rates of premature mortality from cancer, respiratory disease, and liver disease have declined over the past five time periods, while the rate for cardiovascular disease increased; however, none of these trends reached statistical significance.
Between 2021-23, males had a significantly higher rate of under 75 mortality from cancer, cardiovascular disease and respiratory disease compared to females, in Camden. The rate of premature death from liver disease was also higher in males than females, although this difference was not statistically significant.
There are stark inequalities in the rate of premature mortality, and this inequality follows a strong social gradient. Between 2021-23, people living in the 10% most deprived areas in England were 1.8 times more likely to die prematurely than those living in the 10% least deprived areas (480 vs 269 deaths per 100,000).
Deaths are considered preventable if, in the light of the understanding of the determinants of health at the time of death, all or most deaths from the underlying cause could mainly be avoided through effective public health and primary prevention interventions.
Since 2001-03, preventable mortality rates in Camden have declined by 13% in females and 37% in males, however the level of improvement slowed in the decade before the pandemic, before increasing during the pandemic.
In 2021-23, the rate of preventable mortality in Camden (156 deaths per 100,000) was similar to that in London (150 deaths per 100,000) and England (164 deaths per 100,000). Males had a significantly higher rate of preventable mortality than females, both locally and nationally.
Between 2021-23, the highest rates of preventable mortality in Camden were from cancer (47.9 per 100,000; n=192) and cardiovascular disease (30.1 per 100,000; n=125), followed by liver disease (19 per 100,000; n=82) and respiratory disease (18.3 per 100,000; n=70). These rates were all similar to the London and England averages. Over the last five time periods in Camden, preventable mortality rates from cancer and liver disease have declined, while the rate for cardiovascular disease increased; although, none of these differences were statistically significant.
Between 2021-23, in Camden, the rates of preventable mortality from cancer and cardiovascular disease were significantly higher in males compared to females. Males also had a higher rate of preventable mortality from liver disease and respiratory disease than females, although these differences were not statistically significant.
Between 2021-23, people living in the 10% most deprived areas in England were more than twice as likely to die prematurely from a cause considered preventable than those living in the 10% least deprived areas (241 vs 117 deaths per 100,000).
While there has been a significant decline in the rate of treatable mortality in the past 20 years, this level of improvement has slowed considerably in the past decade.
In 2021-23, the treatable mortality rate in Camden was 73.2 deaths per 100,000 population (n=306), which was similar to that for London (79.7 per 100,000) and significantly lower than that for England (82.7 per 100,000). In Camden, males had a higher rate of treatable mortality compared to females, although this difference was not statistically significant.
While there has been a considerable decrease in the rate of avoidable mortality in the past 20 years, this pattern reversed during the covid pandemic, and the most recent data shows the rate remains higher than pre-pandemic levels.
In 2021-23, the avoidable mortality rate in Camden was 228.9 deaths per 100,000 population (n=978), which was similar to that for London (229.6 per 100,000) and significantly lower than that for England (246.4 per 100,000). Males have a significantly higher rate of avoidable mortality compared to females.
Of the 978 avoidable deaths in Camden between 2021-23, 68.7% (n=672) were attributable to conditions considered preventable and 31.3% (n=306) to conditions considered treatable.
Life expectancy gap
The Office for Health Improvement and Disparities (OHID) Segment Tool provides information on the causes of death that are driving inequalities in life expectancy at local area level [42]. Targeting the causes of death which contribute most to the life expectancy gap should have the biggest impact on reducing inequalities.
[42]
OHID. Segment Tool 2021.
Between 2020 and 2021, around three-quarters of the gap in life expectancy between the most and least deprived areas in Camden was due to higher mortality rates from COVID-19, circulatory disease, cancer, and respiratory disease in the most deprived quintile, compared to the least deprived quintile.