Background
What are the wider determinants of health?
The wider determinants of health, also referred to as the social determinants of health, are the broad range of social, cultural, political, economic and environmental conditions that shape people’s health and wellbeing. These include the circumstances in which people are born, grow, live, work and age, such as income, education, employment, housing, social networks and the physical environment.[1]
People experience these conditions differently throughout their lives, which can lead to unequal opportunities and exposure to risks across the population. Structural and institutional factors such as racism, discrimination and stigma can further influence how these conditions are experienced and contribute to differences between groups.
As a result, wider determinants are a key driver of health inequalities. These are systematic, unfair and avoidable differences in health outcomes seen between different groups of people. [2]
The Dahlgren and Whitehead model (figure 1) is commonly used to show how these factors influence health. [3] It highlights how different layers, from individual characteristics to broader social, economic and environmental factors, interact to shape health outcomes.
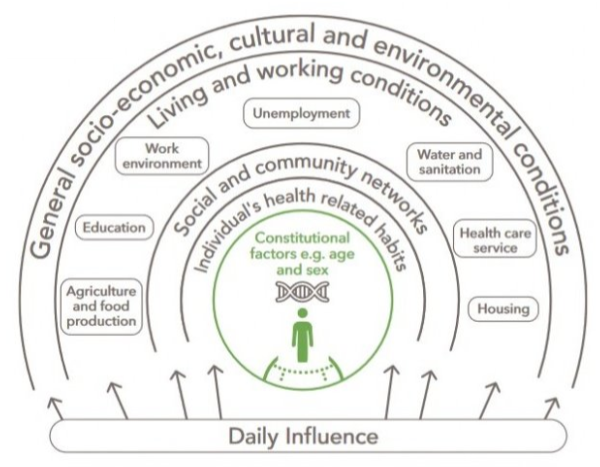
Figure 1: The Wider Determinants of Health. Source: Dahlgen and Whitehead (1991)
Why do wider determinants matter?
Wider determinants are often described as the ‘causes of the causes’ of ill health, as they underpin many other factors that influence health.
For example, people living in poor quality housing are more likely to be affected by damp and cold, increasing their risk of developing both physical and mental health conditions. People on low incomes may find it harder to afford healthy food, or have time to prepare it, increasing the risk of obesity and conditions such as diabetes.
Evidence consistently shows that social and economic inequalities are strongly associated with differences in health outcomes. The Marmot Review (2010) highlighted that there is a social gradient in health. The lower a person’s social position, the more likely they are to have poorer health and live shorter lives than those in the least deprived areas.[4]
These differences are significant. In England, there is around a 19 year gap in healthy life expectancy (whether we experience health conditions or diseases that impact how long we live in good health) between the most and least affluent areas of the country [5]. What’s more, people in the most deprived areas are more likely to develop multiple long-term health conditions 10 to 15 years earlier than those in the least deprived communities [6].
The impact of health inequalities goes beyond individuals. Poor health increases demand on healthcare services, reduces people’s ability to work, and places wider pressure on public services and the economy.
The Marmot Review reinforces that reducing health inequalities is a matter of fairness and social justice. It suggests that action on health inequalities requires action across the social determinants of health, including education, employment, housing and the environment.[4]
What will this profile include?
This profile provides a high-level overview of the broad individual, social and environmental factors that play a part in shaping the health and wellbeing of residents in Camden.
The profile follows the journey of an individual through the life course, highlighting factors that influence their chances of healthier outcomes. The following topic areas are covered:
Education
Work, income and vulnerability
Housing
Community
The natural and built environment
How to use this profile
The wider determinants of health should be considered by anyone working directly with residents, who develop and run services for residents or who are making strategic decisions on behalf of residents. Ensuring that any service offer includes support for resident’s wider determinants of health is essential in taking a preventative approach and can help identify opportunities to improve health and wellbeing and reduce inequalities. An example of this is where a social work team has a referral pathway into debt support, or housing officers referring to community groups to alleviate social isolation.
This profile can be used to support strategic planning, policy development, commissioning, service design, partnership working and identify areas of need. It’s intended to help organisations and teams consider the potential impact of the decisions on health and wellbeing.
What the data shows
Education
Why education matters
Education, from early years through to the end of secondary school, has strong links to good health and social mobility.[7]. In light of the COVID-19 pandemic, schools across the country were closed for multiple, extended periods of time, with the impact of this likely yet to be fully realised. Educational settings provide environments that support children’s social and emotional development, facilitate physical activity, and offer important opportunities for safeguarding and support.[8].
Early years
Strong communication and language skills in the early years are associated with improved educational and employment opportunities and better health outcomes later in life.[9] In England, the Good Level of Development is a measure of school readiness used at the end of reception, whereby children are defined as having achieved a good level of development if they are at the expected level for twelve key learning goals. School readiness follows a strong social gradient, with children living in more deprived areas less likely to achieve a good level of development by the end of Reception than those living in less deprived areas..
In 2024/25, the proportion of children at good levels of development in Camden was 69.8%. The value observed in Camden was statistically similar to London and England.
Absences
Similarly to development in early years, absenteesim from school settings has a strong link to educational outcomes and employment opportunities. A pupil is defined as persistently absent if they miss 10% of expected sessions. School attendance reduced during and after the COVID-19 pandemic, peaking at 27% in England during 2021-2022.[10] Despite school-attendance being seen as a school-led challenge to confront, there are arguments to say that absence and pupil absenteeism should be used as a metric to describe population health.
Nationally, rates of absence is higher among pupils with the following characteristics:
- Pupils eligible for free school meals
- Pupils with special educational needs
- Pupils from Irish Traveller and Gypsy/Roma backgrounds[11]
Pupil absence in the following metric is defined as the percentage of half days missed by pupils due to overall absence in the academic year (including authorised and unauthorised absence). Tackling absenteeism in schools is critical in improving educational attainment and social mobility, helping reduce future health inequalities.
In 2023/24, the proportion of half-days missed in Camden was 7.2%. Camden had significantly higher proportions of half-days missed compared to the London.
Persistent absenteeism is reached when a pupil misses 10% or more of their possible sessions. Tackling absenteeism in schools is critical in improving educational attainment and social mobility, helping reduce future health inequalities.
In 2023/24, the proportion of primary school enrollments missing at least 10% of their possible sessions in Camden was 7.2%. Camden had significantly higher proportion of pupils missing 10% or more of their possible sessions compared to the London and England.
Persistent absenteeism is reached when a pupil misses 10% or more of their possible sessions. Persistent absenteeism typically increases with age and school year. Tackling absenteeism in schools is critical in improving educational attainment and social mobility, helping reduce future health inequalities.
In 2023/24, the proportion of primary school enrollments missing at least 10% of their possible sessions in Camden was 7.2%. Camden had significantly higher proportions of Secondary school enrollments missing 10% or more of their possible sessions compared to the London and England.
Young people not in education, employment or training (NEET)
Young people who are not in education, employment or training (NEET) are at risk of negative outcomes in later life; the Centre for Longitudinal Studies uncovered links between self-reported physical health problems and psychological distress with those who had greater NEET exposure during their 16 to 24 years.[12] In the three months to December 2025, roughly 957,000 young people aged 16-24 years in England were classed as NEET. The proportion of these individuals who report a work-limiting health condition has increased over the past ten years, reaching 44% in 2025, likely driven by the rising prevalence of mental health/neurodivergent conditions, improved diagnosis and wider social factors.[13]
In 2024/25, the proportion of 16 to 17 year olds not in education, employment or training in Camden was 2.9%. Camden had significantly lower proportions of 16 to 17 year olds not in education, employment or training compared to the England.
Work, income and vulnerability
Why work and income matters
A strong economy is one that provides sufficient quantity and quality of employment opportunities for the population. Income is established as an important, if not the key, driver of social gradients in physical health, mental health and mortality. [14] Good employment is protective of health, whilst unemployment contributes to poor health.[15] It is also an important fulfillment of an individuals purpose and status. Without employment, risks of poorer general health, longstanding illness, psychological distress and higher admission rates can all arise.
Economic inactivity
An individual is defined as economically inactive if they have not been searching for work in the previous four weeks, or unable to start work in the following two weeks. The rate of economic inactivity is therefore the number of 16 - 64 years old’s who are not in the labour force as a proportion of the population within that age group.
Economic inactivity is strongly correlated to poor health in a population. Though morbidity is often a predictor of economic inactivity, limited access to paid work often has an extenuating impact on families who may be facing financial hardship - presented in the form of deteriorating physical and mental health.[16] Across the United Kingdom, roughly one third of the economically inactive have long term sickness - burdened with problems linked to mental health, cardiovascular conditions and muscoskeletal issues.[17] Though an individuals ability to participate in the labour market is determined by health (and health inequalities), the relationship is bi-directional; by not participating in the labour market, poor health is further entrenched into local populations.
In 2024/25, the proportion of Camden’s population considered economically inactive was 23.3%. The value observed in Camden was statistically similar to London and England.
Unemployment rate
It is important for colleagues to differentiate between economic inactivity and unemployment rate. Camden’s economic inactivity rate may be inflated compared to other areas, particularly neighbouring boroughs, due to the inclusion of students in its measure. Camden has a relatively high proportion of 16-24 year old’s who may be attending university or otherwise - a reflection of the fact Camden has a higher number of higher educational institutions.
Unemployment rate as a measure, on the other hand, reflects those closer to work than the economically inactive. The measure includes those who are not currently in work, however they have reported they have been searching for work in the previous four weeks and are able to start work in the following two weeks. People who face unemployment often can suffer from stress, social isolation and financial hardship - all of which can impact an individuals mental and physical health.
The unemployed make up a small proportion of the population, and unemployment estimates from the Annual Population Survey for local authorities are based on very small sample and are therefore potentially unreliable. To overcome this, a model-based methodology is in development, borrowing strength from the claimant count as a means to increase the estimates precision.
At some stages during 2023 and 2024, Camden’s modeled unemployment rate was significantly higher than that estimated for England overall. In the latest time period available (Dec 2025), the modelled unemployment rate in Camden was 4.7%, which was statistically similar to London and England.
The following graph presents the modeled unemployment rate for all London boroughs - the estimated rate for each borough falls along the black point range. The shaded areas represent the range of uncertainty for the estimates for England (blue) and London (purple). Where the black point range overlaps with the shaded areas, the estimate for that borough is statistically similar to the estimate for England or London. Camden’s modeled unemployment rate is statistically similar to both London and England.
Income
Income, provided through sustainable employment, can influence the health of an individual, as well as the people dependent on them. Lower levels of income allow for fewer opportunities for good health and can allow for increased exposure to things harmful to health (for example, food insecurity and cold homes).[18] Though Camden has a relatively high median income (the 7th highest income nationally as of 2026), there are inequalities in income locally which manifest further disparities in broader health-related measures.
Excluding the City of London, Camden has the seventh highest median monthly pay in the country, at £3,610.
Life expectancy is the average number of years a new-born baby would live if they experienced the age-specific mortality rates for that area and time period throughout their life. A positive relationship exists between income and female life expectancy. That is to say, areas in Camden with higher household incomes (after housing costs) typically have higher female life expectancy.
Life expectancy is the average number of years a new-born baby would live if they experienced the age-specific mortality rates for that area and time period throughout their life. A positive relationship exists between income and male life expectancy. That is to say, areas in Camden with higher household incomes (after housing costs) typically have higher male life expectancy.
Affordability
The affordability of an area impacts where people live and work. There is a growing body of evidence linking the unaffordability of housing with negative outcomes, with those living in unaffordable housing having heightened odds of poorer self-rated health.[19] Without affordable housing, families face financial stress and broader instability. In expensive areas, there is an active trade-off between income being spent on housing and income being spent on nutritious food, heating and childcare - all of which can exacerbate health inequalities across a population.[20]
The following ratio reflects affordability - it is the median price of sold and registered dwellings in an area against the average annual earnings of that area. The higher the ratio, the more unaffordable the area is.
Affordability has progressively worsened over the course of the 21st century, particularly in London. More specifically, the ratio of affordability has increased in Camden since 2010, and has consistently been less affordable compared to the London region overall. Affordability has improved both locally and nationally since 2021, although Camden remains the least affordable on average.
Housing
Why housing matters
Housing is a significant determinant of health. Whilst providing the infrastructure for a home, the building itself is fundamental in establishing ones feelings of safety, connection and community. Along with these social factors, good housing enhances an individuals physical health, through warmth and protection from natural elements. On the contrary, poorer housing conditions are often assocaited with preventable illness and mortality. An estimated 21.5% of excess winter deaths are attributable to cold homes, whilst poorer conditions in general has a well documented impact on a residents mental health.[22] When considering the health of an individual, it is important to understand the impact their housing may be having on them.
Tenure
Tenure refers to the way a household occupies a dwelling. The feelings of safety, continuity and permanence of housing as a home is linked to the security of being, with the feelings of this security holding a close relationship to broader well-being and health [23]. Limited supply of social housing can often dictate low-income households moving into the private rented sector, where costs are typically higher, quality is poorer and continuity is less secure - this can drive households further into poverty. Across the UK, there are 1.4 million fewer social homes than there were in 1980 - this has lead to increases in the size of waiting lists and increasing numbers resorting to temporary accommodation [24]. Access to secure housing is a significant driver of health inequalities - the security of a home provides a basis to maximise education and employment opportunities, resulting in better health outcomes.[25,26]
In Camden, 33.6% of households were recorded as socially rented in the 2021 Census. Camden had significantly higher proportions of households socially rented compared to the London and England.
Occupancy and overcrowding
Overcrowded homes can lead to poorer health outcomes. The Office of National Statistics measure overcrowding using occupancy rating; a score of -1 or less indicates that a dwelling has fewer bedrooms than are required according to the Bedroom Standard.[27] In 2021, 8.3% of dwellings were determined as overcrowded. Overcrowding has disproportionate effects on minority groups. In 2021, one out of every six children lived in an overcrowded household [28].
The proportion of overcrowded households in Camden as of the ONS 2021 census was 9.5%. Camden had significantly lower rates of overcrowding compared to the London. Camden had significantly higher rates of overcrowding compared to the England.
Social homes in Camden are more likely to be overcrowded compared to private sector homes or home owned outright.
Households consisting of individuals from Black or Asian ethnic groups are more likely to be overcrowded than households with individuals from White ethnic groups.
There is significant variation in the proportion of households that are deemed overcrowded between wards within Camden. The ward with the highest proportion of overcrowded households was St Pancras & Somers Town (17.2%), whilst the ward with the lowest proportion of of overcrowded households was Hampstead Town (2.5%).
Fuel poverty
Under the Low Income Low Energy Efficiency definition, a household is considered to be fuel poor if it meets both of the following criteria:
- The property has an energy efficiency rating of band D or lower; and
- After spending the amount needed to adequately heat their home, the household’s remaining income falls below the official poverty threshold.[29]
Cold homes can worsen a range of a physical conditions as well as mental health, exacerbating existing health inequalities. Fuel poverty can also lead to excess mortality [30].
There is significant variation in fuel poverty across London, with proportions in boroughs ranging from 4.6% to 13.3% of households. The rate of fuel poverty in Camden as of 2023 was 8.6%. Camden had significantly lower fuel poverty rates compared to the London and England.
There is significant variation in rates of fuel poverty between the wards of Camden. The ward with the highest proportion of households in fuel poverty was Bloomsbury (10.5%), whilst the ward with the lowest proportion of households in fuel poverty was Camden Town (7.4%).
Sense of community
Why community matters
There has been growing evidence in public health literature exploring how an individuals health is as much determined by the community they sit within as the individual choices one makes. By encouraging healthy habits, molding safer neighbourhoods and increasing the cohesion of a community, an individuals physical and mental health improve and inequalities within areas reduce. Communities with higher levels of social capital can make areas for resilient, establishing buffers between populations and disease or negative health-related behaviours.[1]
Violence
Violence is a major cause of ill health and poor wellbeing and is strongly related to inequalities, wellbeing and outcomes, making its reduction a key public health priority.[38] Interventions to solve violence at an early age also improve education attainment, employment prospects and long term health, in unison improving the overall health of a local community.
Violence in the community can be measured through various proxies, including incidents measured through police data, admissions linked to violence and also more subjective perceptions around safety in the community.
What is recorded as violent crime?
The following indicator records violence that has occurred against a person based on police crime data. Offences that fall under this description are:
- Assault (with or without injury)
- Murder, manslaughter or homicide (including conspiracy)
- Child abandonment
- Child abduction
- Cruelty or neglect to children
- Endangering of life
- Injury as a result of dangerous or careless driving
- Slavery
- Kidnapping
- Stalking or harassment
- Racially aggravated assault
The rate of violent offences observed across Camden in 2024/25 was 31.72 per 1,000 population. Camden had significantly higher rates of violent offences compared to the London.
The rate of hospital admissions due to violent offences observed across Camden in 2021/22 - 23/24 was 30.88 per 100,000 population. The rate of hospital admissions in Camden was statistically similar to the London region and England.
The natural and built environment
Why our surrounding environment matters
The built and natural environment an individual is surrounded by acts as a key driver in the social, economic and environmental circumstances that shape a persons physical and mental health [39]. Elements such as neighbourhood design, access to green space and connectivity form a complex web of factors that influence health across stages of life. Neighborhood planning can impact physical activity, patterns of food intake and social cohesion.
Access to open space
In the Department for Environment, Food and Rural Affairs Environmental Improvement Plan 2025, the government body committed to ensuring that all people have access to a green or blue space within a 15-minute walk from their household.[40] There is strong evidence linking open space to better health outcomes, and particularly important within urban settings. Nationally, 2.1 million people use urban green space to reach the suggested level for weekly physical activity, saving the national health service an estimated £1.4 billion.[41] Currently, there is variation in the level of access to nature, with individuals living in more deprived areas, younger people and those from ethnic minority backgrounds having less access.[42]
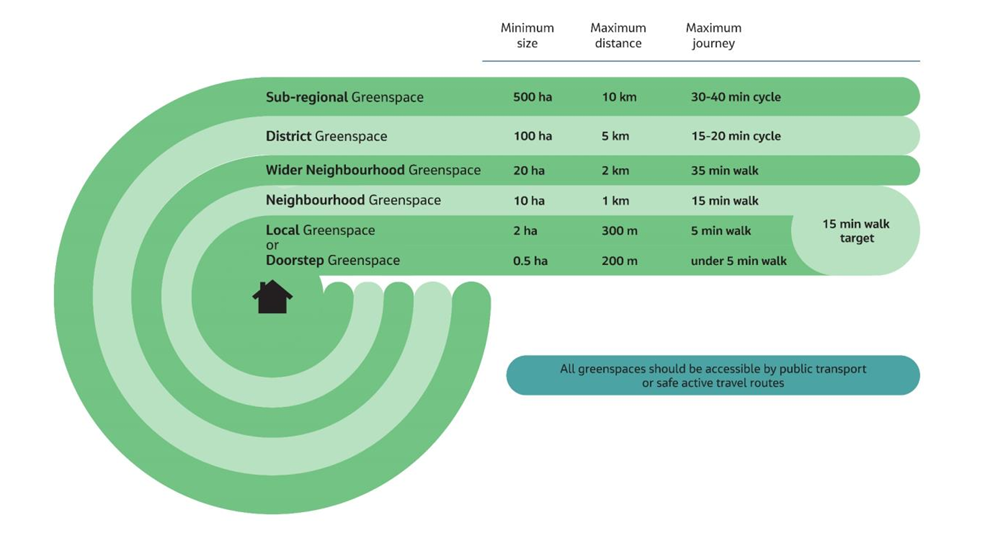
Figure 2: Accessible green space Standards(Green Infrastructure Standards for England - Summary)
Through the 15-minute commitment, the proportion of households with sufficient access to open space can be measured. The following represents the proportion of households that have less than a 15-minute walk to a green space.
The proportion of households that have neighbourhood green space access in Camden (51%) was significantly lower than that observed across the London region (67.4%) and England (76.3%).
However, the proportion of households with qualifying door step access (a 0.5 hectare green space within 200 meters) is significantly higher in Camden (18.6%) than it is across London (17.6%) and the rest of England (15.9%).
Despite access to green space being relatively better in Camden compared to wider London, this does not necessarily mean the population is satisfied with the green space available. Across the 2024 and 2025 Community Life Survey’s, 78.6% of respondents in Camden reported they were satisfied with green and natural spaces in their local area. The proportion of Camden respondents satisfied with their local green space was statistically similar to London and Engalnd. Nationally, reasons for dissatisfaction ranged from concerns around spaces being difficult to access, hosting anti-social behaviour and being generally unkempt. Individuals living in more deprived areas may live closer to available green space, but may have poorer perceived accessibility, safety concerns, and therefore infrequent use.[43]
Fast food
The neighbourhood food environment is an important modifiable determinant of dietary behaviour and obesity.[44] The accessibility of fast food outlets has broader effects on long term health outcomes. For example, those residing in areas with higher concentrations of fast food outlets nationally have lower estimated life expectancy.[45]. Fast-food outlets have a propensity to cluster in more deprived areas due to cheaper rent and, in some cases, they can undermine weight-management programmes by making healthier-food less accessible. Low obesity prevalence in Camden is low across most age groups compared to other boroughs in London, fast-food outlets are nonetheless relatively accessible due to the number of outlets that exist.[46]
The neighbourhood food environment is an important modifiable determinant of dietary behaviour and obesity.[44] Fast food and ultra-processed foods are typically higher in fat, salt and sugar, and greater consumption of this type of food is associated with an increased risk of overweight and obesity, type 2 diabetes and cardiovascular disease.[47] Although greater access to fast food does not necessarily translate into consumption, living in an area with a high density of fast food outlets is associated with poorer health outcomes. Fast food outlets are also not evenly distributed, with people living in more deprived areas and people from global majority ethnic groups more likely to live in areas with a higher concentration of these outlets. This unequal distribution may contribute to widening of health inequalities.
In 2024, the rate of fast-food outlets in Camden was 417.4 per 100,000 population. This was statistically worse than the value observed across England.
Though Camden reports the highest rate of fast-food outlets for it’s population size, it is important to take the impact cross local authority movements and non-resident populations into consideration. Camden is regarded for it’s attraction to tourists and other populations, in which the fast-food sector caters for. Camden has a high density of fast food outlets, however levels of obesity in borough are lower than the London average across all age groups/ Though greater access does not necessarily translate into consumption, living in an area with a high density of fast food outlets is associated with poorer health outcomes. At the regional and national level, those who live in more deprived areas and those from global majority ethnic groups are more likely to live in areas with a higher concentration of these outlets. This unequal distribution may contribute to the widening of health inequalities of an area.
References
[1]
Public Health England. Chapter 6: Wider determinants of health 2018. https://www.gov.uk/government/publications/health-profile-for-england-2018/chapter-6-wider-determinants-of-health (accessed May 21, 2026).
[2]
Public Health England. Reducing health inequalities: System, scale and sustainability. 2017.
[3]
Dahlgren G, Whitehead M. Policies and strategies to promote social equity in health. Background document to WHO - Strategy paper for Europe. Inst Futur Stud Arbetsrapport 1991;14.
[4]
Institute of Health Equity. Fair Society Healthy Lives (The Marmot Review) 2010. https://www.instituteofhealthequity.org/resources-reports/fair-society-healthy-lives-the-marmot-review (accessed June 24, 2026).
[5]
Office for National Statistics. Healthy life expectancy by national area deprivation, England and Wales - Office for National Statistics 2025. https://www.ons.gov.uk/peoplepopulationandcommunity/healthandsocialcare/healthinequalities/bulletins/healthylifeexpectancybynationalareadeprivationenglandandwales/between2013to2015and2020to2022?dm_i=21A8%2C8Z63R%2C7GWY7Z%2C11GX9H%2C1&utm_source=chatgpt.com (accessed April 13, 2026).
[6]
Barnett K, Mercer SW, Norbury M, Watt G, Wyke S, Guthrie B. Epidemiology of multimorbidity and implications for health care, research, and medical education: A cross-sectional study. Lancet 2012;380:37–43. https://doi.org/10.1016/S0140-6736(12)60240-2.
[7]
Bowen FR. Education is a Social Determinant of Health: School Nurses Level the Playing Field. J Sch Nurs 2023;39:343–4. https://doi.org/10.1177/10598405231191283.
[8]
Health TLP. Education: A neglected social determinant of health. Lancet Public Health 2020;5:e361. https://doi.org/10.1016/S2468-2667(20)30144-4.
[9]
Burchinal M, Vandell DL. School Entry Skills and Young Adult Outcomes. Early Child Res Q 2025;72:1–12. https://doi.org/10.1016/j.ecresq.2025.01.004.
[10]
Falconer C, De Aguiar Chaves T, Hargreaves D. School attendance is a public health issue: Lessons for the UK from a new US framework. Perspect Public Health 2026;146:124–5. https://doi.org/10.1177/17579139261440226.
[11]
Department for Education. Pupil absence in schools in England 2025. https://explore-education-statistics.service.gov.uk/find-statistics/pupil-absence-in-schools-in-england/2024-25-autumn-and-spring-term (accessed July 13, 2026).
[12]
Dr Alina Pelikh, Dr Sam Parsons, Professor Claire Crawford. Long-term consequences of being NEET in early adulthood 2026. https://cls.ucl.ac.uk/wp-content/uploads/2017/02/Long-term-consequences-of-being-NEET-Initial-findings-from-the-1970-British-Cohort-Study-at-age-51.pdf (accessed August 17, 2026).
[13]
The Health Foundation. Why are a growing number of young people who are NEET reporting work-limiting health conditions? - The Health Foundation 2026. https://www.health.org.uk/reports-and-analysis/analysis/why-are-a-growing-number-of-young-people-who-are-neet-reporting-work (accessed June 24, 2026).
[14]
Waddell G, Burton AK. IS WORK GOOD FOR YOUR HEALTH AND WELL-BEING? 2006.
[15]
Fair Society Healthy Lives full report n.d. https://www.parliament.uk/globalassets/documents/fair-society-healthy-lives-full-report.pdf (accessed April 8, 2026).
[17]
Bloom DE, Canning D, Kotschy R, Prettner K, Schünemann J. Health and economic growth: Reconciling the micro and macro evidence. World Dev 2024;178:106575. https://doi.org/10.1016/j.worlddev.2024.106575.
[18]
The Health Foundation. Living in poverty was bad for your health long before COVID-19 2020. https://www.health.org.uk/reports-and-analysis/briefings/living-in-poverty-was-bad-for-your-health-long-before-covid-19 (accessed August 18, 2026).
[19]
Pollack CE, Griffin BA, Lynch J. Housing Affordability and Health Among Homeowners and Renters. Am J Prev Med 2010;39:515–21. https://doi.org/10.1016/j.amepre.2010.08.002.
[20]
Department for Health and Social Care. Housing and health in local strategic health planning 2026. https://www.gov.uk/government/publications/housing-and-health-in-local-strategic-health-planning/housing-and-health-in-local-strategic-health-planning (accessed June 24, 2026).
[21]
Institute of Health Equity Team, Friends of the Earth. The Health Impacts of Cold Homes and Fuel Poverty 2011. https://www.instituteofhealthequity.org/resources-reports/the-health-impacts-of-cold-homes-and-fuel-poverty (accessed June 29, 2026).
[22]
Rolfe S, Garnham L, Godwin J, Anderson I, Seaman P, Donaldson C. Housing as a social determinant of health and wellbeing: Developing an empirically-informed realist theoretical framework. BMC Public Health 2020;20:1138. https://doi.org/10.1186/s12889-020-09224-0.
[23]
Ambrey CL, Bosman C, Ballard A. Ontological security, social connectedness and the well-being of Australia’s ageing baby boomers. Hous Stud 2018;33:777–812. https://doi.org/10.1080/02673037.2017.1388912.
[24]
Faculty of Public Health. Faculty of Public Health Briefing: Housing, poverty & public health 2024. https://www.fph.org.uk/policy-advocacy/special-interest-groups/poverty-sig/policy-briefings/ (accessed June 24, 2026).
[25]
Shelter. The story of social housing n.d. https://england.shelter.org.uk/support_us/campaigns/social_housing/story_of_social_housing (accessed July 13, 2026).
[26]
Bentley R, Mason K, Jacobs D, Blakely T, Howden-Chapman P, Li A, et al. Housing as a social determinant of health: A contemporary framework. Lancet Public Health 2025;10:e855–64. https://doi.org/10.1016/S2468-2667(25)00142-2.
[27]
Shelter England. Check if your home is overcrowded by law 2024. https://england.shelter.org.uk/housing_advice/repairs/check_if_your_home_is_overcrowded_by_law (accessed July 13, 2026).
[28]
National Housing Federation. Overcrowding in England 2023. https://www.housing.org.uk/resources/overcrowding-in-england-2023/ (accessed June 24, 2026).
[29]
(NEA) NEA. What is fuel poverty? n.d. https://www.nea.org.uk/what-is-fuel-poverty/ (accessed July 7, 2025).
[30]
Institute of Health Equity. Fuel Poverty, Cold Homes and Health Inequalities in the UK 2022. https://www.instituteofhealthequity.org/resources-reports/fuel-poverty-cold-homes-and-health-inequalities-in-the-uk (accessed June 24, 2026).
[31]
Holt-Lunstad J, Smith TB, Baker M, Harris T, Stephenson D. Loneliness and Social Isolation as Risk Factors for Mortality: A Meta-Analytic Review. Perspect Psychol Sci 2015;10:227–37. https://doi.org/10.1177/1745691614568352.
[32]
Letitia Anne Peplau, Daniel Perman. Loneliness - A sourcebook of current theory, research and thepary 1982. https://peplau.psych.ucla.edu/wp-content/uploads/sites/141/2017/07/Peplau_perlman_82.pdf (accessed July 14, 2026).
[33]
Umstattd Meyer MR, Prochnow T, Pickett AC, Perry CK, Bridges Hamilton CN, Abildso CG, et al. The Effects of Play Streets on Social and Community Connectedness in Rural Communities. Int J Environ Res Public Health 2021;18:9976. https://doi.org/10.3390/ijerph18199976.
[34]
Saadaoui R, Pfeiffer D, Morris EA. In neighbors we trust: A global perspective on how neighborhood trust shapes wellbeing. Wellbeing Space Soc 2025;8:100259. https://doi.org/10.1016/j.wss.2025.100259.
[35]
Pressman SD, Cohen S, Miller GE, Barkin A, Rabin BS, Treanor JJ. Loneliness, Social Network Size, and Immune Response to Influenza Vaccination in College Freshmen. Health Psychol 2005;24:297–306. https://doi.org/10.1037/0278-6133.24.3.297.
[36]
Ehsan A, Klaas HS, Bastianen A, Spini D. Social capital and health: A systematic review of systematic reviews. SSM - Popul Health 2019;8:100425. https://doi.org/10.1016/j.ssmph.2019.100425.
[37]
Butler AM, Kowalkowski M, Jones HA, Raphael JL. The Relationship of Reported Neighborhood Conditions With Child Mental Health. Acad Pediatr 2012;12:523–31. https://doi.org/10.1016/j.acap.2012.06.005.
[38]
Department for Health and Social Care. Preventing serious violence: summary 2019. https://www.gov.uk/government/publications/preventing-serious-violence-a-multi-agency-approach/preventing-serious-violence-summary (accessed June 24, 2026).
[39]
Public Health England. Spatial planning for health: Evidence review 2017. https://www.gov.uk/government/publications/spatial-planning-for-health-evidence-review (accessed April 20, 2026).
[40]
Department for Environment, Food and Rural Affairs. Environmental Improvement Plan (EIP) 2025 2025. https://www.gov.uk/government/publications/environmental-improvement-plan-2025/environmental-improvement-plan-eip-2025 (accessed April 20, 2026).
[41]
Department for Environment, Food and Rural Affairs. Woodland Access Implementation Plan 2023. https://www.gov.uk/government/publications/woodland-access-implementation-plan/woodland-access-implementation-plan (accessed April 20, 2026).
[42]
The Health Foundation. Inequalities in access to green space | The Health Foundation 2024. https://www.health.org.uk/evidence-hub/surroundings/inequalities-in-access-to-green-space (accessed April 20, 2026).
[43]
Jones A, Hillsdon M, Coombes E. Greenspace access, use, and physical activity: Understanding the effects of area deprivation. Prev Med 2009;49:500–5. https://doi.org/10.1016/j.ypmed.2009.10.012.
[44]
Office for Health Improvement and Disparities. Wider Determinants of Health: Statistical commentary on the location of fast food outlets, February 2025 2025. https://www.gov.uk/government/statistics/wider-determinants-of-health-february-2025-update/wider-determinants-of-health-statistical-commentary-february-2025 (accessed June 24, 2026).
[45]
The Health Foundation. Relationship between the concentration of fast food outlets and health | The Health Foundation 2024. https://www.health.org.uk/evidence-hub/surroundings/relationship-between-the-concentration-of-fast-food-outlets-and-health (accessed June 24, 2026).
[46]
Department of Health and Social Care. Fingertips - obesity | Department of Health and Social Care 2025. https://fingertips.phe.org.uk/search/obesity#page/3/gid/1938133443/pat/6/par/E12000007/ati/502/are/E09000007/iid/94136/age/168/sex/4/cat/-1/ctp/-1/yrr/1/cid/4/tbm/1/page-options/car-do-0 (accessed July 6, 2026).
[47]
Bahadoran Z, Mirmiran P, Azizi F. Fast Food Pattern and Cardiometabolic Disorders: A Review of Current Studies. Health Promot Perspect 2016;5:231–40. https://doi.org/10.15171/hpp.2015.028.
Social isolation, loneliness and community connectedness
Whilst social isolation is a quantifiable measure of contact, relationship ties and living arrangements [31], loneliness is a subjective perception of isolation frequently described (but not formally defined) as the discrepancy between an individuals current interpersonal relationships versus the relations they need or desire.[32] The degree of underlying community connectedness in an area is defined by a sense of solidarity, identification of oneself within the community and the feelings of mutual trust between members of its network.[33] Whilst assessing their wellbeing and recommending health-promoting activities, healthcare professionals could integrate assessments of their service users social relationships with neighbours.[34]
More information on this topic can be found in the Camden Social Isolation, Loneliness and Community Connectedness Health Needs Assessments.
Social isolation and loneliness have well-studied links to poorer health status and greater risk of negative health outcomes, including physical health, cardiovascular disease and mortality.[35]
Loneliness is measured by the Community Life Survey. To understand the prevalence of loneliness, the question “How often do you feel lonely?” is asked to respondents, with the proportion answering with “Often or always” being defined as chronically lonely.
In the years 2023/24 - 2024/25, the proportion of respondents in Camden reporting that they felt lonely often or always was 7.3%. The proportion of Camden respondents who feel lonely often or always was statistically similar to London and Engalnd.
The neighbourhood plays a significant role in constructing a person’s daily social interactions, shaping an individuals access to local services and forming an individuals perspective on their own safety.[34].
Belonging is measured by the Community Life Survey. To examine feelings of belonging, the question “How strongly do you feel you belong to your immediate neighbourhood?” was asked, with those answering with “Fairly strongly” or “Very strongly” being returned as the value.
In year 2023/24 - 2024/25, the proportion of respondents in Camden reporting they strongly believed to feel belonging to their neighbourhood was 60.7%. The proportion of Camden respondents who feel they had a sense of belonging in their neighbourhood was statistically similar to London and Engalnd.
Trust is an attitude that determines the way individuals act towards each other, and is a key component of an areas social capital - more trusting neighbours receive more support and social engagement, and are less likely to experience isolation or loneliness.[36] For example, children are more likely to experience mental health problems or anxiety where trust in the local neighbourhood is low.[37]
Trust is measured by the Community Life Survey. To understand underlying trust, the question “Thinking about the people who live in this neighbourhood, to what extent do you believe they can be trusted?” was asked, with those answering with “Many of the people can be trusted” being returned as the value.
In year 2023/24 - 2024/25, the proportion of respondents in Camden reporting they believed that people in their neighbourhood could be trusted was 37%. Camden had significantly lower proportions of individuals who believe their neighbours can be trusted compared to the England..