Ethnicity in Public Health Intelligence
Guidance on using quantitative and qualitative ethnicity-related data to inform public health practice
Internal users can watch a recording of an webinar held for those in Camden’s Health and Wellbeing department.
Introduction
Ethnicity-related data is an important component of public health research, service provision, and health inequalities analysis. Accurate and respectful reporting of ethnicity data is essential for ensuring equity in healthcare, identifying disparities, and shaping effective policies.
This guide outlines how the Public Health Intelligence team collects, analyses and reports ethnicity-related data in their work. The guide is intended to help strengthen quality and accuracy when collecting, analysing and interpreting ethnicity-related data within the team.
It is on our public site to increase the transparency around how we work as well as allow others to reuse or suggest improvements to the content. It is not intended as a comprehensive guide to ethnicity and race in public health nor should it be taken as a formal policy document or corporate guidance outside of the PHI team. Practice may (rightly) differ in other areas and changes over time. Those looking to adopt any practices from this document should critically appraise what may or may not be suitable for their application.
Definitions
Although the terms ethnicity and race are often used interchangeably in everyday language, they have distinct meanings, particularly in public health and legal contexts.
Ethnicity
Ethnicity is a self-defined and subjective identity, shaped by social and political contexts. NHS England [1]defines ethnicity as:
The population group a person belongs to, identifies with, or is identified by, considering cultural factors including language, diet, religion, ancestry, and physical features.
The King’s Fund [2] defines ethnicity as:
Ethnicity is a complex, multidimensional concept, defined by features such as a shared history, origins, language, and cultural traditions… it is a subjective identity based on how individuals define themselves
Race
Race, by contrast, is typically understood as a categorisation based on physical characteristics, particularly skin colour. The Equality Act 2010 defines race as a protected characteristic that includes “colour, ethnic or national origin, or nationality”.[3]
The Law Society [4] adds a critical perspective, describing race as:
A categorisation that is based mainly on physical attributes or traits, assigning people to a specific race simply by having similar appearances or skin colour (for example, Black or white), with a history rooted in white supremacy.
The concept of minoritisation
The term minoritised ethnic groups (or racially minoritised) recognises that individuals have been minoritised through social processes of power and domination rather than just existing in distinct statistical minorities.[5]
Nationality
Nationality refers to a person’s legal citizenship or country of origin. Unlike race or ethnicity, nationality is a legal status and does not necessarily reflect cultural identity or physical appearance.[6]
Our focus on ethnicity
In public health, it is generally more appropriate to collect and analyse data on ethnicity rather than race. This is because:
Ethnicity is self-defined, allowing individuals to express their own identity.
It is the standard used in the UK Census and many other data collection systems.
Ethnicity captures cultural and social dimensions that are more relevant to health behaviours, access to care, and outcomes.
Focusing on ethnicity helps avoid reinforcing biologically deterministic or racialised assumptions.
Language
Wherever possible, it is best to refer to specific ethnic groups, rather than using a single term for all ethnicities other than White British. However, there are times when a broader term is needed.
We recommend avoiding the following terms:
“non-White” as it reinforces “White as the default”
BME/BAME as it emphasises Black and Asian ethnic groups and excludes other such as Mixed or White ethnic minorities. It can imply ethnic minorities are a single homogenous group
We do not proscribe a specific term to refer to all ethnicities other than White or White British. This is because there is no universally preferred term, reflecting the wide range of experiences, viewpoints and cultures that fall under these umbrella terms.[7]
When presenting analysis that compares White or White British and other ethnic groups, we suggest “All other ethnic groups combined” or “Ethnic minorities (excluding/including White minorities)”. Other terms such as ethnic minority, minoritised ethnic group or global majority may also be used. However, it is important to be clear about how White ethnic minority groups have been categorised. Global majority implies White ethnic minority groups are excluded, whereas they may or may not be included in ethnic minority or minoritised ethnic group.
When discussing the Mixed ethnic group, avoid terms like “Mixed people” or “Mixed race people” and instead use ‘people with a Mixed ethnic background’ or ‘people from the Mixed ethnic group’.
Designing & delivering projects which collect and/or analyse ethnicity data
In this section we discuss things to consider at each stage of a project using quantitative and/or qualitative data.
Project design
All projects should have well defined aims, objectives and research questions. These should be informed by scoping which may include speaking to residents from specific ethnic groups. Questions should be selected with the intended use and impact of analysis in mind. Projects should also follow the usual best practice for project design. This includes drafting project initiation documents (PIDs), protocols and clearly defining roles and responsibilities for tasks throughout the life of the project (e.g. by using a RACI matrix).
Some things to think about when designing your data-driven project are shown in Table 1 below.
| Step | Quantitative | Qualitative |
|---|---|---|
| Selecting a methodological approach |

|
|
| Defining your sample/cohort (inclusion and exclusion criteria) |
|
|
| Selecting datasets |
|
|
| Choosing outcomes of interest |
|
|
| Planning a recruitment strategy |
|
|
| Considering research location |
|
|
| Designing your tools |
|
|
| Anticipating difficulties and challenges |
|
|
| Deciding on your approach to analysis |
|
|
| Designing with dissemination in mind |
|
|
| Clarifying roles, responsibilities and timelines |
|
|
Reflexivity and positionality
It is particularly important when conducting data-led projects related to ethnicity to pay attention to positionality and reflexivity.
Positionality refers to your understanding of who you are and how that shapes the way you ‘see’ things.[8] This includes factors such as your own race, ethnicity, nationality, gender, class, profession, your social and political beliefs and how these relate to the topic you’re investigating or the research participants. In short - it’s about who you are & where you ‘stand’, shaping what you see.
Reflexivity is the process of examining your own influence on the work you are doing, questioning and challenging your own thoughts and beliefs.[8] There are different strategies you can use to actively think about how your positions shape all parts of the research process. This includes how you frame the ‘problem’ you’re investigating and how you choose to study it. It also includes reflecting on the impacts on the data you collect, how you interpret your data and choose to share your findings.
At the research design phase, consider questions such as:
How are my personal or professional identities shaping the research questions I’m asking?
What power dynamics can I anticipate between the participants and me (as an individual and representative of the council)?
How might I (as an individual and representative of the council) influence participants responses or engagement in the project?
Why am I (as an individual and representative of the council) choosing this particular method to investigate this problem and is it the best one to use on this topic or with this population?
Whilst practicing reflexivity is traditionally associated with qualitative work, it should be practiced by those undertaking quantitative work too.
Moving beyond traditional qualitative methods
When seeking to understand resident or local system partners experiences, we often use focus groups and analyse the discussions using a descriptive form of thematic analysis. Whilst these are valid approaches, they are somewhat limiting. There are other methods which are particularly valuable in helping us understand ethnicity, inequity and racism in relation to public health. These are just a few:
Critical Ethnography: an approach which incorporates observation, interviewing and document analysis to develop an understanding of power relations and dominant framings of issues in order to then challenge and address them.[9]
Critical Discourse Analysis: a method which can help us understand the ways in which power circulates through language. It can be applied to analysis of materials such as policy documents, service specifications, traditional and social media content and other materials.[9]
Counter-storytelling approaches: an approach to interviewing/focus groups which actively seeks to avoid issues of re-traumatisation and extraction that these methods can sometimes (unintentionally) generate.[9]
Participatory Action Research: an approach to research that is co-produced and seeks to empower communities through inclusion.[9]
If you are interested in finding out more about these methods and whether they may be suitable for your project. Speak to .
Ethics
Whilst much data-driven work within Camden’s Public Health Team does not currently require a formal review by an institutional ethics review board (i.e., because it is classed as audit, needs assessment, service evaluation or consultation), this does not exempt us from conducting our work to the highest ethical standards. Always consider how to operationalise the following ethical principles in your work:
Maximise benefits for individuals and society
Minimising harm (to participants and researchers)
Respect for rights, dignity and cultural sensitivity
Voluntary & informed consent for participation
Integrity, transparency and mutual benefit
Responsibility and accountability clearly defined
Considering equality, diversity and inclusion in all stages of the process (including in the project team)
Maintaining independence or making explicit conflicts of interest
Outputs being freely accessible to amplify impact
These principles [10] apply to work on any topic and with any population group, not just those seeking to understand ethnicity, inequity and racism by conducting primary data collection with people from minoritised ethnic groups. Whilst these principles are universal (but not exhaustive), they may require different approaches to being applied in practice depending on your topic/population of interest.
Table 2 below details some practical steps that can be taken to implement these principles in your own projects. Please note these are suggestive, not comprehensive.
| Ethical principle(s) | Practical actions |
|---|---|
| Maximise benefits for individuals and society; responsibility and accountability clearly defined |
|
| Minimise harm |
Minimising harm to Participants:
Minimising harm to Staff:
|
| Voluntary & informed consent for participation | Ensuring participant information sheets are written in plain English and/or translating materials into relevant languages (e.g., using LanguageLine). |
| Integrity (honesty, transparency, accountability, respect, rigour) |
Make sure you build in enough time in your project plan to properly analyse your qualitative data, or you risk findings being ‘thin’ and descriptive. You need time to ‘listen beyond’ and do interpretive, reflexive analysis. Be honest in reporting your findings and being rigorous in your analysis e.g. paying attention to and report on disconfirming cases. Consider carefully the impact of your reporting on individuals and communities. Ask yourself, would they ‘see’ themselves in your interpretations, would they feel respected and well-represented? |
Sampling & recruiting ethnically diverse participant groups
Depending on your research question, especially if it focusses on understanding inequality (rather than the experiences of a single ethnic group) consider the following points. For surveys, consider:
Boost sampling to collect large enough samples of ethnic minority participant groups
Ensuring sample includes White British participants, to construct comparative samples
Using weightings to adjust the sample to more closely reflect the target population post-hoc
For interviews or focus groups, you might also want to consider recruiting ethnic majority participants (i.e., White British) in your sample and conduct a comparative thematic analysis, paying attention to differences in experiences between participants of different ethnicities. This approach is particularly useful for examining and potentially challenging common assumptions relating to ethnicity and health.[11]
If you are conducting focus groups, it’s important to carefully consider group dynamics when deciding who to include in groups. Consider:
Could a group which includes both ethnic majority and minority participants impact disclosures of experiences of racism?
Could a group of participants who share the same ethnic identity, but not other characteristics (e.g., age, gender, socio-economic status) feel able to speak freely about their experiences?
If your topic is sensitive, could a 1:1 interview be more appropriate?
Recruiting participants from minoritised ethnic groups can sometimes be challenging. To understand this, it is important to recognise the histories of public health & medical research, how aspects have been harmful to groups and acknowledge the legacies and impacts this has on minoritised ethnic groups.
As a council officer there will often be a perceived power imbalance with respondents so consider involving community members and those with lived experience. Additionally offering non-direct or anonymous routes of input and evaluating the success (or otherwise) of your data collection can provide useful validation.
You may have to think creatively and put more time and resource in to recruiting diverse participant groups. Colleagues have a wealth of knowledge, local connections and experience so talk your ideas through with others. Here are some tips to get you started:
Recruitment materials
Be specific: say explicitly which ethnic group(s) you want to speak to.
Consider design: if using images, make sure they represent the groups you are seeking to recruit.
Language: use plain English and/or (where relevant) translate your materials into additional languages.
Culturally competent: ensure your materials and process are relevant and respectful of the context you are working in.
Getting the word out:
Speak to community champions.
Use area profiles and maps. Go for a walk, place posters in places people are likely to see them.
Pre-participation engagement
Make the time to build trust. Offer to call or meet participants beforehand to get to know them more informally before they agree to take part. This is good trauma-informed research practice.
Collaborate with relevant organisations within the Borough, including those with lived experience and other council departments such as Participation and Equalities.
Data collection
Recording ethnicity
Use self-identification
Ethnicity should always be self-identified by the individual, as it is a subjective and personal identity. Avoid making assumptions based on appearance or name.
Use the ONS categories
Use the Office for National Statistics (ONS) 2021 Census classification system to ensure consistency and comparability with national datasets.[12] The ONS categories are nested, meaning broader categories (e.g. “Black”) contain more specific subcategories (e.g. “Black African”, “Black Caribbean”). The categories are shown in Table 3.
The ONS categories should be used because they are widely used across government and public services. This means they enable meaningful comparisons across datasets including the 2021 Census, which allows for benchmarking against the Camden population.
| Broad groups | Narrow groups |
|---|---|
| Asian or Asian British |
Indian Pakistani Bangladeshi Chinese Any other Asian background |
| Black, Black British, Caribbean or African |
Caribbean African Any other Black background |
| Mixed or Multiple Ethnic Groups |
White and Black Caribbean White and Black African White and Asian Any other Mixed background |
| White |
English, Welsh, Scottish, Northern Irish or British Irish Gypsy or Irish Traveller Roma Any other White background |
| Other Ethnic Group |
Arab Any other ethnic group |
Ask for both broad and narrow categories. First, ask which broad ethnicity category (e.g. White, Asian, Black, Mixed, Other) someone identifies with. Then, follow up with a more specific subcategory (e.g. Indian, Pakistani, Black African), as recommended by the ONS. It is advised to allow respondents to see the narrow categories when selecting the broad category (e.g. ‘Other ethnic group (includes Arab and Any other ethnic group)’). Respect individual preferences by including a ‘Prefer not to say’ option.
In some cases, more granular data may be needed to reflect the diversity within some categories (e.g. disaggregating “Black African” or “White Other”). Also, some people may prefer to describe their identity themselves if they don’t feel they fit into the ONS categories.
If collecting more detailed information, you could also consider allowing a free text field in addition to selecting the closest ONS category. This ensures data remains comparable to other datasets, while also capturing more nuanced identities. Allow free text as a supplement, not a replacement, to avoid relying solely on free text, as it limits analysis and comparability.
Designing primary data collection tools
Always pilot surveys or topic guides before starting data collection. Doing this with members of the communities you’re seeking to engage can be particularly helpful for ensuring framing of particular topics or concepts are culturally appropriate.
Using strengths-based framing when designing your surveys or topic guides is important. It can be easy to fall into deficit framing doing work on inequality with topic guides asking about ‘barriers’, ‘gaps’, ‘poor uptake’, what’s lacking, what needs fixing. Whilst it’s important to discuss these subjective, it is also productive to ask about assets, resilience and community knowledge. This can help us to understand what’s working and also how people are already navigating challenges and systems which don’t work for them.
Ask your participants directly about ethnicity, identity, culture and different forms of racism. NHS Race and Health Observatory advise acknowledging and naming racism directly. For example, ask participants about whether they think any aspects of their identity (including their race or ethnicity) has ever impacted their care (positively or negatively). Ensure you ask these questions sensitively but also confidently. If you don’t, it could influence how participants feel disclosing experiences.
Dynamics and logistics of interviews and focus groups
If you’re working with an interpreter or co-facilitator, ensure they’re well-briefed on their roles in the group. Seek their input into the development of the topic guide before conducting data collection as they may have valuable insights in to how approach the discussions.
Carefully consider where you are conducting your interviews or focus groups. Always think about conducting your research where your participants will be most comfortable. Go out into the borough. Consider hosting in community centres, family hubs, schools, religious settings. If you’re conducting your interview or focus groups online, gently prompt participants to (if possible) choose a place to join the meeting wherever they feel most comfortable to talk about their experiences.
It’s part of good ethical practice to ensure you’re watchful for signs of emotional distress on your participants. Especially if there have been difficult disclosures such as relaying experiences of discrimination, not feeling heard or other things. Have a plan for how to respond.
Using secondary data
This section describes ethnicity recording in commonly used public health datasets.
Census
The 2021 Census provides the most comprehensive picture of ethnicity in Camden.[13] This should be used for benchmarking or finding out about the ethnicity profile of Camden, for example by ward or different age groups.
NHS health records
NHS records do not usually use the Census 2021 categories. They tend to use categories from the 2011 or 2001 Census.[14] The only difference between the 2011 and 2021 Census is the separation of Roma from Gypsy or Irish Traveller (previously these were one combined category). Other data, including Hospital Episode Statistics (HES) that PHI use to analyse hospital admissions, uses the 2001 Census categories. This has only 16 ethnic categories and does not include “White: Gypsy or Irish Traveller” or “Other ethnic group: Arab” categories. The Chinese ethnic category is also nested within the “Other” ethnic group, rather than the Asian group (where it was placed from 2011 onwards).
Recording of ethnicity in data from GP practices may be more accurate than hospital data sources as it is more likely to be the patient’s self-defined identity (for example based on a form when they registered). In a hospital or emergency care setting, accurate recording of ethnicity may not be a priority. Ethnicity data is also more complete in GP records (~93-97%) than hospital records (~77-78%).[14] Local GP data may also include some more detailed breakdowns than the ONS categories, but this is not always consistent.
Births and deaths data
Birth and death registrations data do not collect data on ethnicity, but they have other information that can be used as proxies. For example, nationality in the births data and country of birth in the deaths data.
Fingertips
Some Fingertips indicators can be stratified by ethnicity, but for the majority breakdowns by ethnicity are only available nationally.
Disagreement between different datasets
In some cases, someone may have different ethnicities recorded in different datasets, or within the same dataset over time. In these cases, the best approach is to use the ethnic group that has been recorded for that individual most frequently.[14] If ethnicity is only recorded twice, then the most recent ethnicity should be used.
Data analysis
Quantitative analysis
The recommendations for analysing quantitative data in this section apply to both secondary and primary data.
When analysing data to look at differences by ethnicity, caution is needed. Ethnic groups differ in many ways that can influence the outcome of interest. These include population size, age structure, geographic distribution, socioeconomic status, and need for health services.
Adjusting for population differences
Counts alone can be misleading. Always use a denominator (the size of the population at risk) when comparing outcomes across ethnic groups.
It is usually best to also account for the age distribution in your analysis. White British people tend to be older than other ethnic groups. As health status and service use are usually always related to age, this must be accounted for to avoid spurious trends.
To account for these differences, use age-standardised rates, such as Directly Standardised Rates (DSRs). This allows for fairer comparisons between groups with different age profiles. You can also consider standardising for sex in addition to age, but sex is less likely to vary by ethnicity.
To explore associations between ethnicity and health outcomes more robustly, consider using regression models. These allow you to:
Adjust for confounding variables (e.g. age, sex, deprivation)
Quantify the strength and direction of associations
Test for statistical significance
Contact the PHI team for support with regression modelling and standardisation techniques.
Whichever approach you are using, always report confidence intervals. These quantify the uncertainty around your estimates and help to interpret differences between groups. Confidence intervals are particularly important when dealing with small sample sizes, which is likely when analysing data by ethnicity.
Small numbers
Where possible use the more detailed ethnic categories, as broad groupings (e.g. “Asian” or “Black”) can mask important differences. However, small sample sizes may limit the ability to achieve statistically meaningful results. When dealing with small numbers:
Consider aggregating categories where appropriate, see recommended aggregations of the ONS ethnic groups in Figure 1 below
Apply suppression rules to protect confidentiality (e.g. remove any groups with counts between 1 and 5)
Be cautious in interpreting differences — observed differences may be due to chance when analysing small numbers. Confidence intervals should be used to interpret differences between groups.
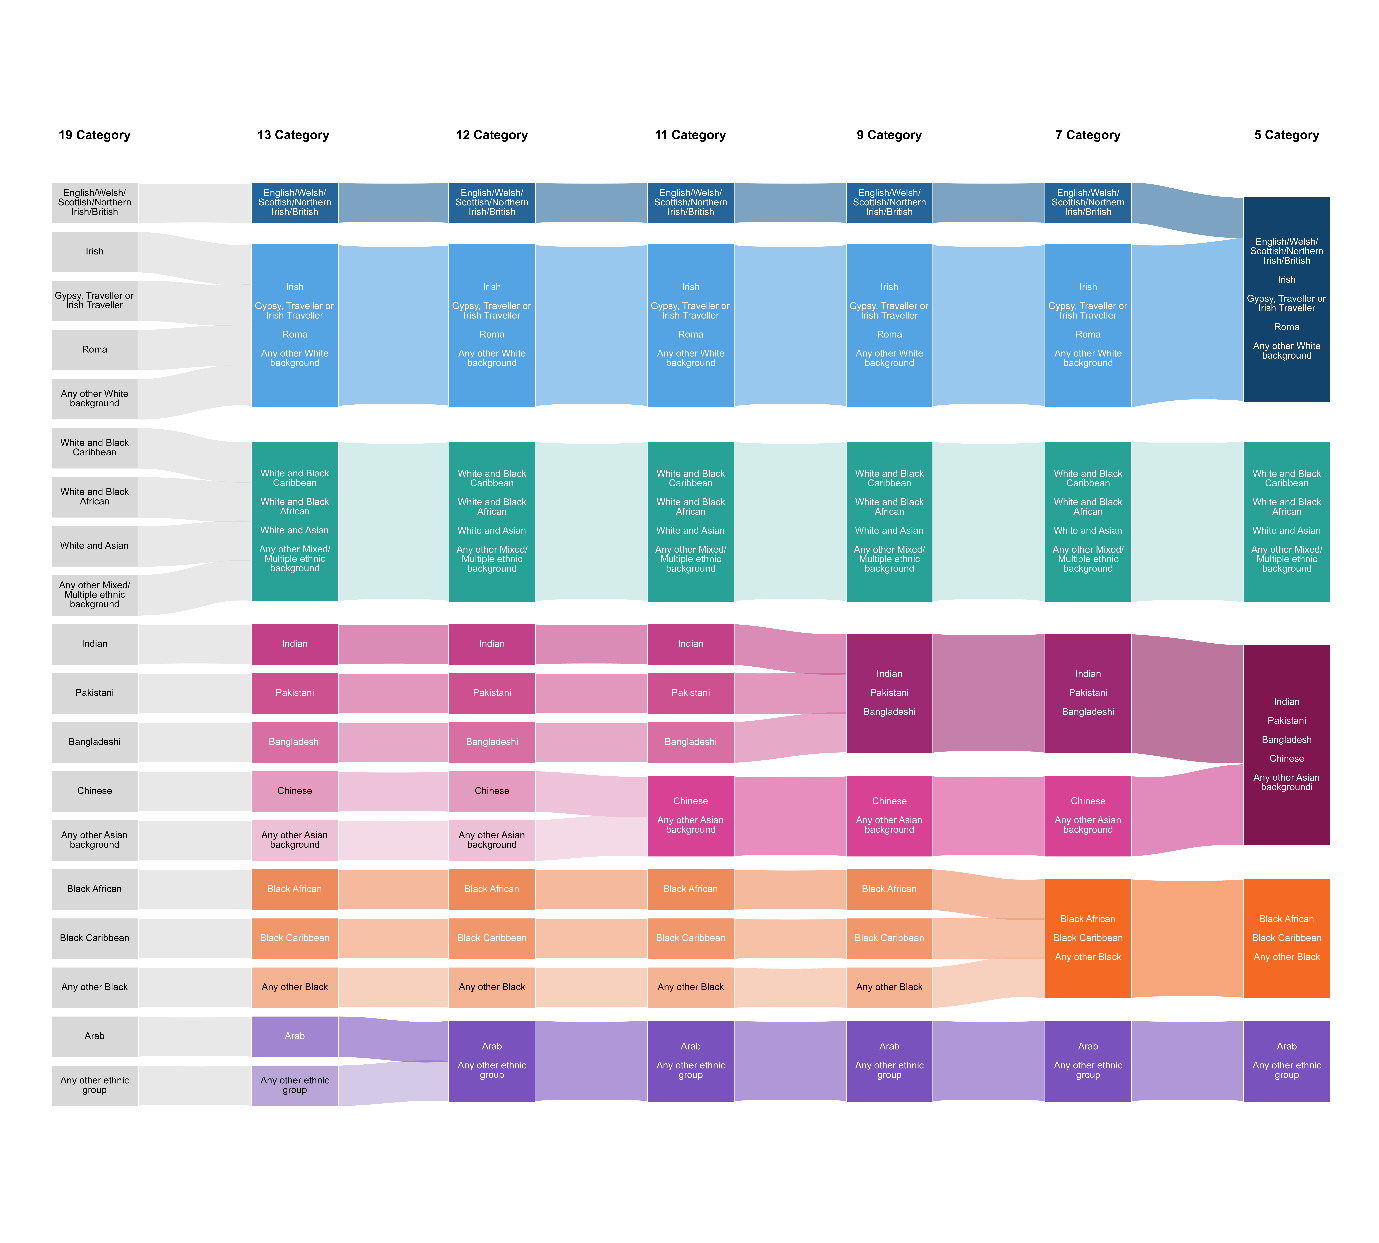
Figure 1. Recommendations on aggregating ONS ethnic groups[14]
Missing ethnicity data
The NHS Race & Health Observatory reports that ethnicity data recording is generally high but uneven across groups.[7] Excluding individuals with missing data can introduce bias. Alternative approaches include using:
Country of birth or nationality as proxies
Estimations based on existing population distributions
Efforts to improve data collection at service entry points
Interpretation of quantitative analysis
Interpreting results of quantitative analysis of ethnicity requires careful consideration of context, data quality, and underlying need.
Differences in need
Not all observed differences indicate inequality or inequity based on ethnicity. Consider whether the differences expected, based on other differences that vary by ethnic group and haven’t been accounted for in the analysis. These confounding factors could be demographics (e.g. age), health (e.g. prevalence of long-term conditions) or social (e.g. poverty or housing). Understanding the drivers of difference is key to drawing meaningful conclusions.
Who isn’t in the data?
Unequal access to services can lead to underrepresentation in datasets. For example, if a group is less likely to access primary care, they may be under-recorded in GP records. Always consider who might be missing from the data and how this could affect the validity of your findings.
Missing ethnicity data
Ethnicity is often not recorded or marked as “prefer not to say”. This missingness is rarely random, it may be associated with age, service type, or ethnicity itself. Missing data can bias your results. It is important to describe the extent and pattern of missingness to help understand what impact it may have on your results.
Impact of combining groups
Broad ethnic categories (e.g. Asian, Black) can hide important differences between subgroups. For example, health outcomes for Indian and Bangladeshi populations may differ significantly, despite both being classified as Asian.
Where possible use granular ethnic categories. If this is not possible, avoid overgeneralising from aggregated data and be transparent about limitations. You may wish to draw on larger studies or populations for more robust evidence.
Qualitative
Allocate plenty of time for analysis. If you spend too little time with your data, you risk having superficial and overly descriptive analysis.
Be attentive to the dangers of essentialising, homogenising and pathologizing. Essentialising is believing that groups possess inherent, unchanging characteristics that universally define them. This can limit your capacity to see complexity as you are analysing and can lead to reinforcing of stereotypes and homogenising different ethnic groups experiences. Look for complexities & nuance in what participants are telling you. Pay attention to disconfirming cases. Ask yourself if your conclusions are unintentionally pathologizing. Pathologizing means framing cultural norms, practices, identity or behaviour as problematic. It’s important to safeguard against pathologizing groups. An example of how to do this would be thinking critically and carefully about the way that the issue of overcrowding within multi-generational households is framed.
Practicing reflexivity is actively thinking about how your identity, beliefs and positions are informing what you’re seeing and how you are interpreting. Put this in to practice by having discussions within your project team or through writing reflective memos if you’re working independently. Don’t do this as a performative or descriptive exercise. Think hard about your position and how that shaped the analysis. Ask yourself questions such as: What are your blindspots? What surprised you, or what didn’t surprise you? What did you find yourself focussing on in people’s stories? Who were you not able to speak to and why?
Always think intersectionally by considering the role that gender, socioeconomic position, disability and other social categories interact in shaping your participants experience. Don’t think of these things as separate variables. Aim to connect what your participants say is happening to them, to why it is happening and consider the role that different systems of power (e.g., racism, sexism, ablism) might have played in their experiences.
Go beyond the traditional ‘tools’ of public health to inform your analysis. Fields such as sociology and anthropology have powerful conceptual frameworks for understanding inequality. If you’re not sure where to start, speak to other colleagues in PHI about concepts you can use to do theory-driven analysis.
Involving others in analysis is another way to strengthen analytical rigour. Consider checking your interpretations of the data with a few of your participants (also called ‘member checking’), speak to someone outside of the project team. If you’re truly co-producing you’ll analyse your data with your project partners.
Dissemination and sharing learning
To share your findings and influence change, make sure you plan for dissemination early. Best practice includes doing stakeholder mapping right at the start of your project and reviewing throughout. This is a helpful tool for dissemination planning. Develop this further by outlining who you want to share findings with and reflecting on what the best way of sharing the learning is. For example, is this by speaking at a community event, presenting at a conference, hosting a policy breakfast, writing a peer-reviewed journal article, producing infographics or animations?
Precision and specificity of language: Be mindful of the language you use when reporting. Be precise where it is possible to be precise and avoid acronyms and initialisms (e.g., BME). NHS RHO have principles that are useful to follow.[15]
For qualitative methods, centre participant voices. If you have consent to do so, use direct quotes from your participants. When editing quotes, retain patterns of speech so your participant’s voice is fully represented. As our work is hyper-localised it is important to be especially attentive to issues of anonymity and identifiability when reporting on resident’s experiences. Some communities in Camden are small & well-connected, so be mindful of this when reporting. If in doubt return to your participant to check it’s OK to include.
As advised above with recruitment materials, use visuals in project outputs that represent and reflect communities/participants.
ALWAYS share back with participants in mediums that are accessible. There are high levels of mistrust of healthcare & government in some communities. There is also consultation fatigue from communities being asked for their opinions & experiences again & again and nothing then changing. A way of building trust with communities is keeping dialogues going, sharing back. Make sure you do this and be clear on what will and won’t change as a result of the work you are doing and when any change is likely to happen. It is important to do this in ways that are appropriate for the group you’re engaging with. Creating infographics or “What we heard, who we told, what we’ll do now” summaries are good places to start.
Useful Resources
For further questions, please contact the .