Demography
Estimating the population
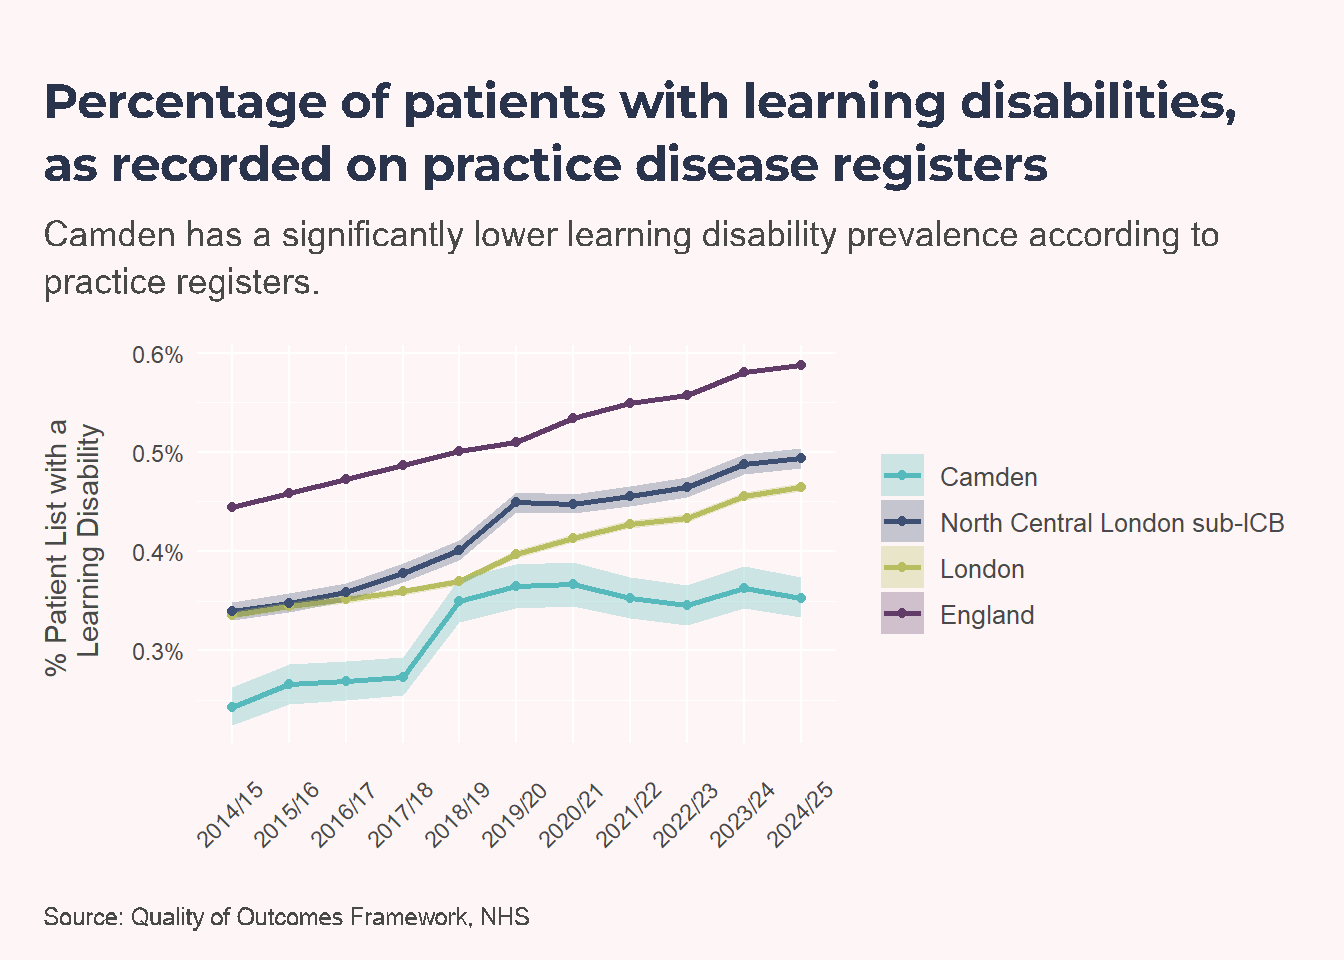
The most comprehensive identification data source of adults with a learning disability in England is the GP Learning Disability Register. The purpose of this register is to create a contact list to whom GPs can offer the free health checks to which they are entitled. According to this measure, 0.35% (n = 810) of people registered with a Camden GP had a learning disability. This is significantly lower than the values for NCL sub-ICB (0.49%), London (0.46%) and England (0.59%).
Using the Learning Disability Register as a proxy to estimate prevalence should be done cautiously. Camden could have a similar underlying prevalence to the other geographies, but a smaller proportion of its learning disability population may be known to a GP and therefore recorded on a practice register.
Between 2017/18 and 2018/19, there was a significant increase in the proportion of the patient list in Camden on the Learning Disability Register. However, since then the figure has plateaued while the proportion in all other geographies have continued to increase. WHY?
An alternative estimate for current prevalence uses ethnicity and mortality data to estimate need. PANSI applies the latest ONS sub-national population projections (2025) and a methodology developed by Emerson and Hatton (2004), with prevalence base rates adjusted for ethnicity and mortality.
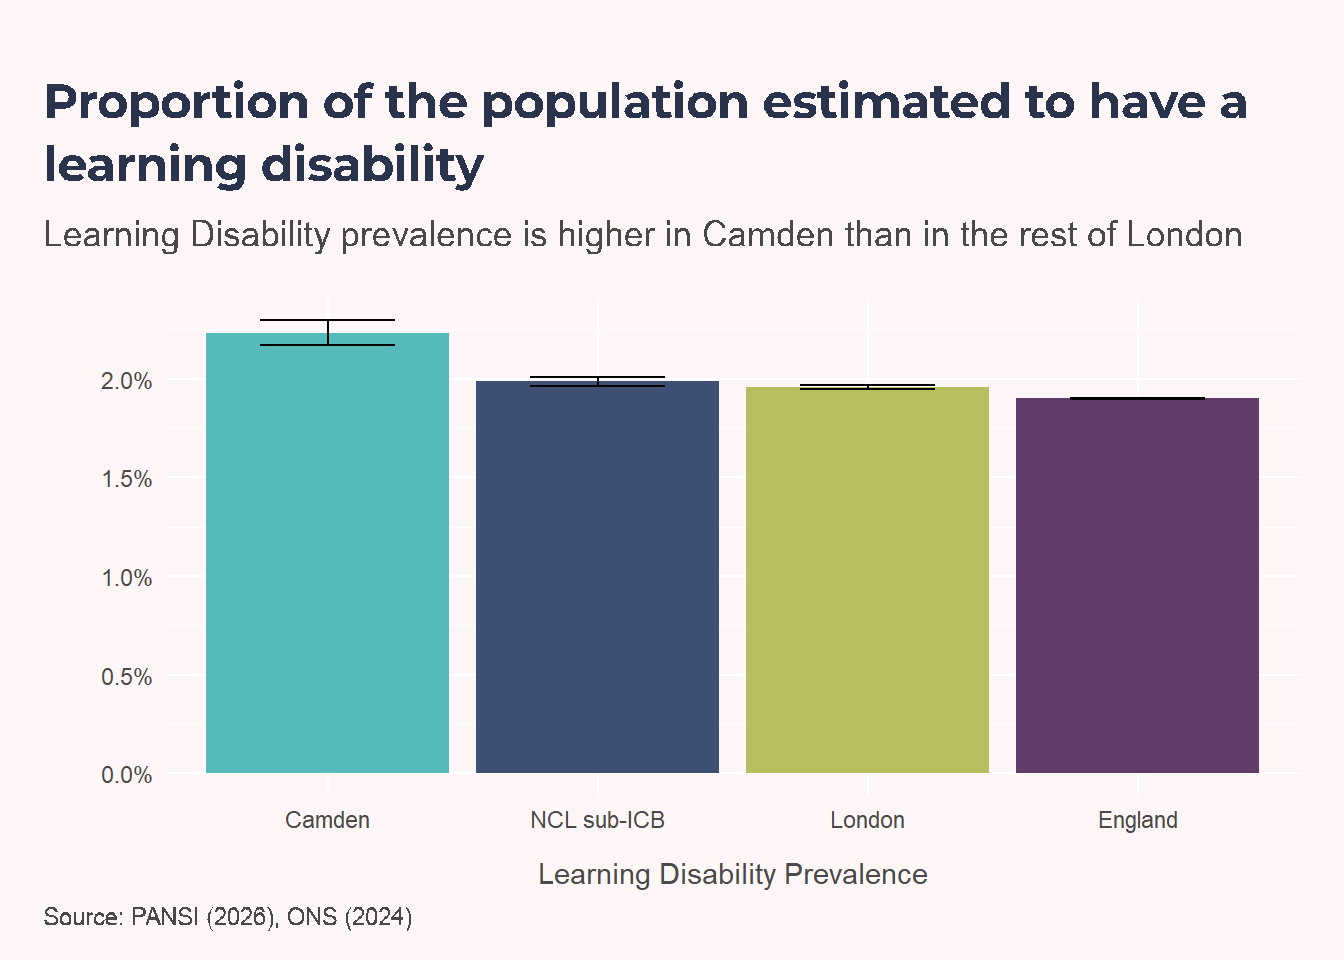
According to PANSI, there are 4,844 adults currently living in Camden who are predicted to have a learning disability. This is equivalent to 2.23% of the adult population, which is higher than the proportion estimated for North Central London (1.99%), London (1.96%) and England (1.90%).
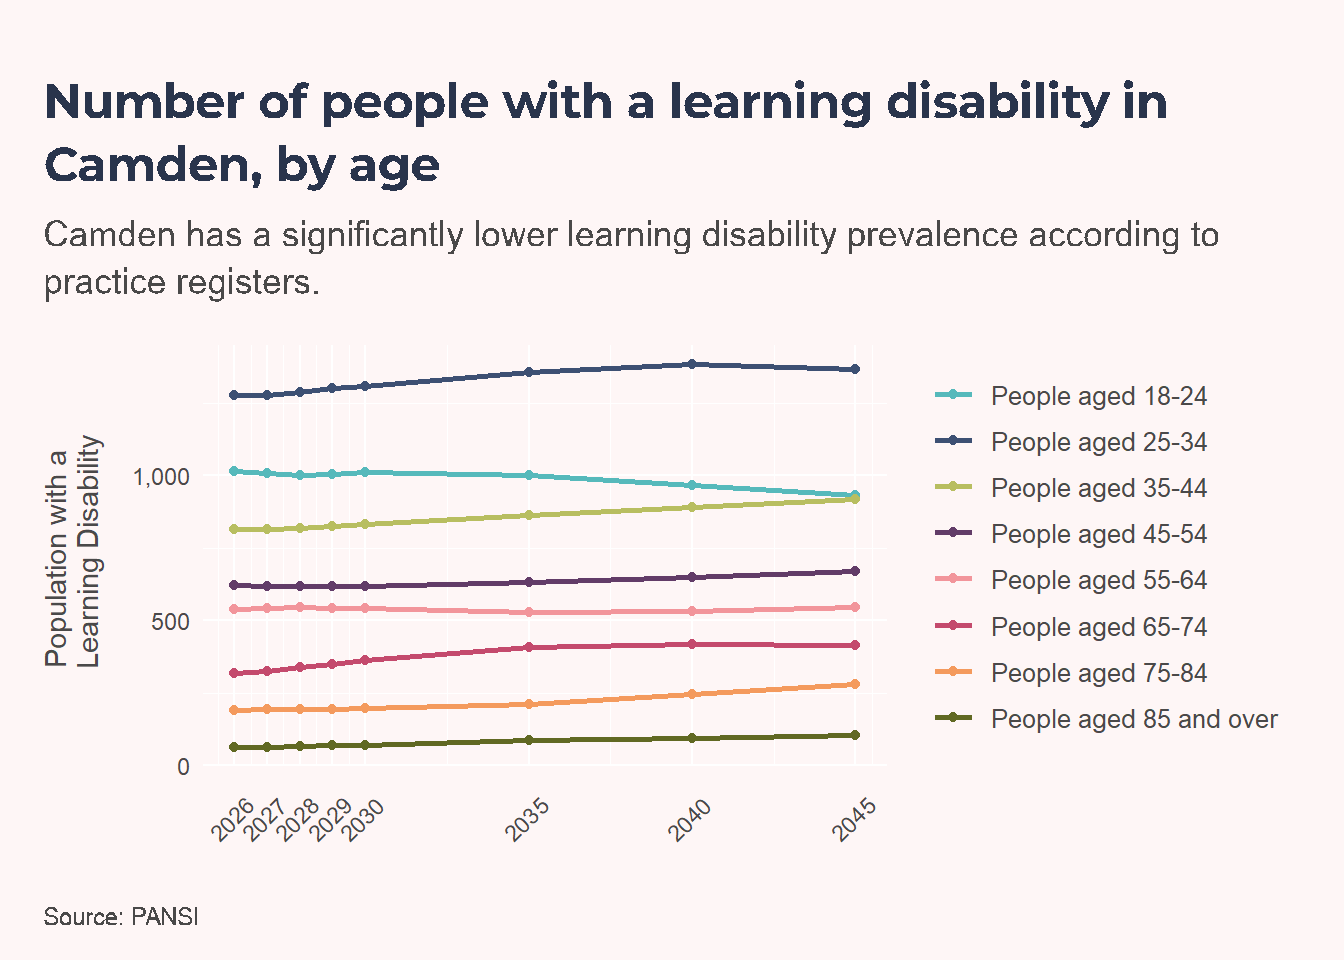
This difference is driven largely by Camden’s younger population profile, because PANSI assigns higher prevalence to younger adult age groups. However, PANSI does not adjust for an area’s local ethnic composition, so it may under-represent need in areas with higher-than-average South Asian populations and over-represent need in areas with lower-than-average South Asian populations (Emerson et al., 1997).
Projecting the population
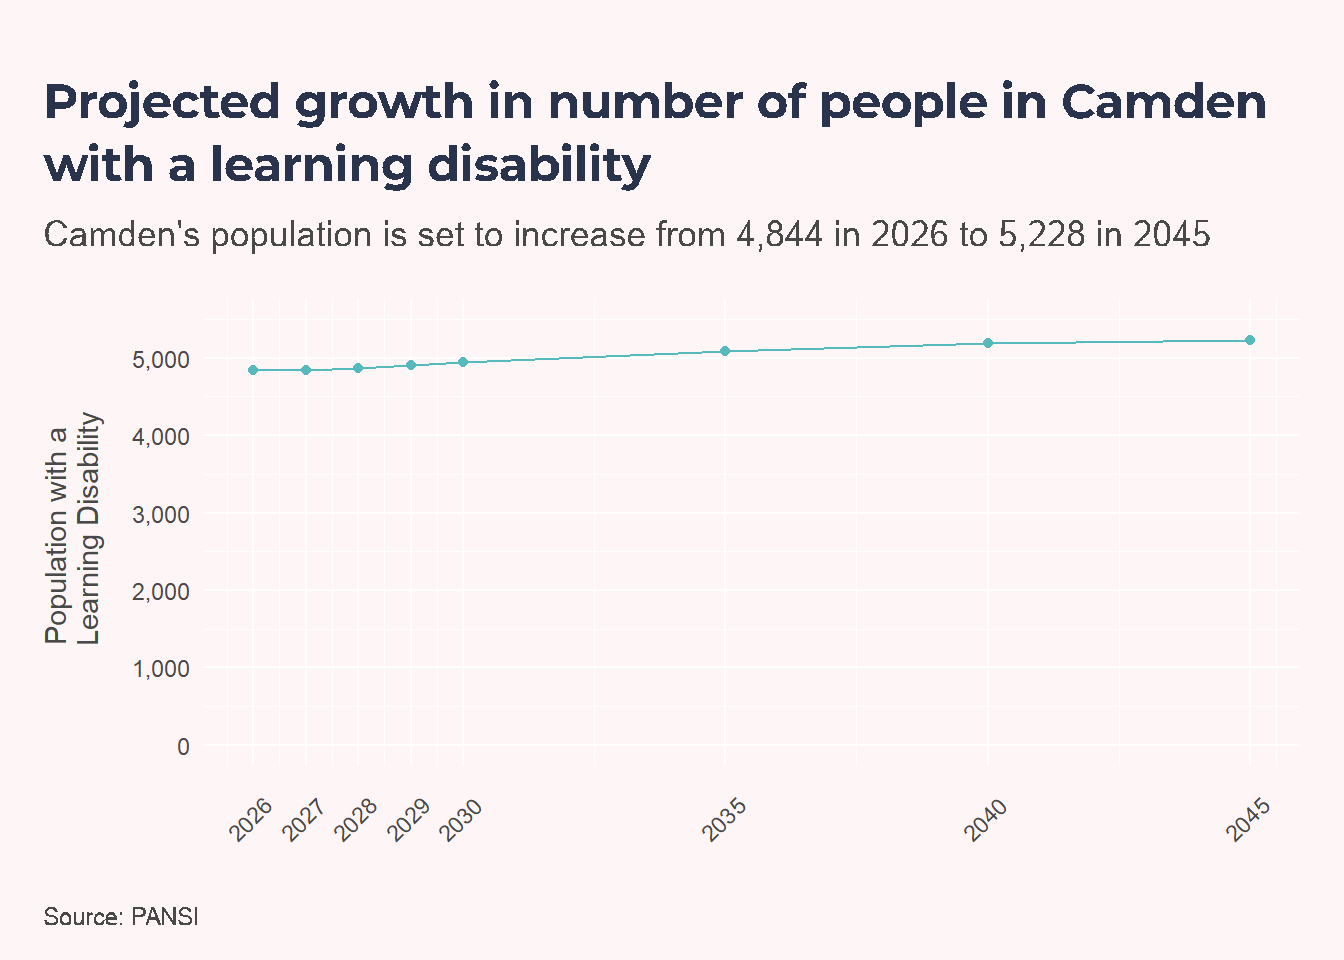
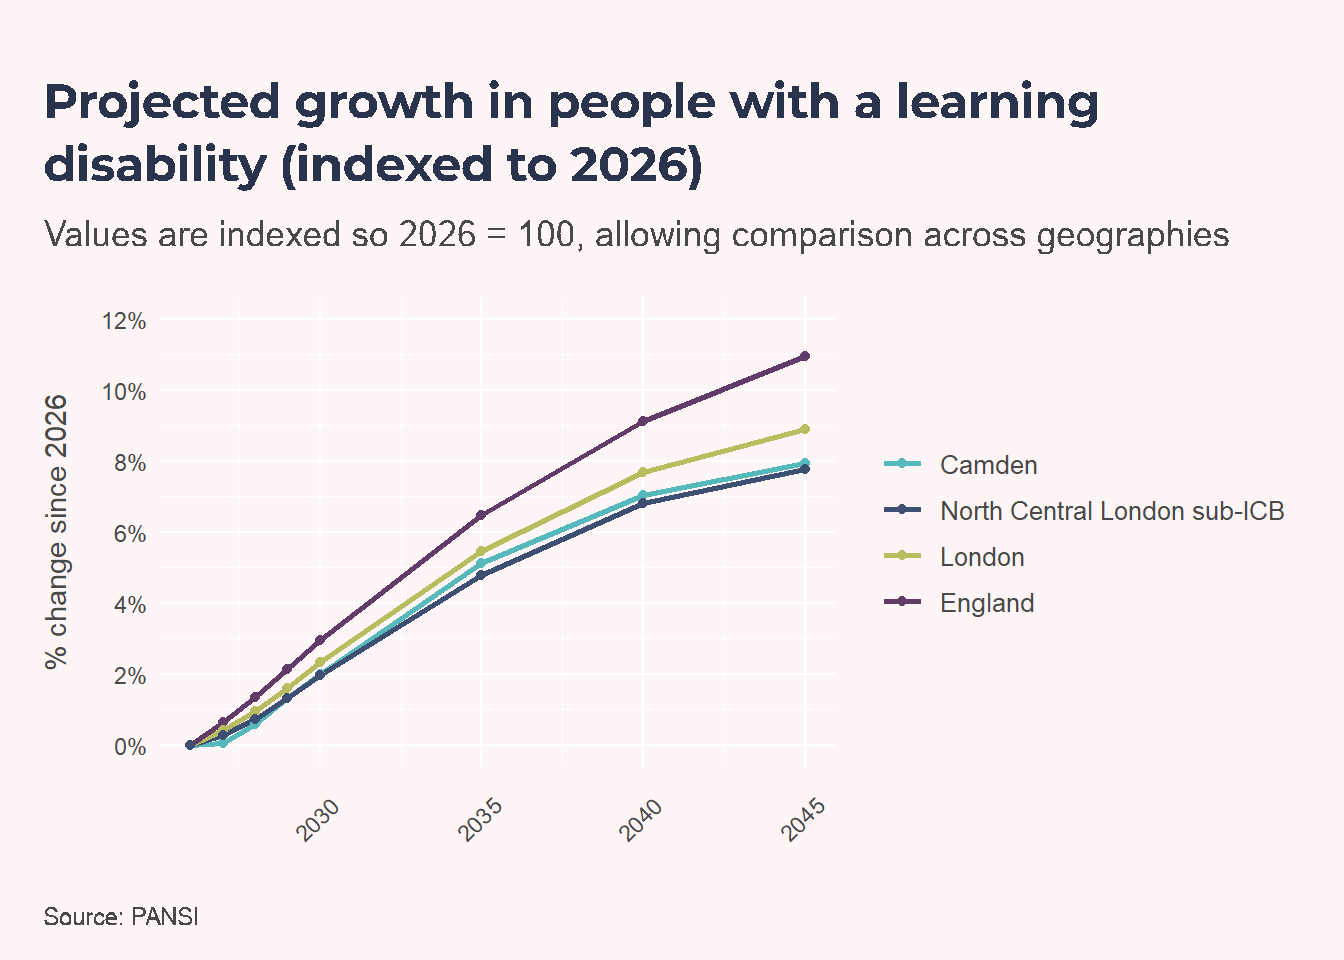
PANSI projections suggest growth in the number of adults with a learning disability in Camden from 4,844 in 2026 to 5,228 by 2045. In relative terms, Camden’s projected increase is 7.9%.
These projections are based on national modelling assumptions and are useful for planning. They are not derived from a Camden-specific measured prevalence estimate, so they should be interpreted as scenario estimates rather than a direct measure of local underlying prevalence.
Health
Prevention and annual health checks
Current snapshot (2025-26)
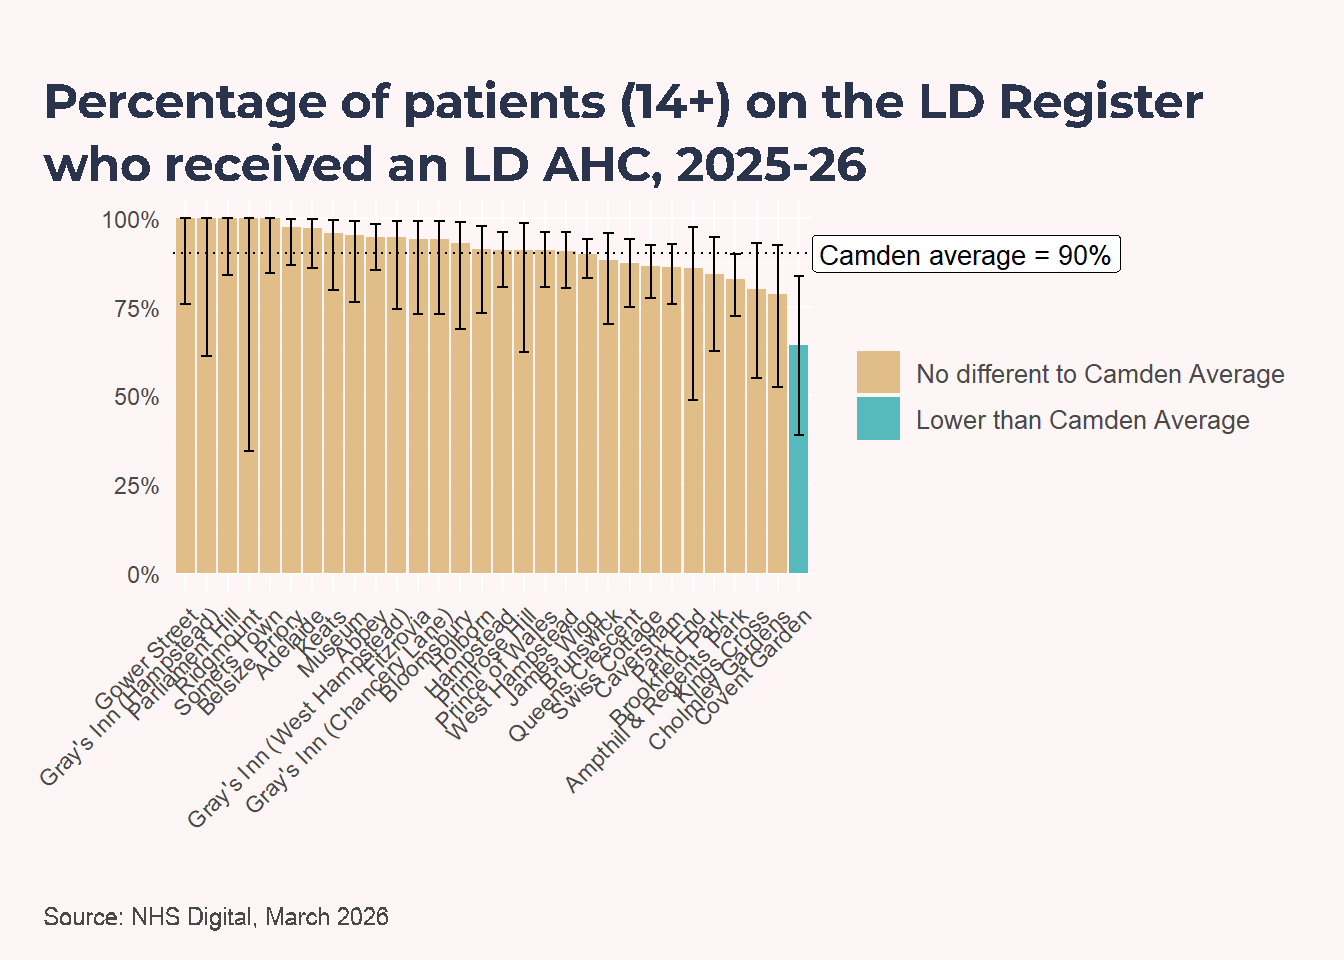
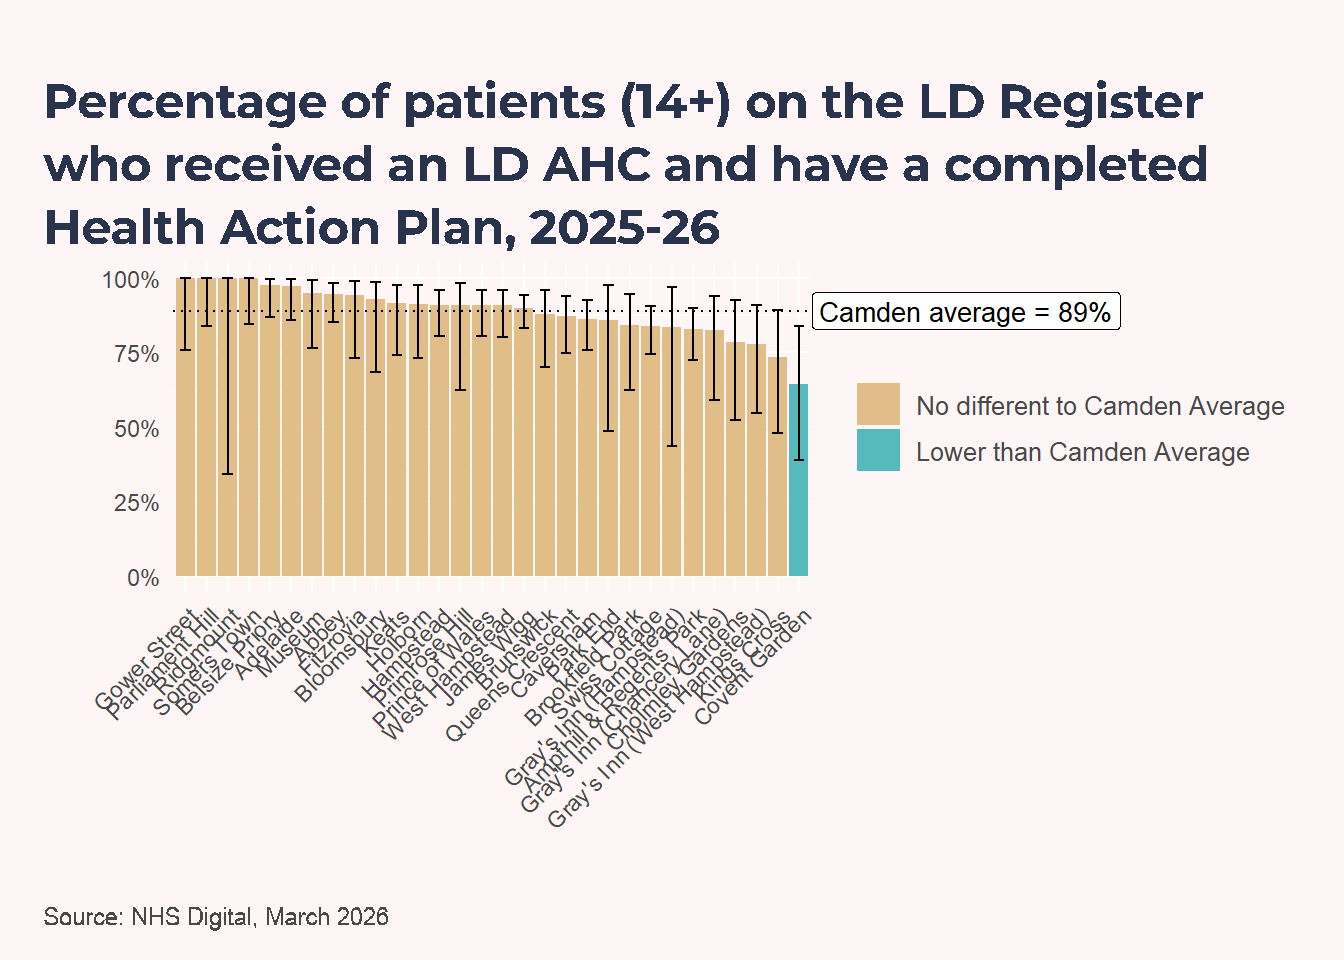
Current practice-level data show variation in annual health check coverage and completion of health action plans. The charts compare each practice with the Camden average and indicate where differences are statistically compatible with random variation versus materially different performance.
Change since 2023 by practice
NoteTechnical Note
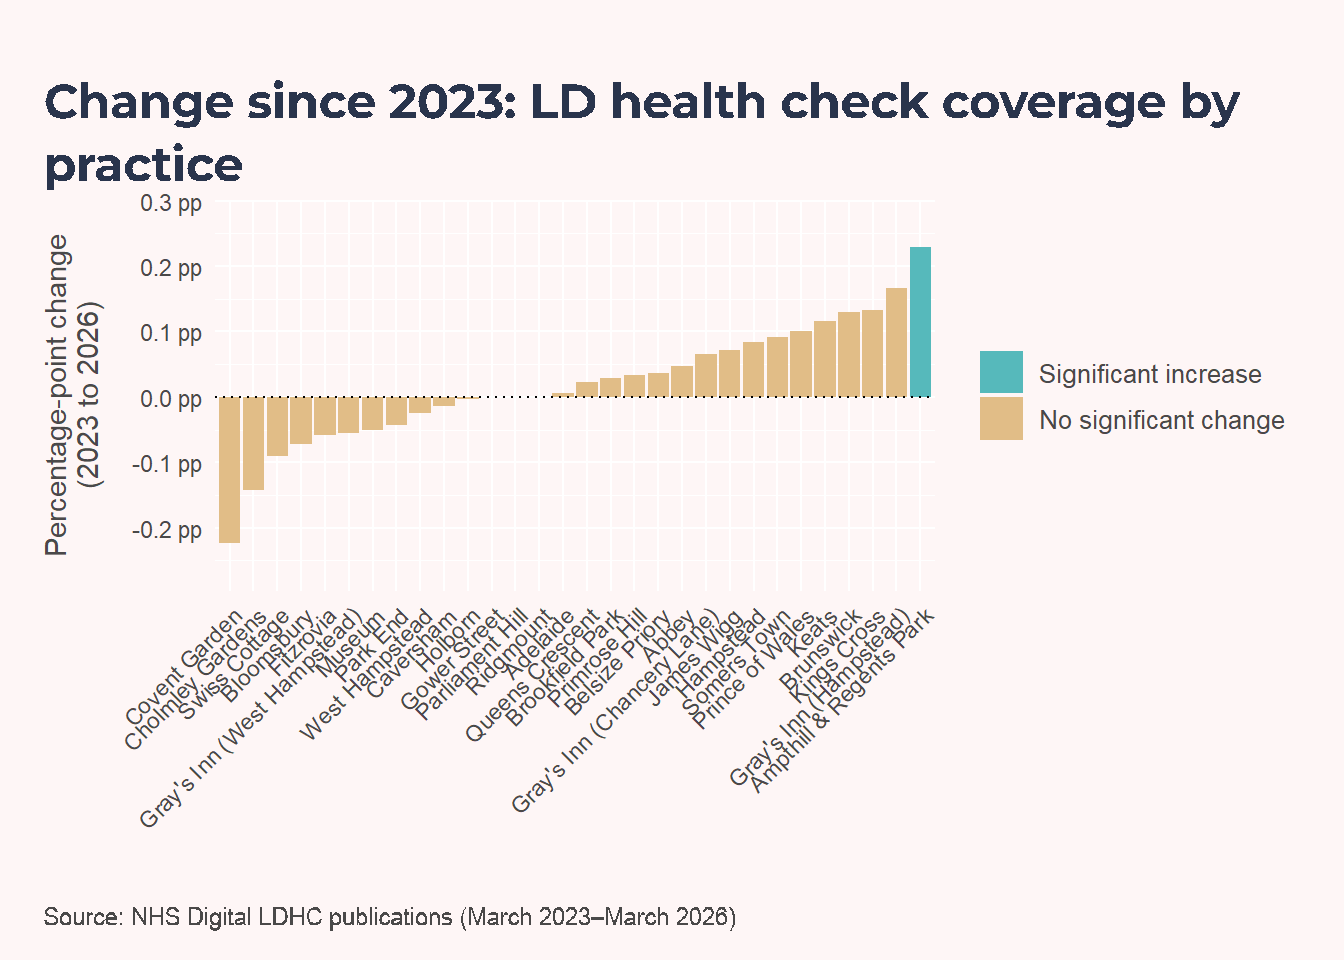
From March 2023 onwards, NHS Digital changed the LD health check data structure to indicator-based records with explicit numerator and denominator fields. March 2022 uses legacy coding with a different structure, so it is less directly comparable with later files. To keep methods consistent across years, these change plots use a 2023 baseline.
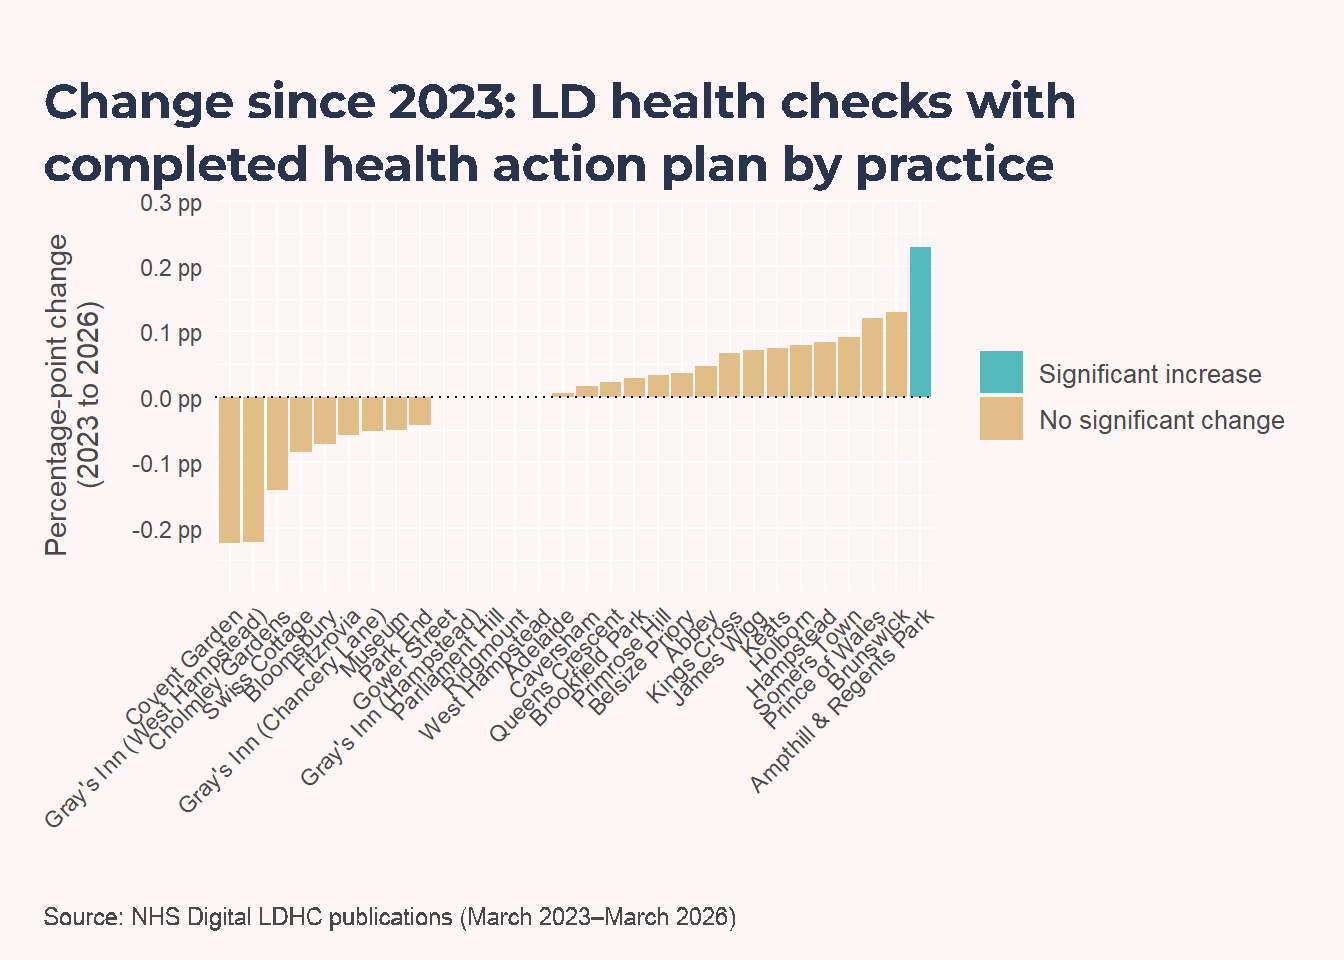
These change charts take 2023 as their baseline, as this is the earliest year which can be reasonably compared with 2026, due to coding changes. Across both measures (with and without a completed health action plan), 29 practices show no significant change, 0 show a significant decrease, and 1 practice shows a significant increase in coverage: Ampthill & Regents Park, by 22.9 percentage points.
Camden annual trend (2023 to 2026)
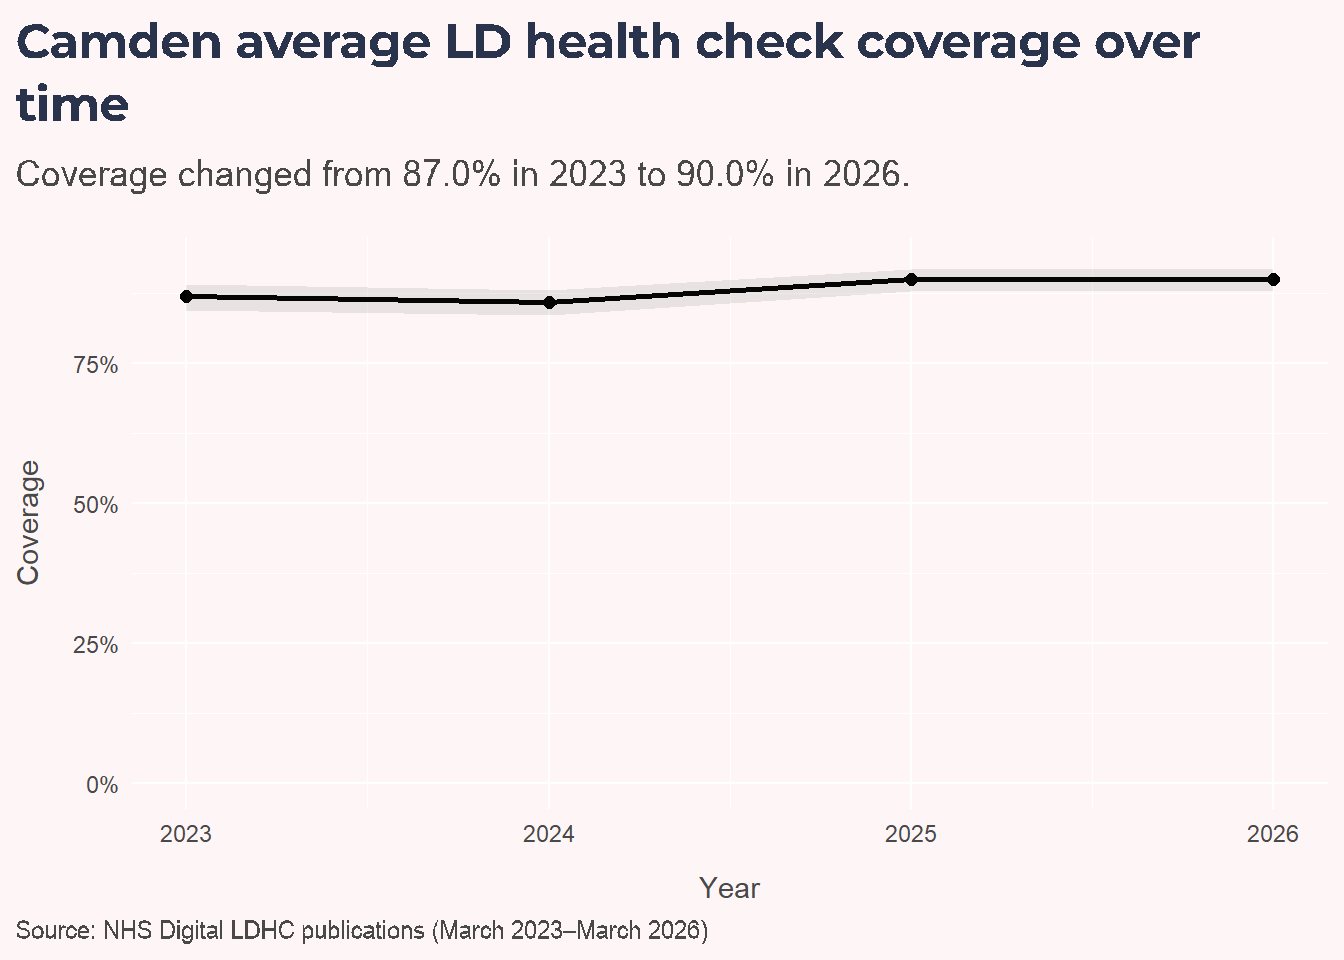
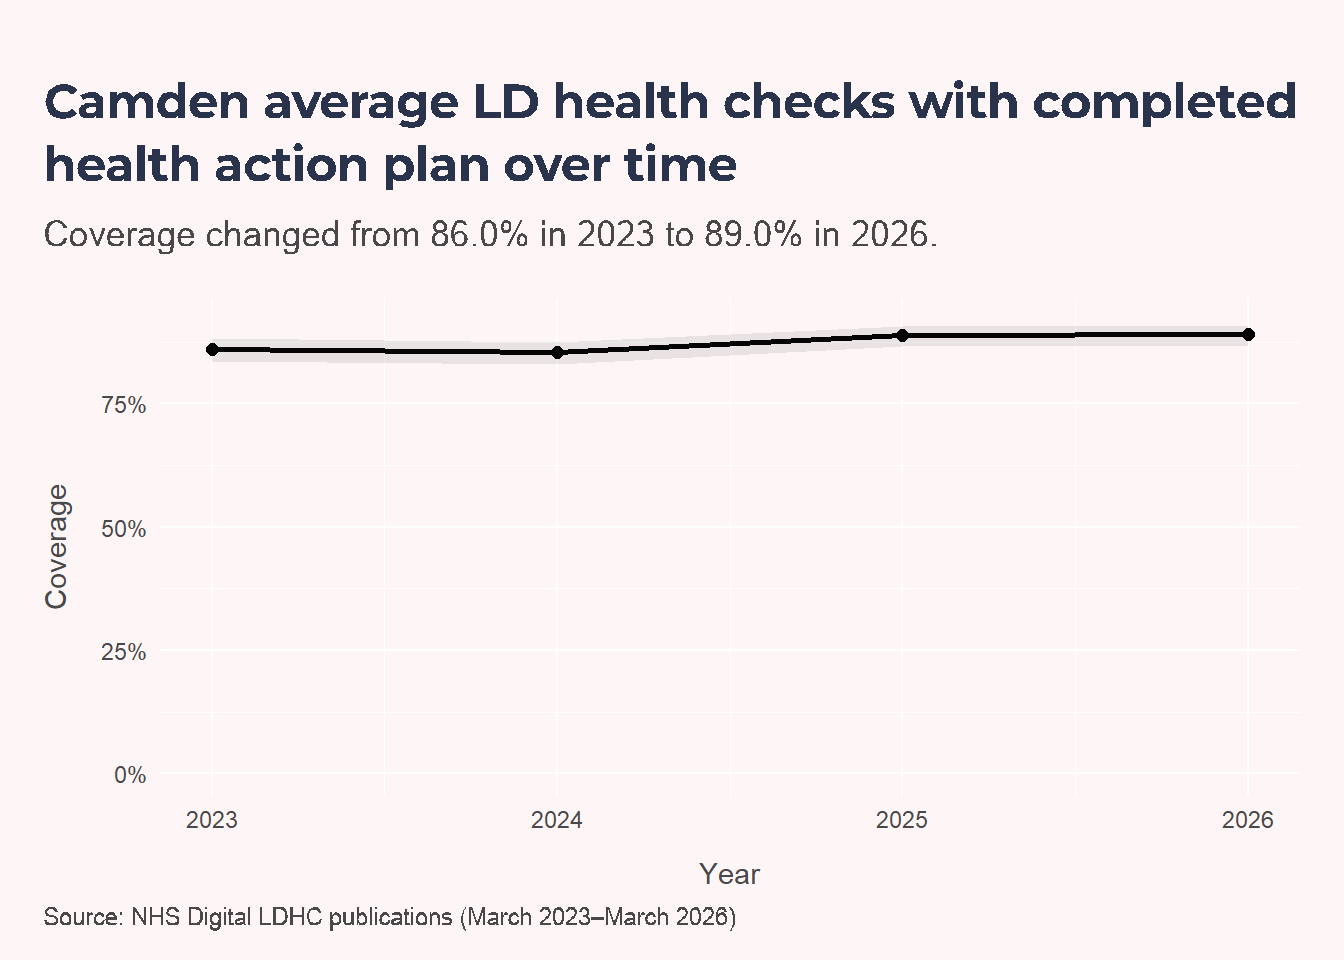
Annual health checks showed a significant increase in the last 3 years (87.0% in 2023 to 90.0% in 2026; 3.1 percentage points). Annual health checks with completed health action plan showed no statistically significant change (86.0% in 2023 to 89.0% in 2026; 3.0 percentage points).
Co-occurring conditions and prescribing (NCL, 2024/25)
NoteData Availability
At the time of writing, Camden-level primary care data were not available to Camden Public Health Intelligence due to ongoing migration of data to the Snowflake platform. Once these data become available, this section will be updated with a Camden-specific analysis including, where possible within statistical disclosure limitations, additional demographic breakdowns such as ethnicity and deprivation.
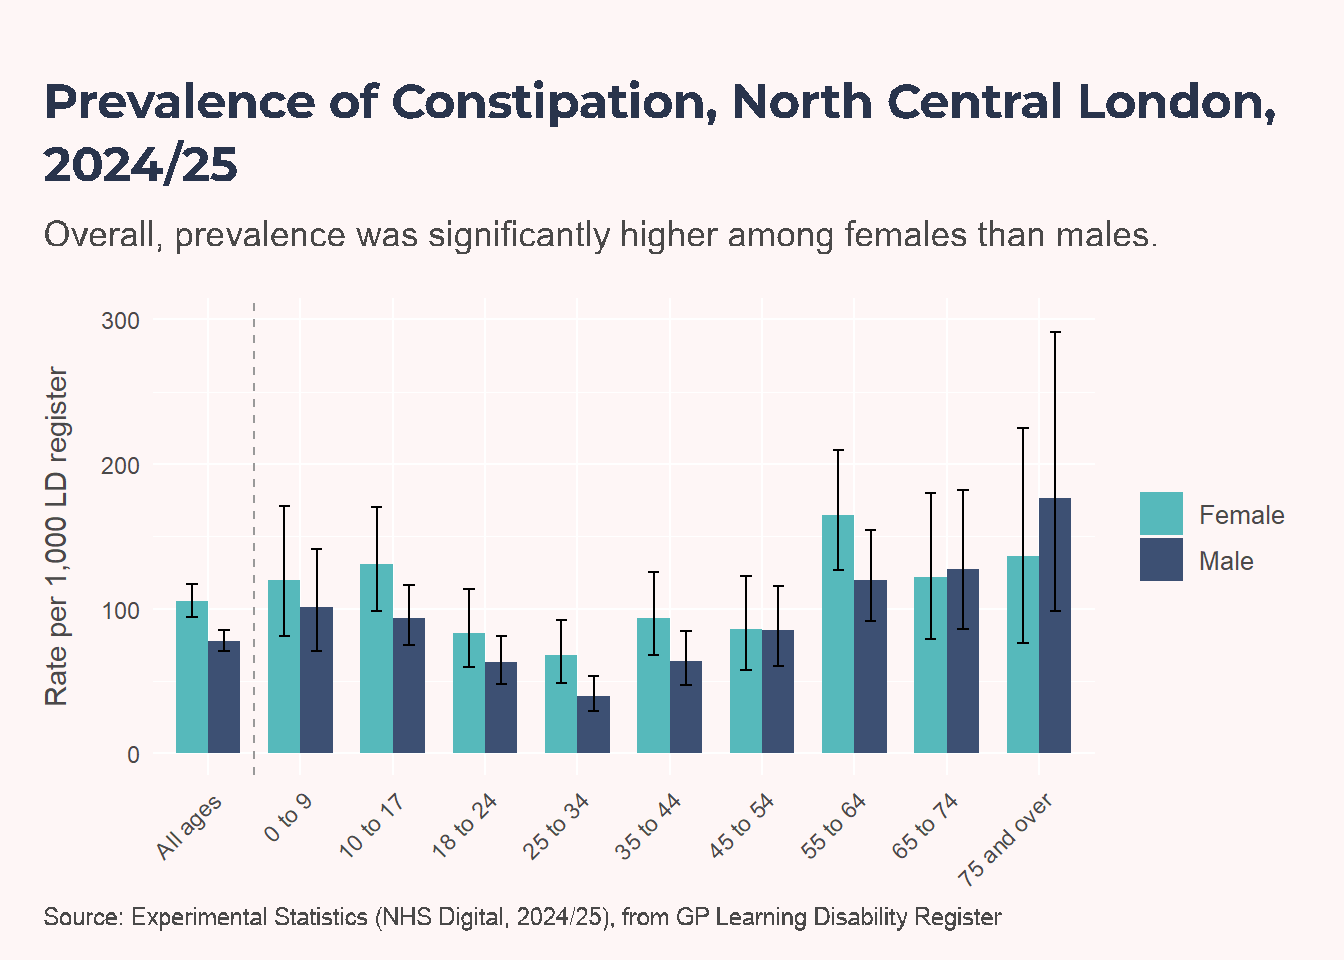
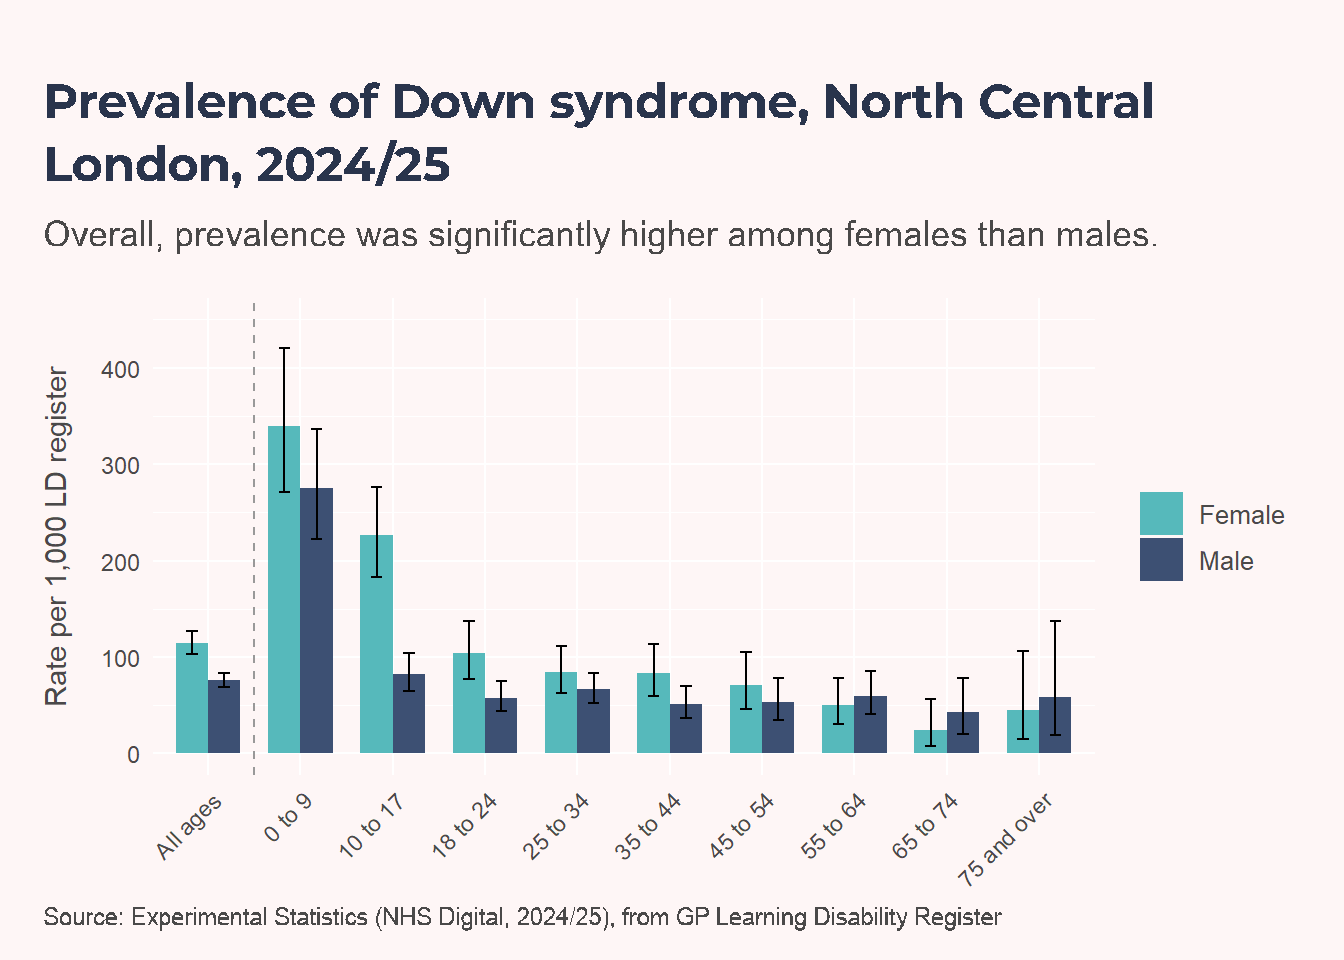
In the meantime, this section uses NHS England’s Health and Care of People with Learning Disabilities Experimental Statistics (2024/25). These statistics are derived from the same underlying primary care dataset but, as a public release, are only available at Sub-ICB Location level. As a result, findings are presented for North Central London rather than Camden and are limited to breakdowns by age and sex.
BMI
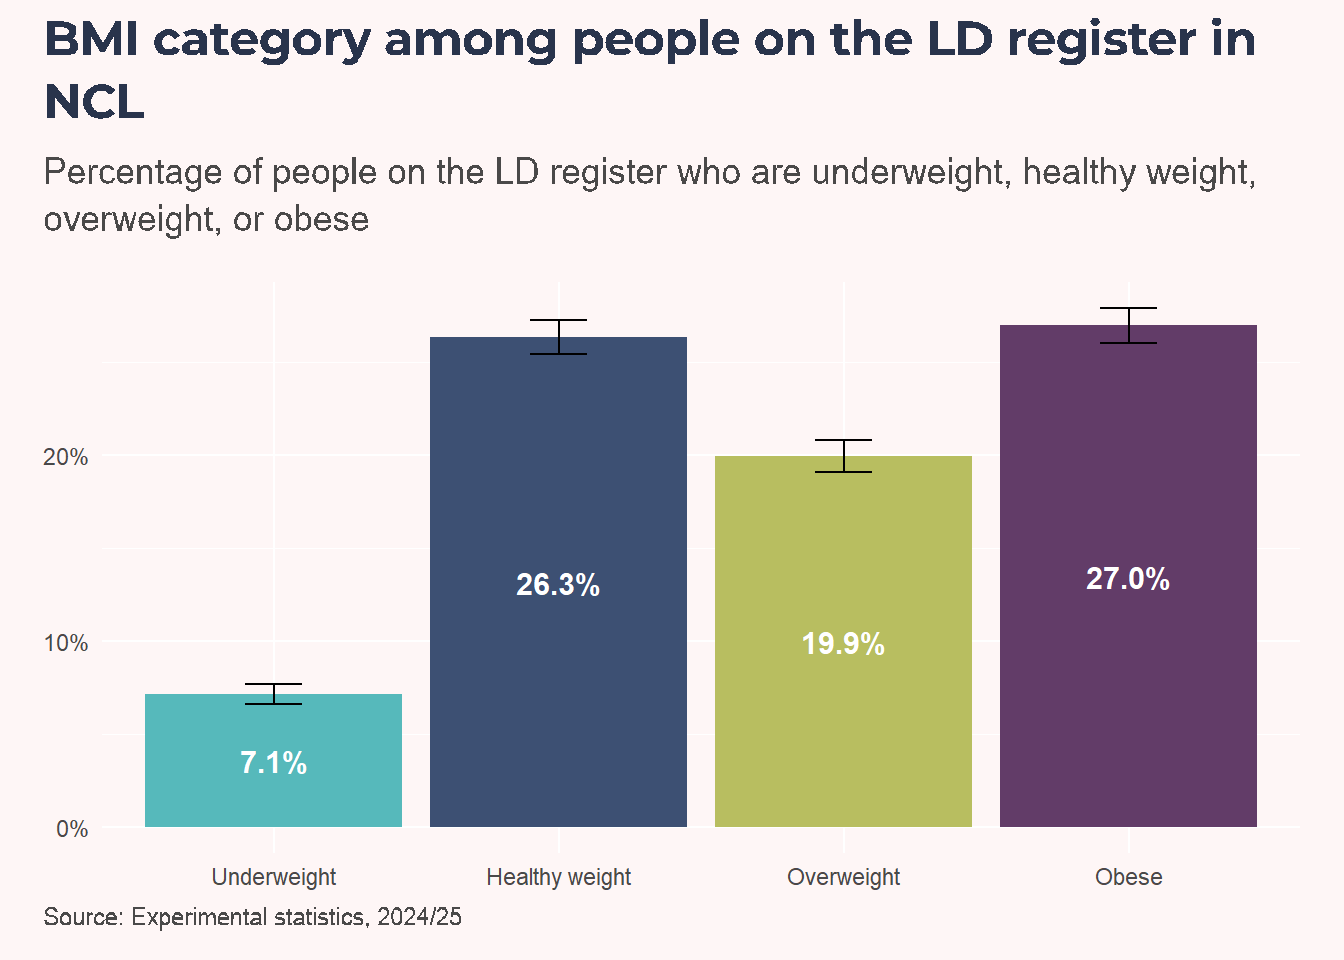
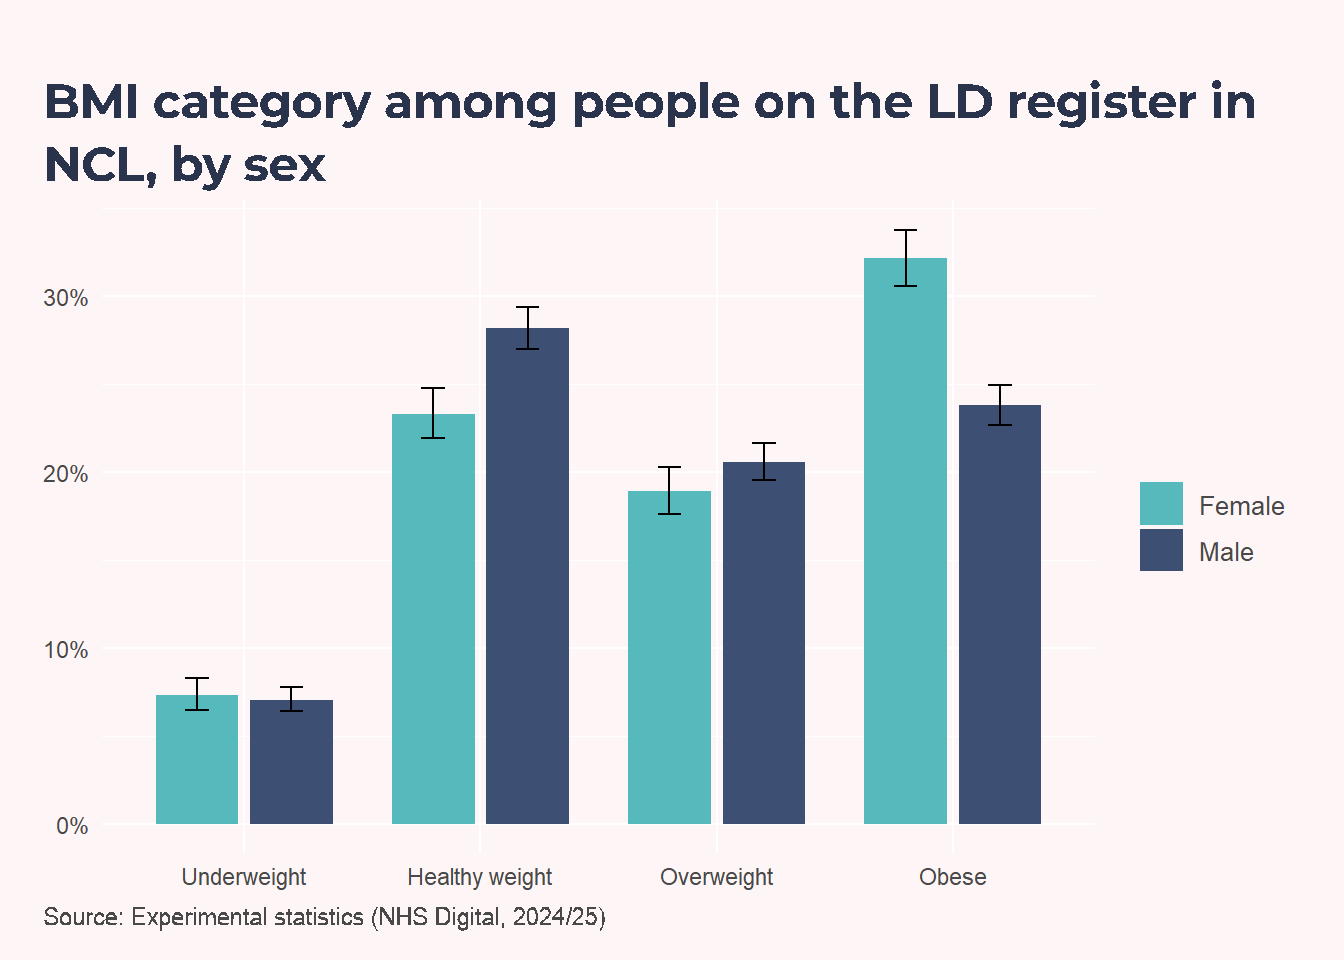
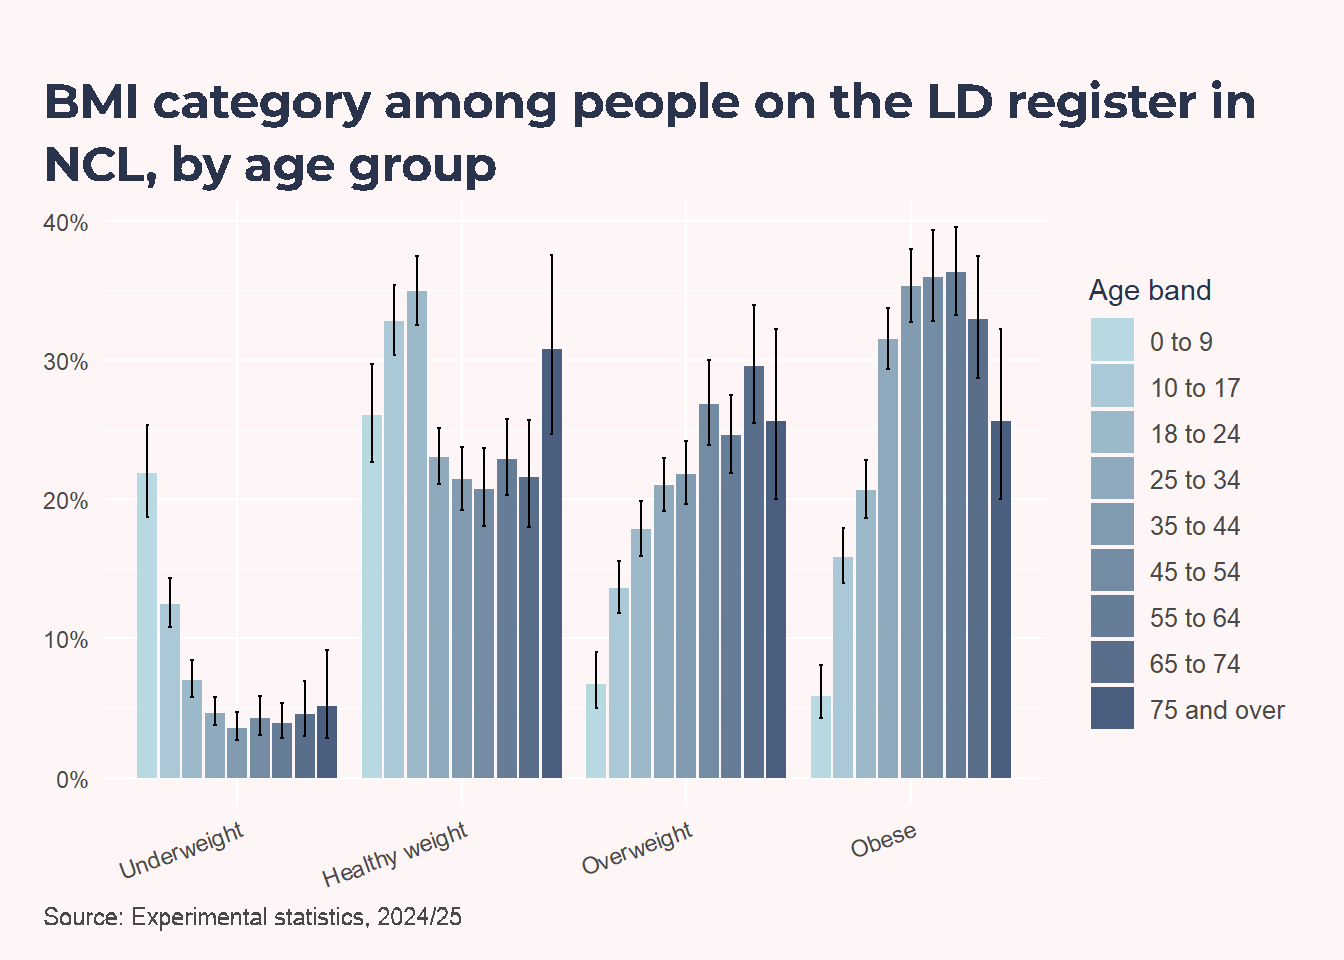
In 2024/25, 26.3% of people on the learning disability register in NCL were a healthy weight and 27.0% were obese. Females were significantly more likely to be obese than males (32.2% versus 23.8%) and significantly less likely to be a healthy weight (23.3% versus 28.2%). Underweight was more common in younger age bands, with 0 to 9 year olds showing 5.9% underweight and 26.1% healthy weight. Overweight and obesity were more concentrated in later age bands, but these rates fall in the oldest groups because reaching older ages implies a comparatively healthier underlying profile.
Prescribing
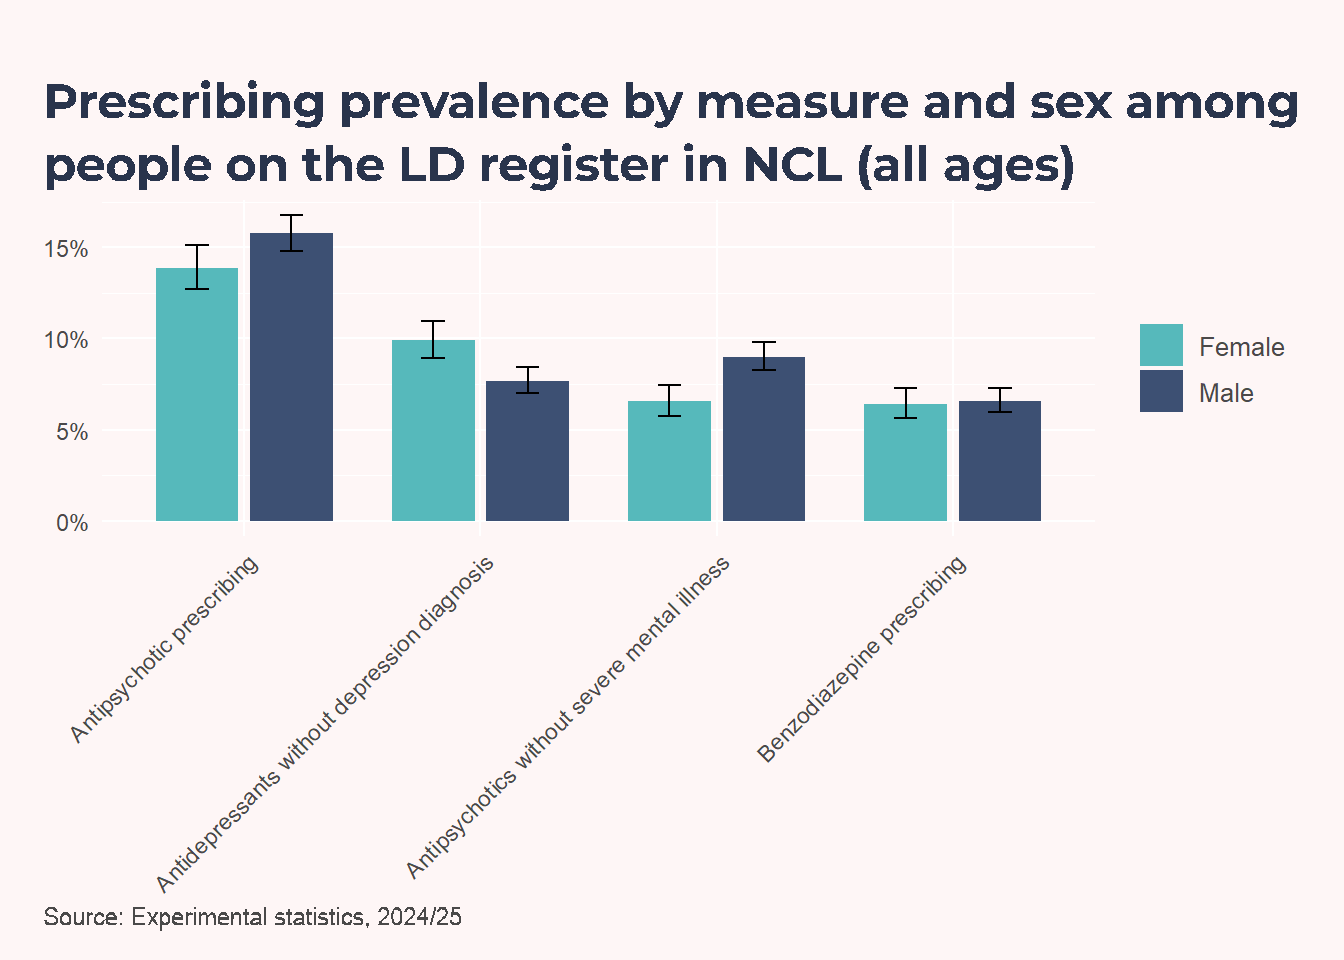
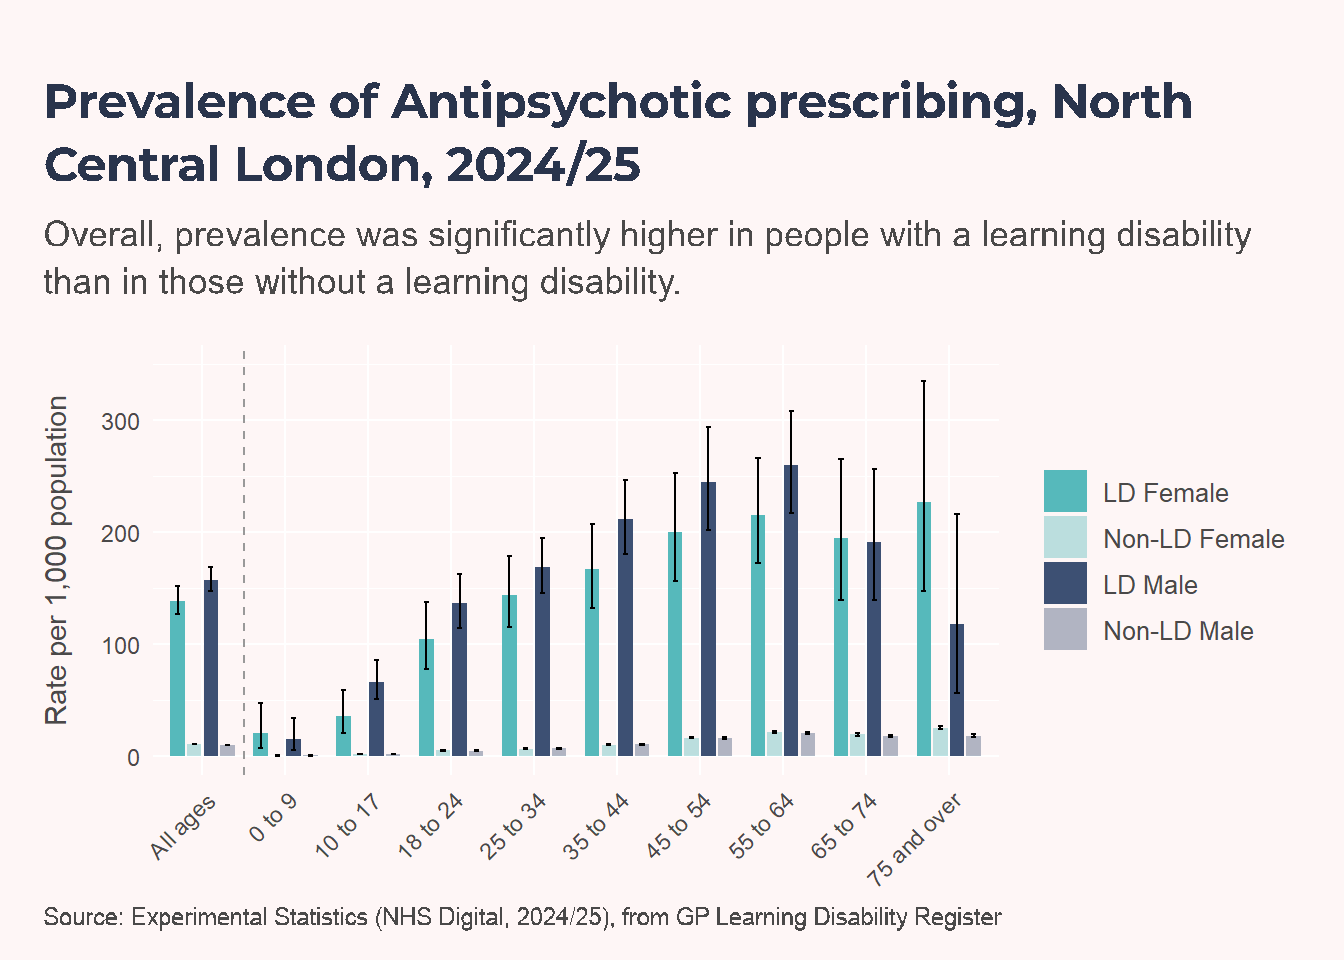
In 2025, people with a learning disability are thought to be 15 times more likely to be prescribed an antipsychotic than the general population (NHS England, 2026). People should only be given psychotropic medication for the right reasons, in the lowest dose, for the shortest time, as side effects can impact on a person’s quality of life. For more information on the NHS England STOMP programme to stop over medication of people with a learning disability, more information can be found in the Literature Review chapter.
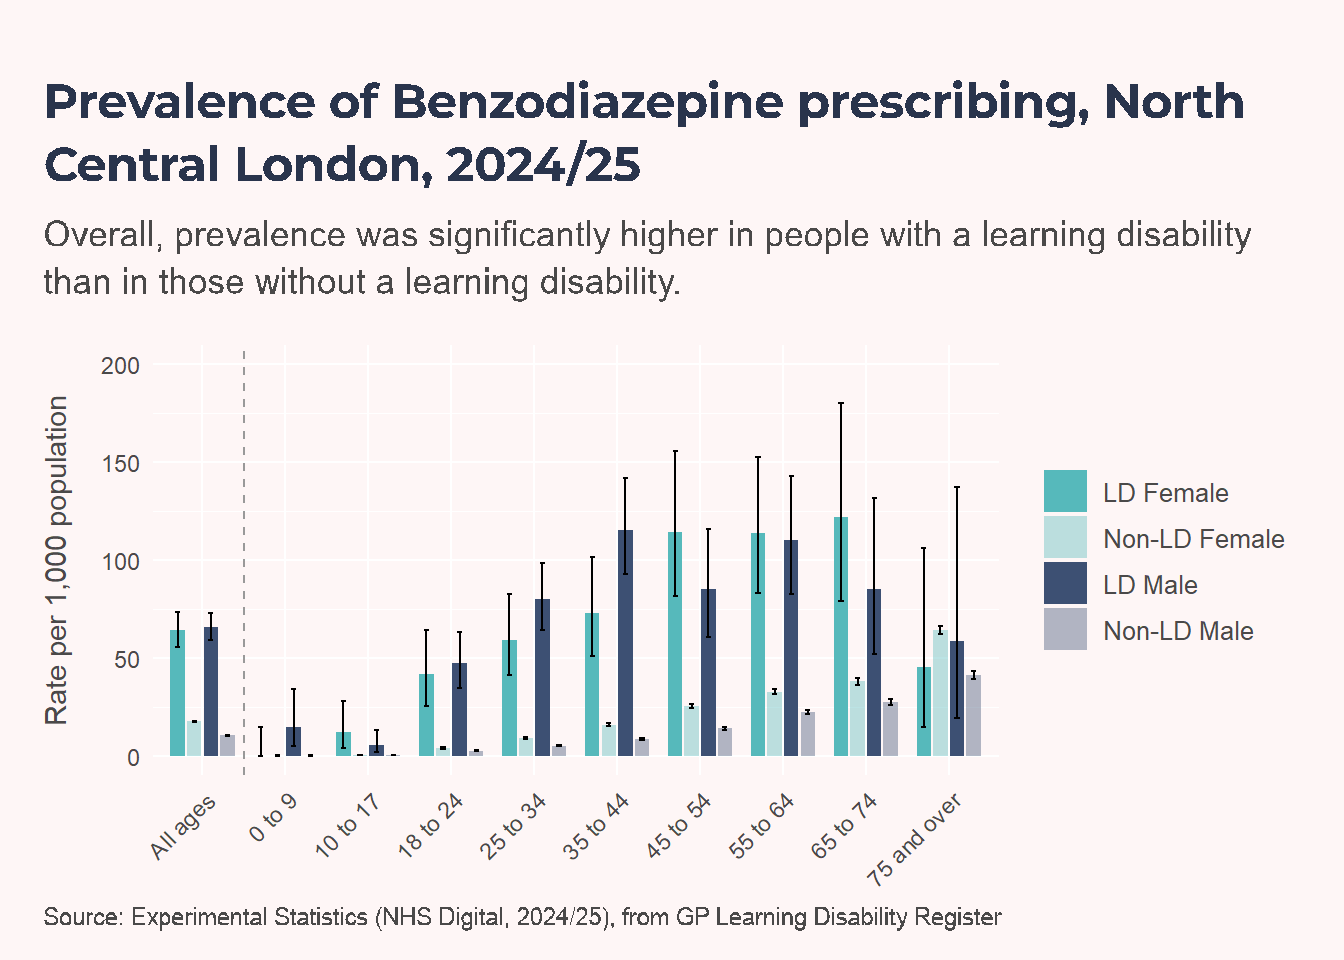
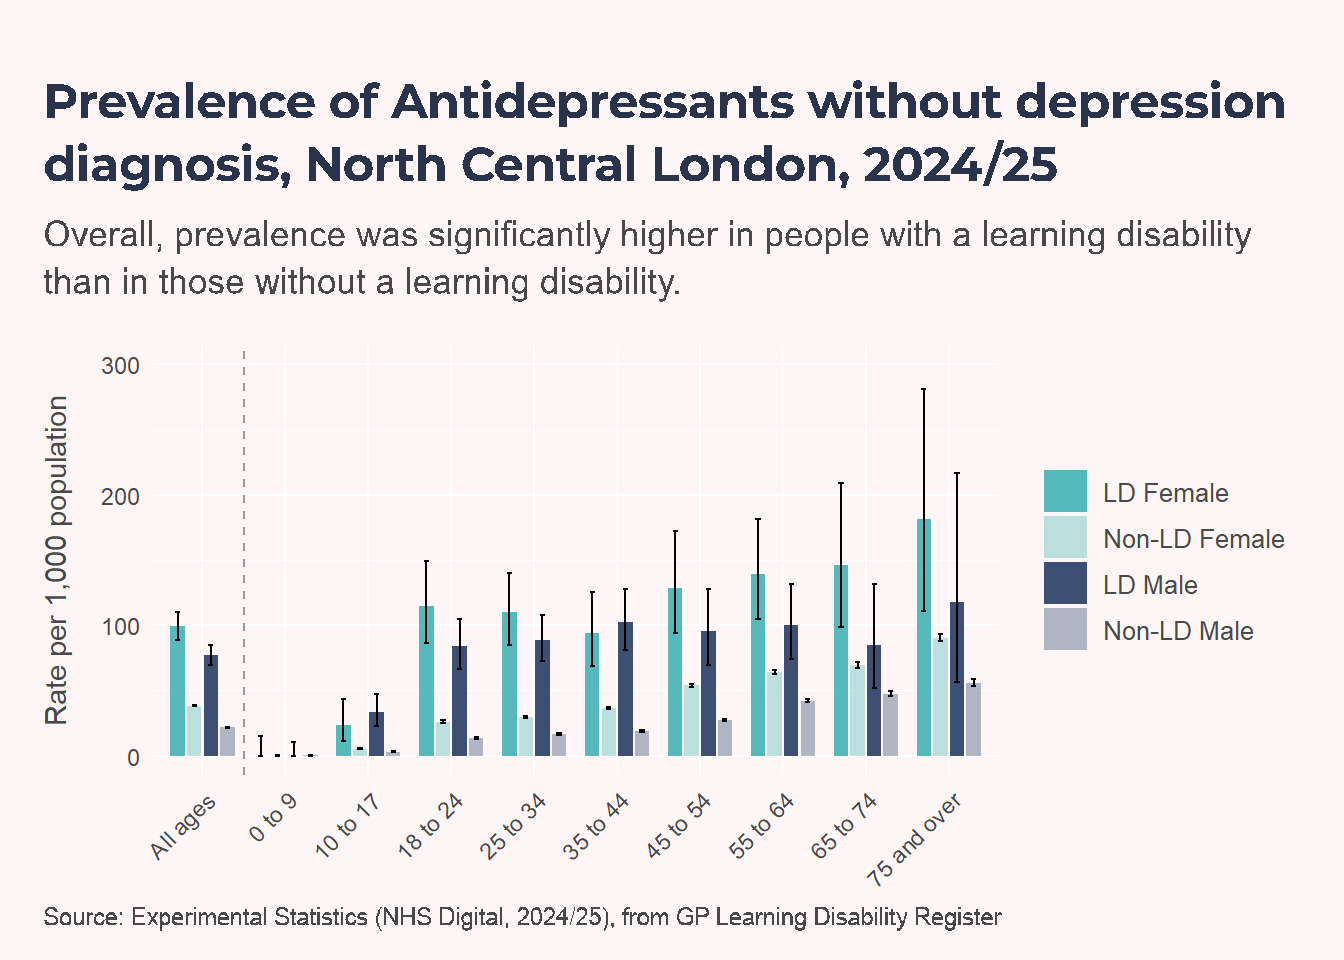
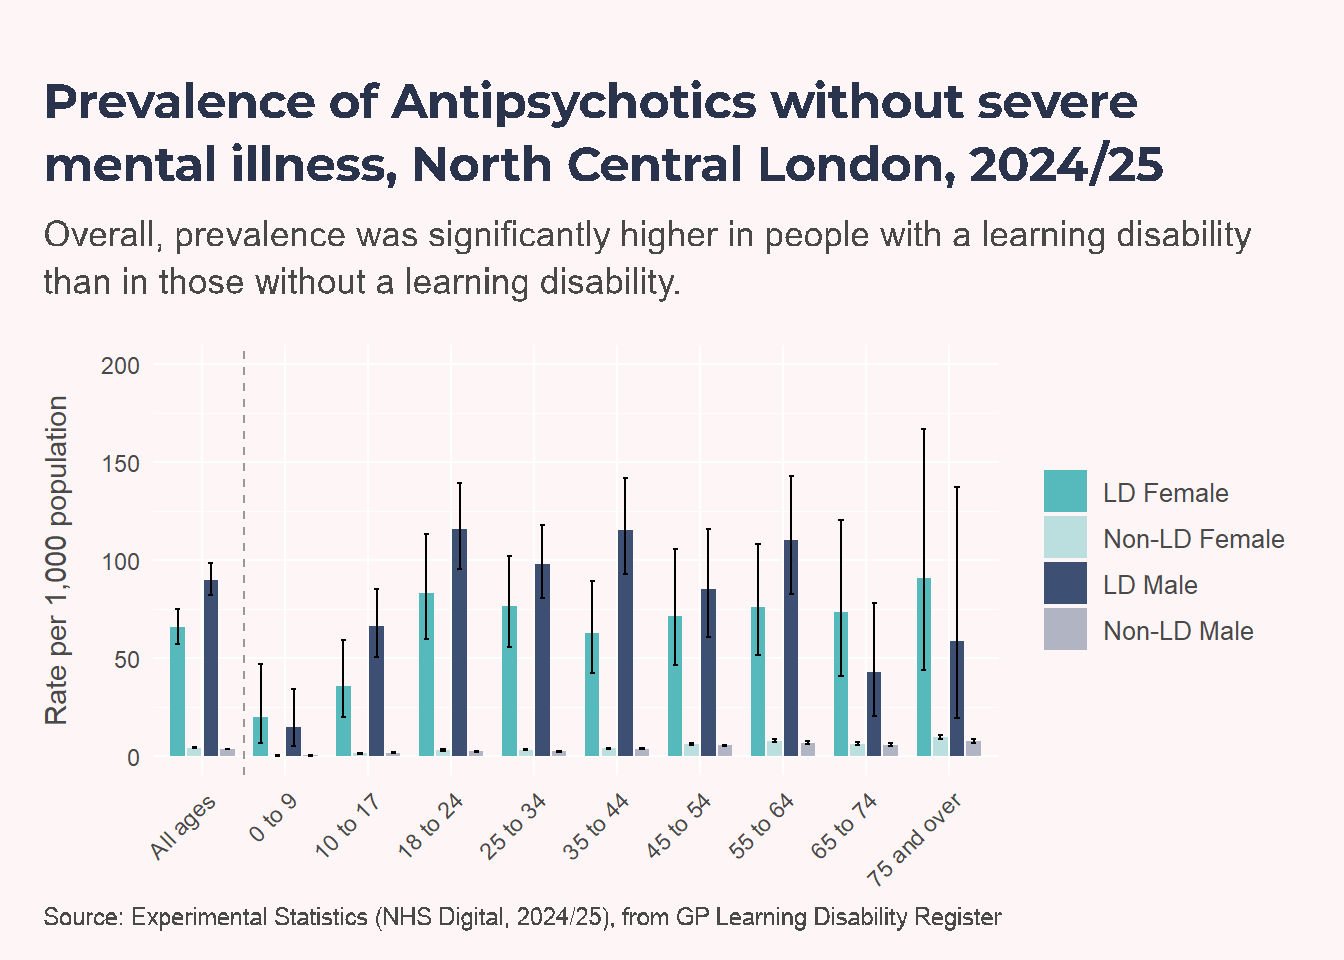
Prevalence of different conditions
NoteInterpret with caution
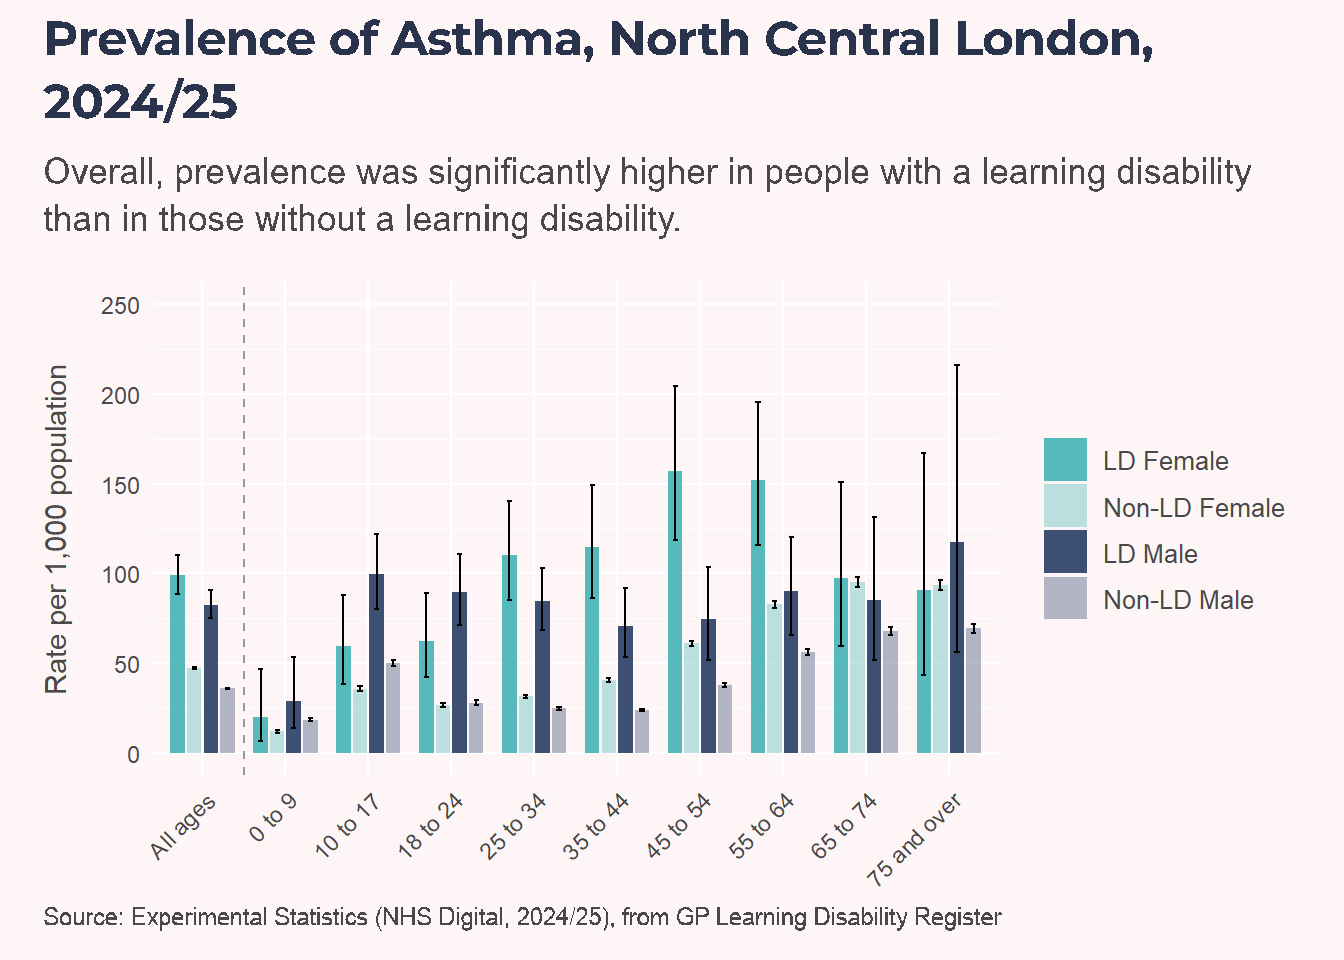
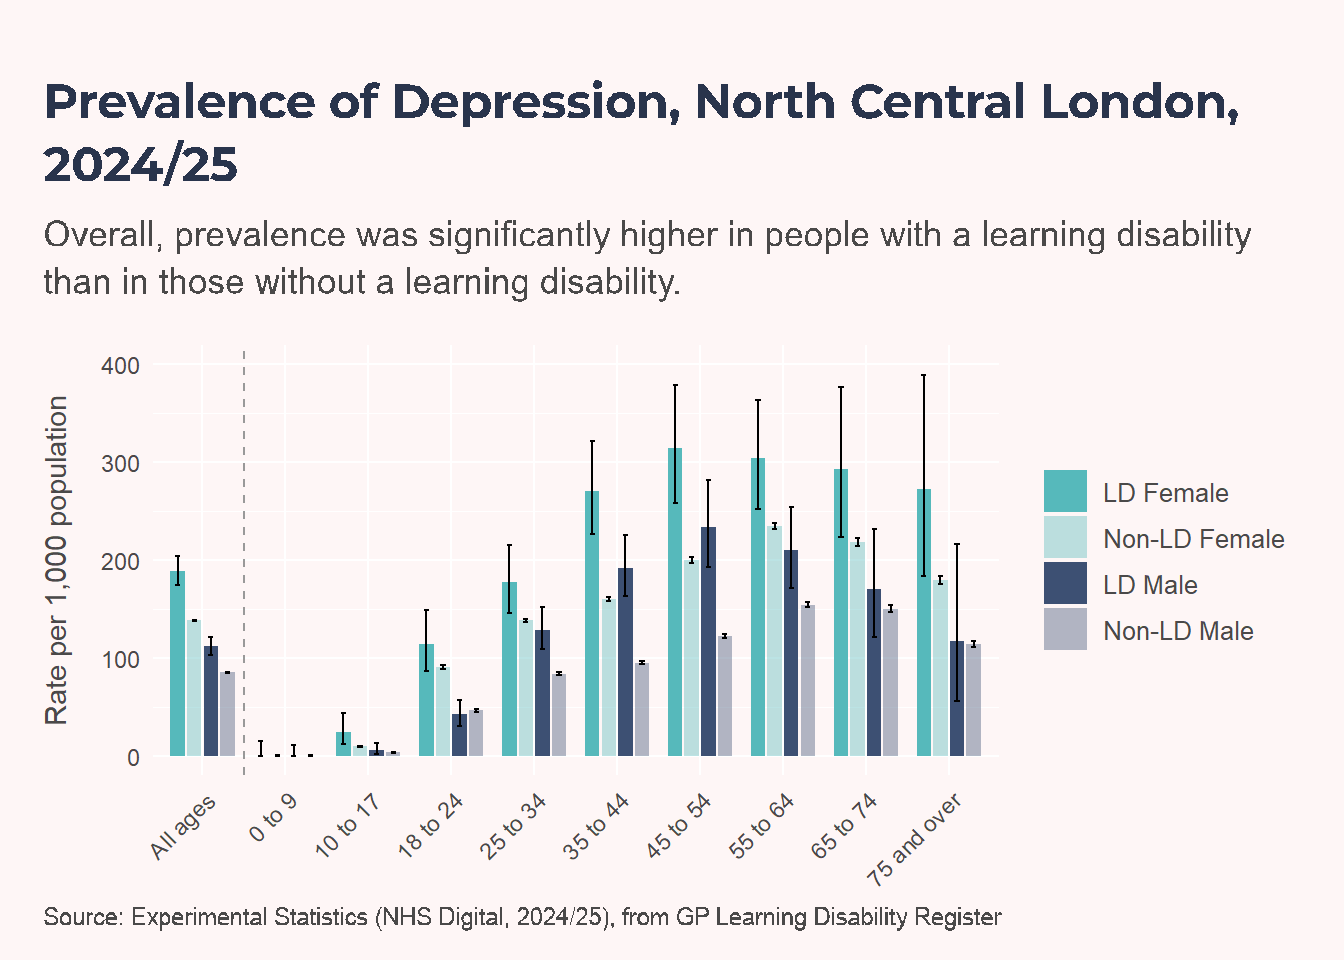
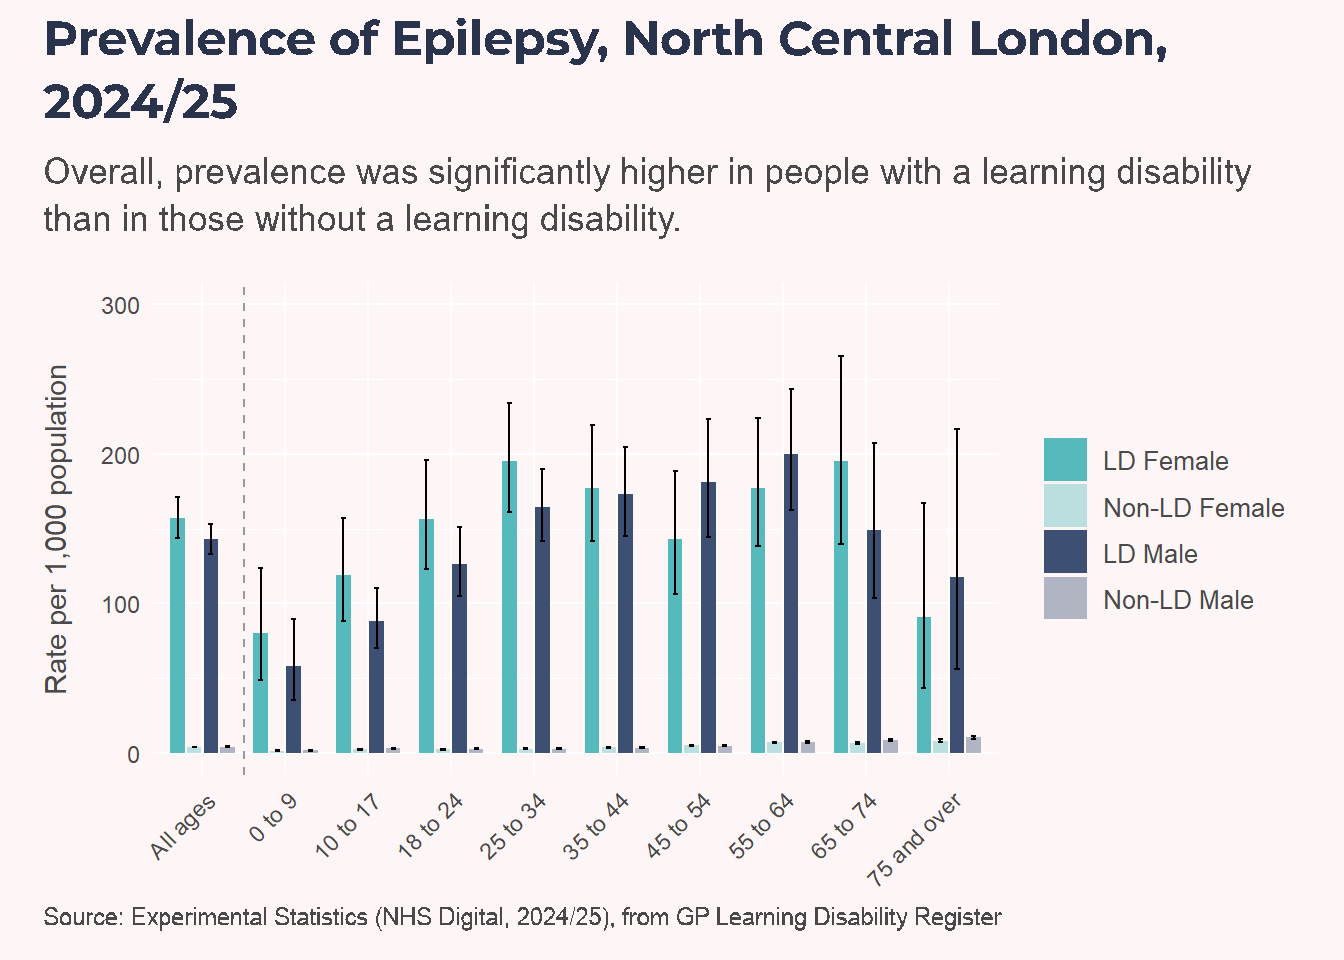
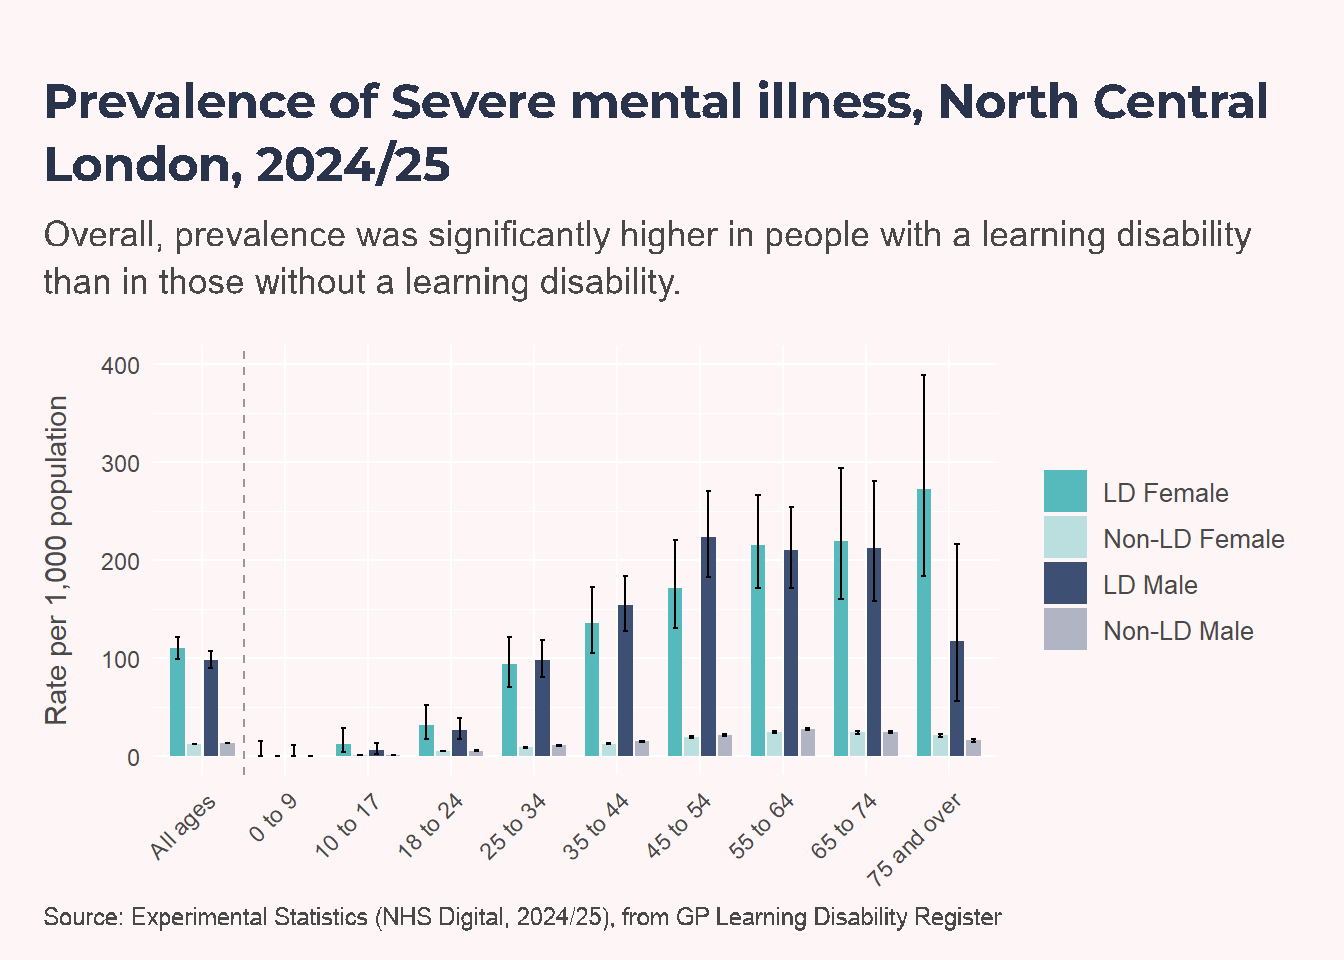
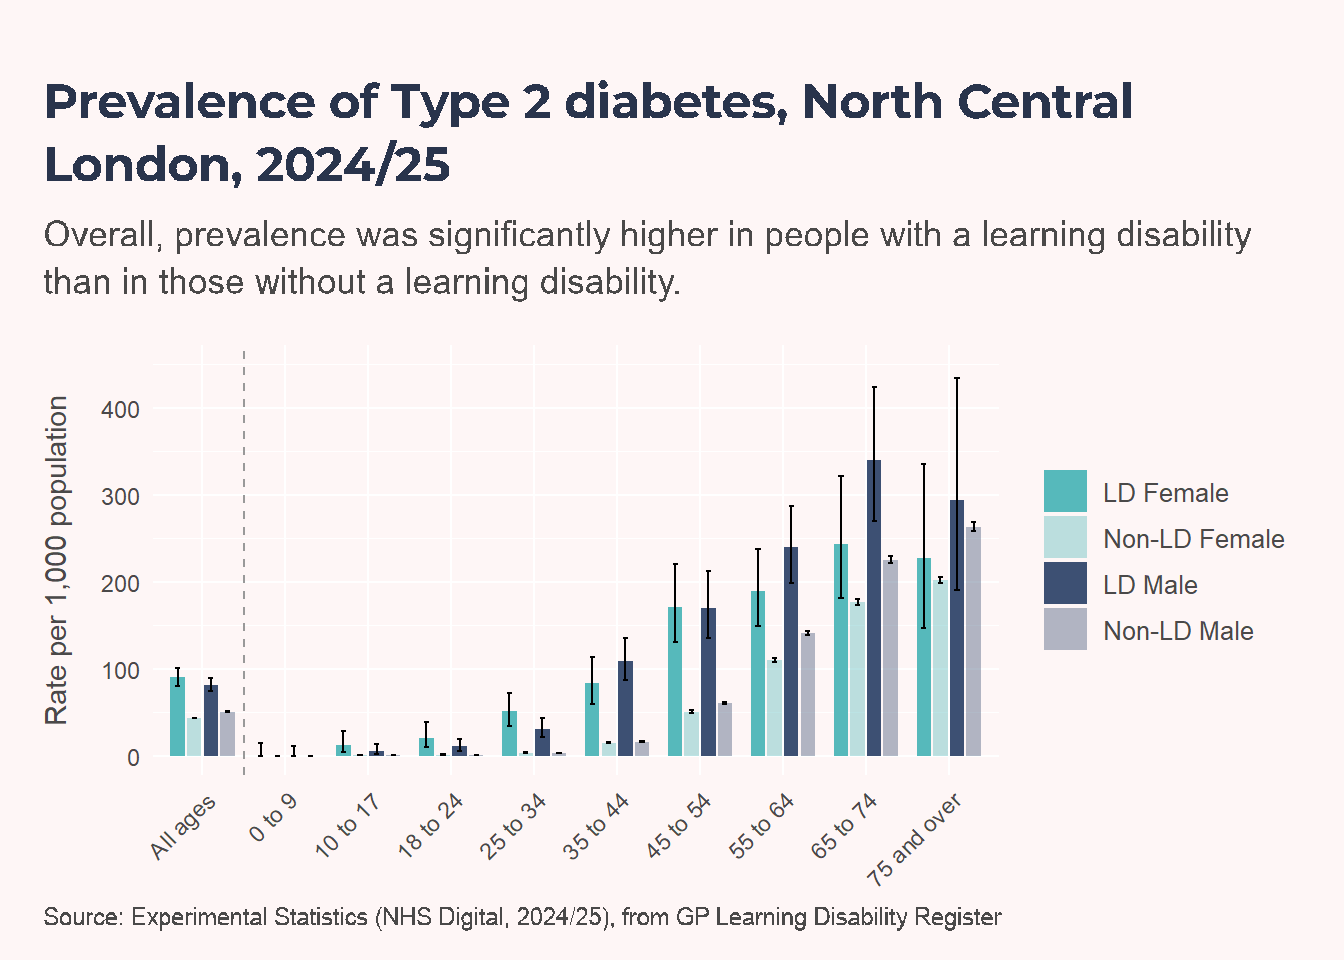
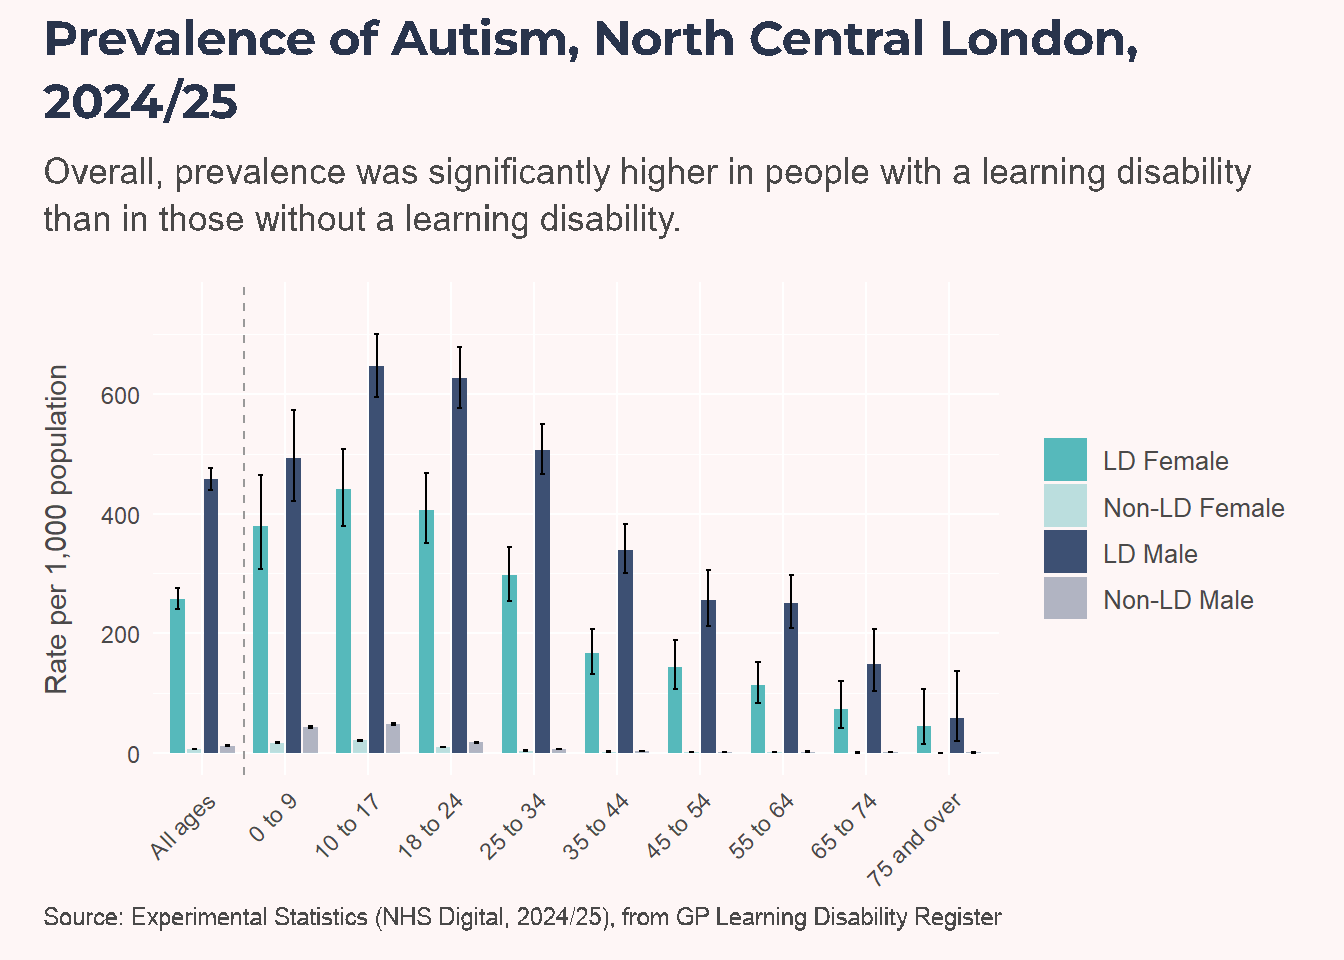
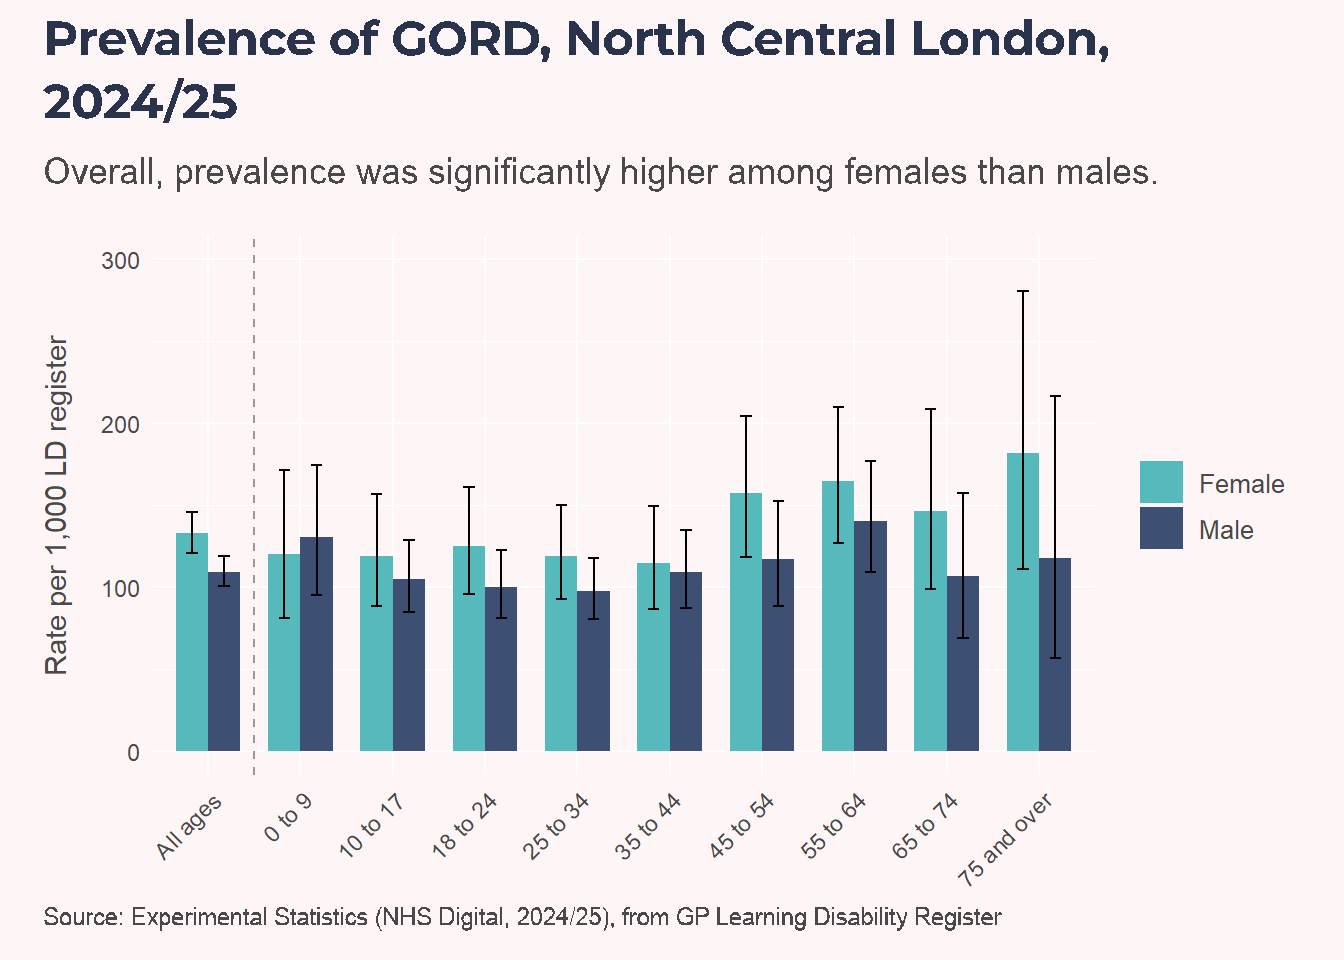
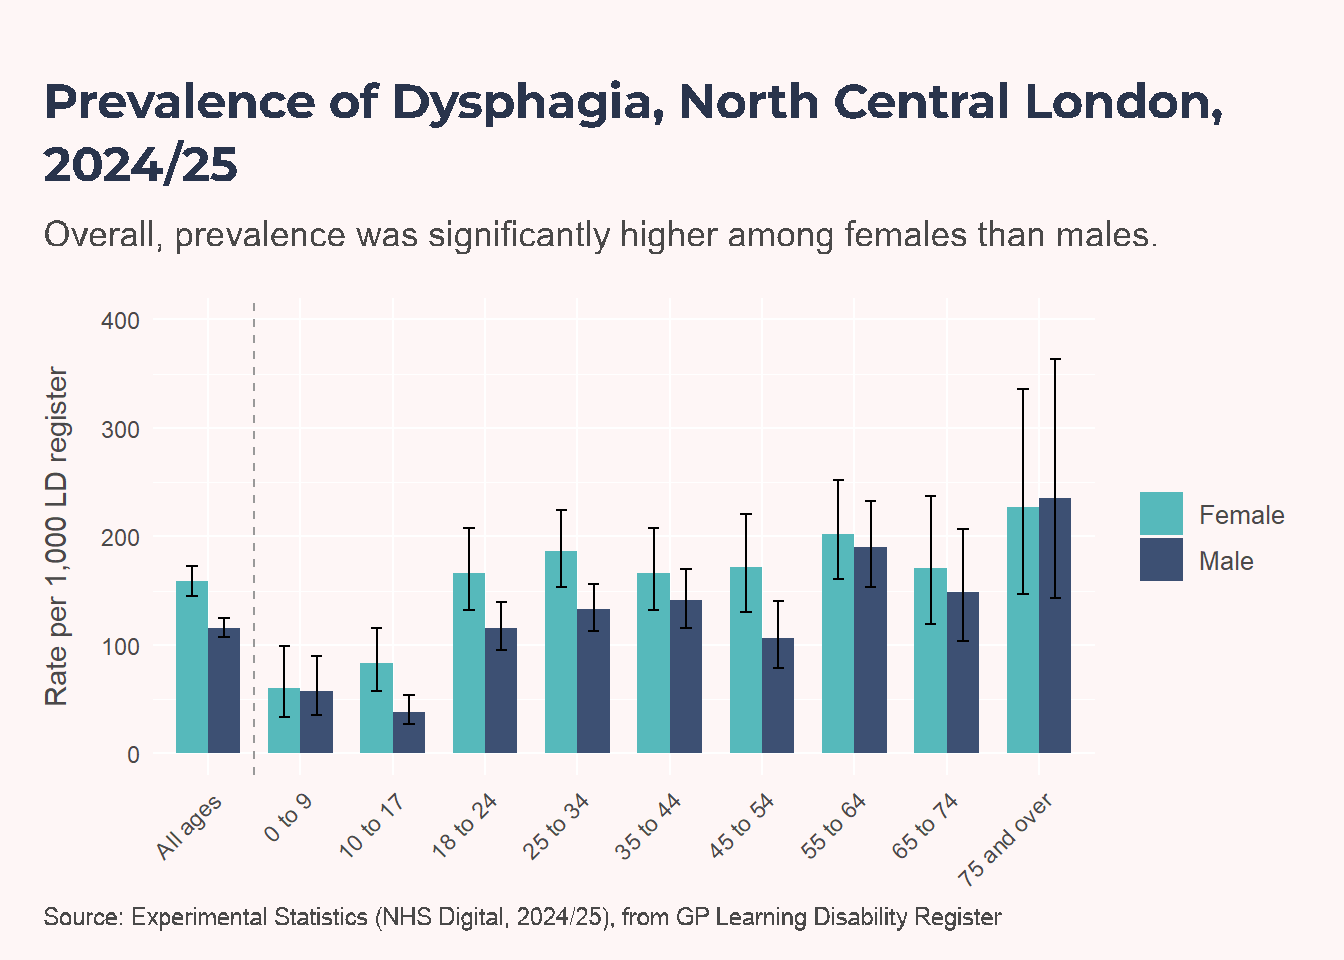
These prevalence estimates are based on recorded diagnoses. People with a learning disability are more likely to receive annual health checks and ongoing monitoring, increasing the likelihood that conditions are identified and coded in health records. Higher recorded prevalence may therefore partly reflect more complete recording rather than solely a higher underlying prevalence. This caveat primarily applies when drawing comparisons between people with and without a learning disability.
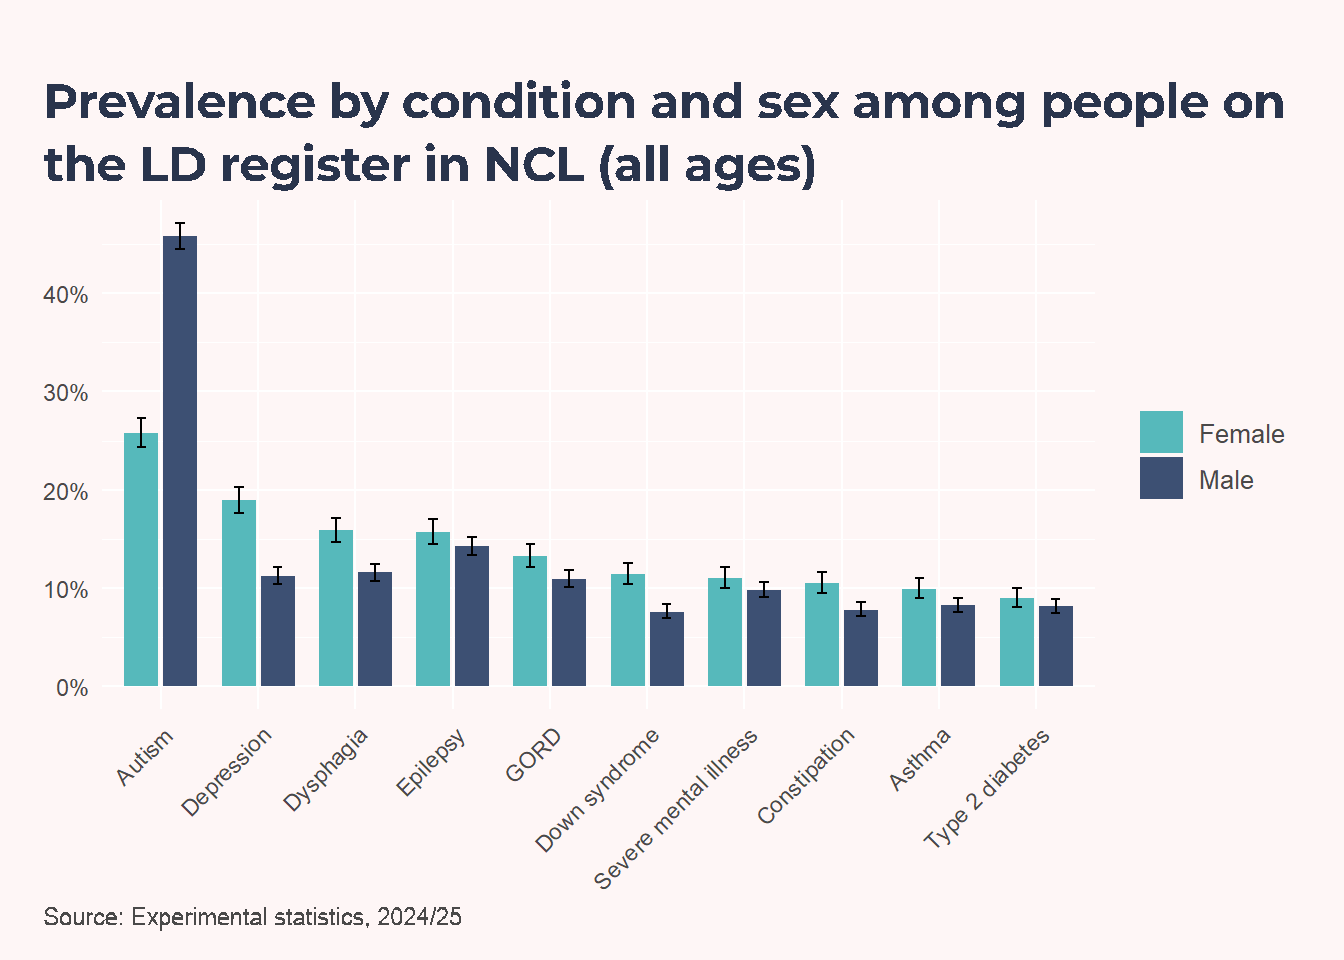
Hospital admissions
NoteTechnical Note
Learning disability status is often incompletely coded in Hospital Episode Statistics. To improve case identification, this analysis applies the Zylbersztejn et al. approach using three code groups in a hierarchy:
Core learning disability diagnoses,
High-risk underlying conditions, and
Associated underlying conditions
Admissions with no match in these groups are classified as non-learning-disability admissions.
The original code list was developed for children and young people, and defines:
- Core: ICD-10 F7 learning disability codes.
- High-risk: conditions where most people are likely to have a learning disability.
- Associated: conditions where a substantial minority are likely to have a learning disability.
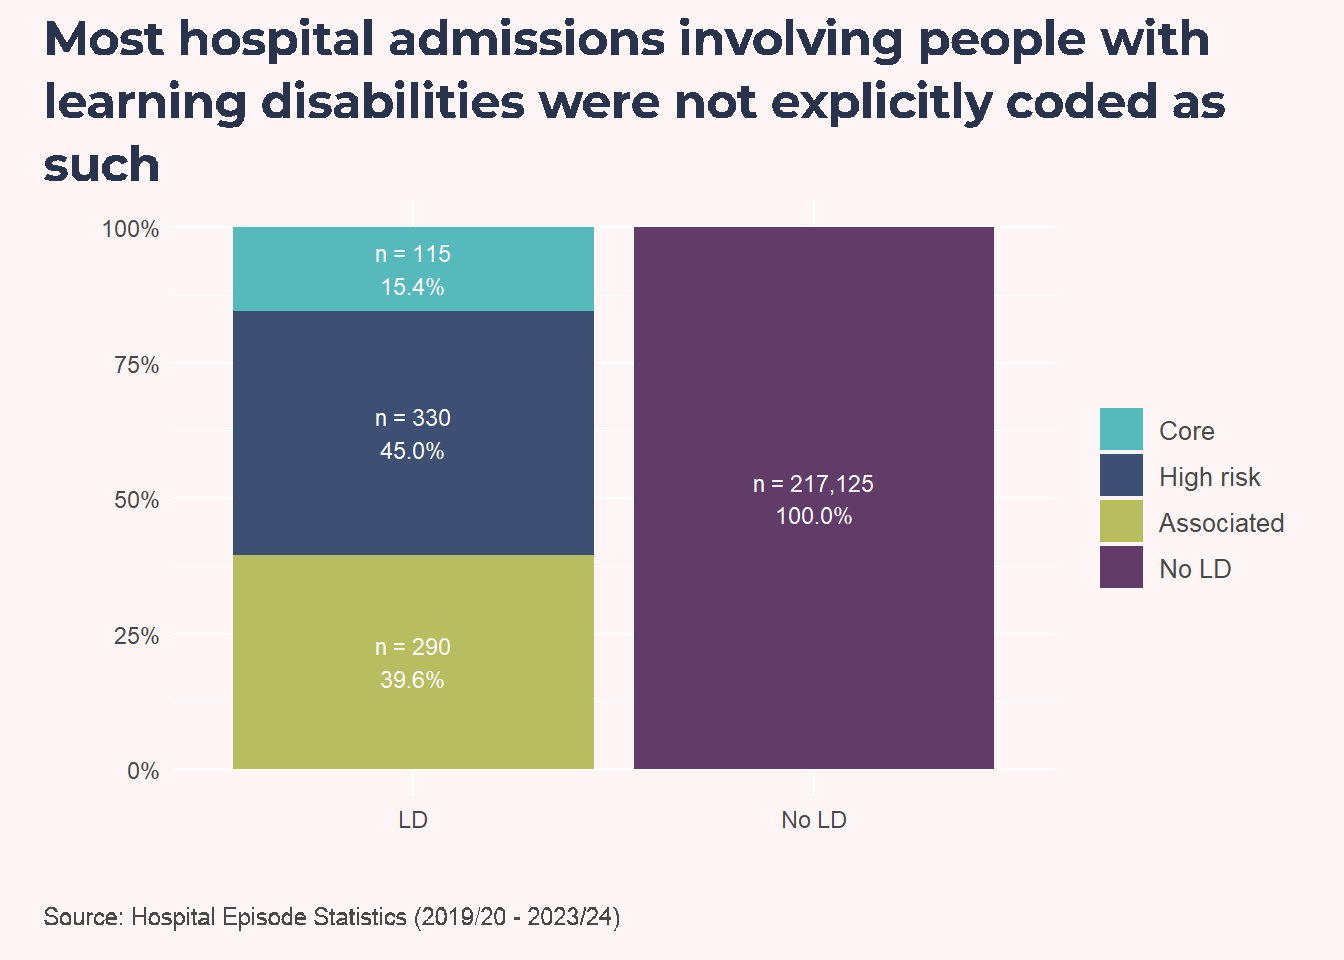
Of 380 admissions identified among Camden residents over the last five years, 300 were identified using the expanded case-finding methodology rather than direct coding of a learning disability.
This suggests that direct learning-disability coding alone would miss a substantial share of relevant activity, so case-identification strategy materially affects interpretation of local acute-care patterns.
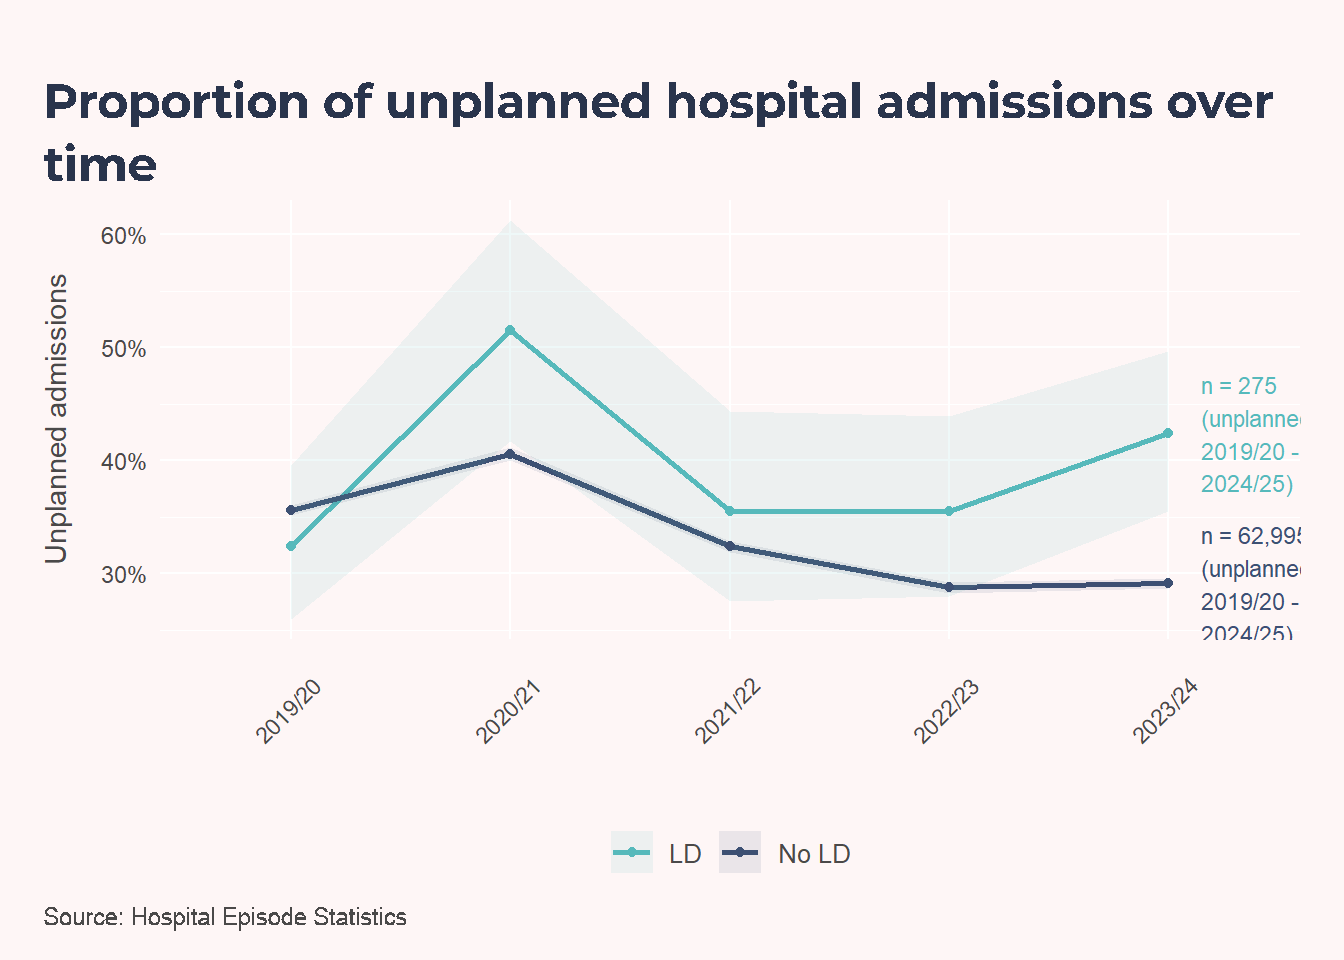
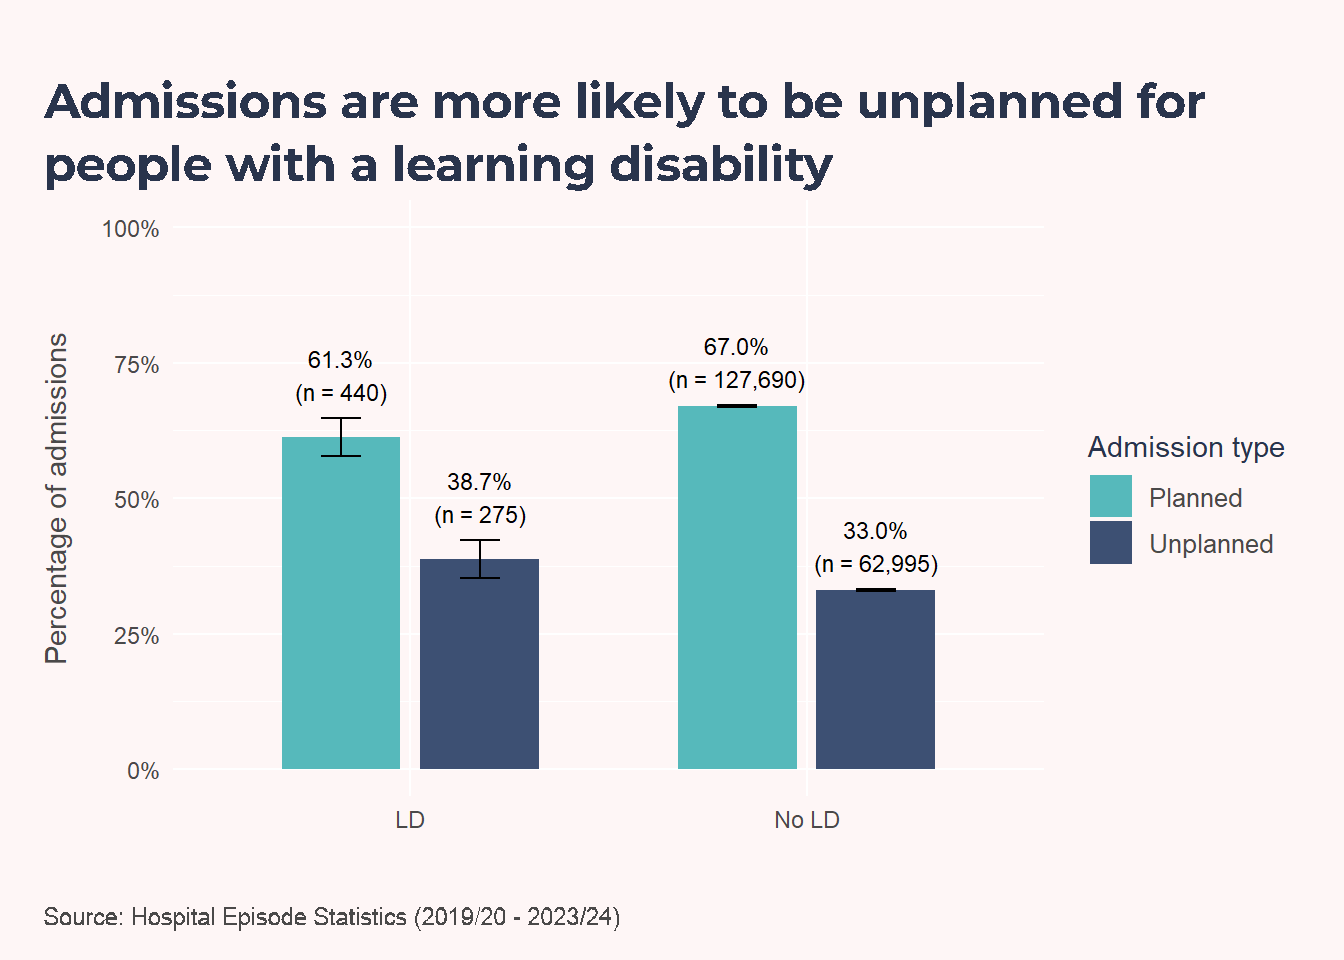
This comparison asks whether admissions among people with learning disabilities are more likely to enter via an unplanned pathway (including day cases). Across 2019/20 to 2023/24 in Camden, 38.7% of admissions in the learning disability group were unplanned, compared with 33.0% in the non-learning-disability group. That corresponds to a relative difference of 17.1% (p = 0.00153).
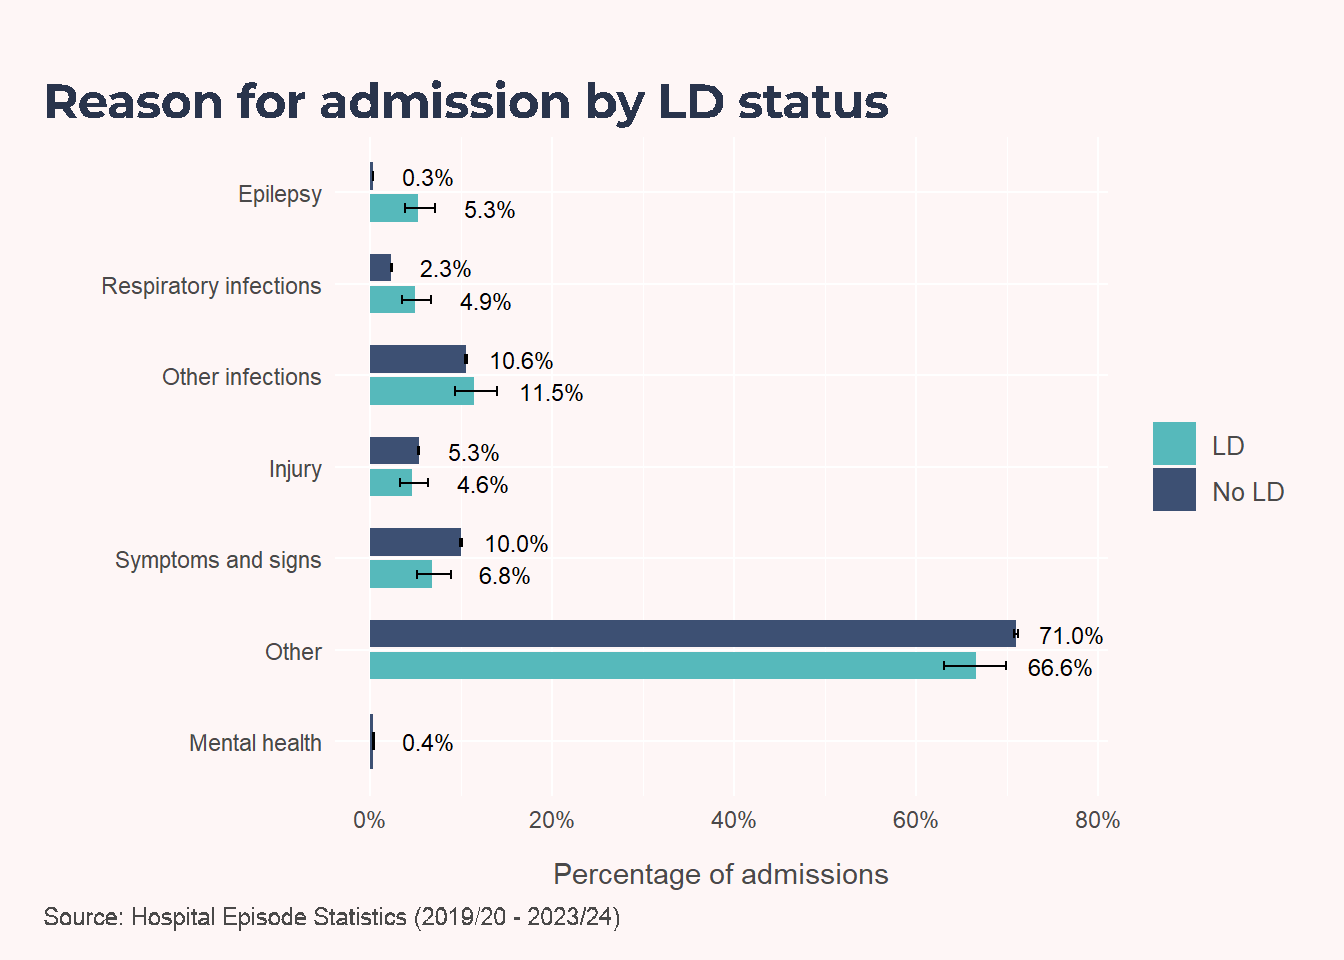
Epilepsy accounts for a higher share of admissions in the learning disability group (5.3%) than in the non-learning-disability group (0.3%), and respiratory infections are also more common (4.9% vs 2.3%). By contrast, non-specific symptoms/signs (6.8% vs 10.0%) and the broad ‘Other’ category (66.6% vs 71.0%) make up a smaller share of admissions in the learning disability group.
This distribution indicates where preventable or better-managed conditions may be contributing disproportionately to admissions in the learning disability group.
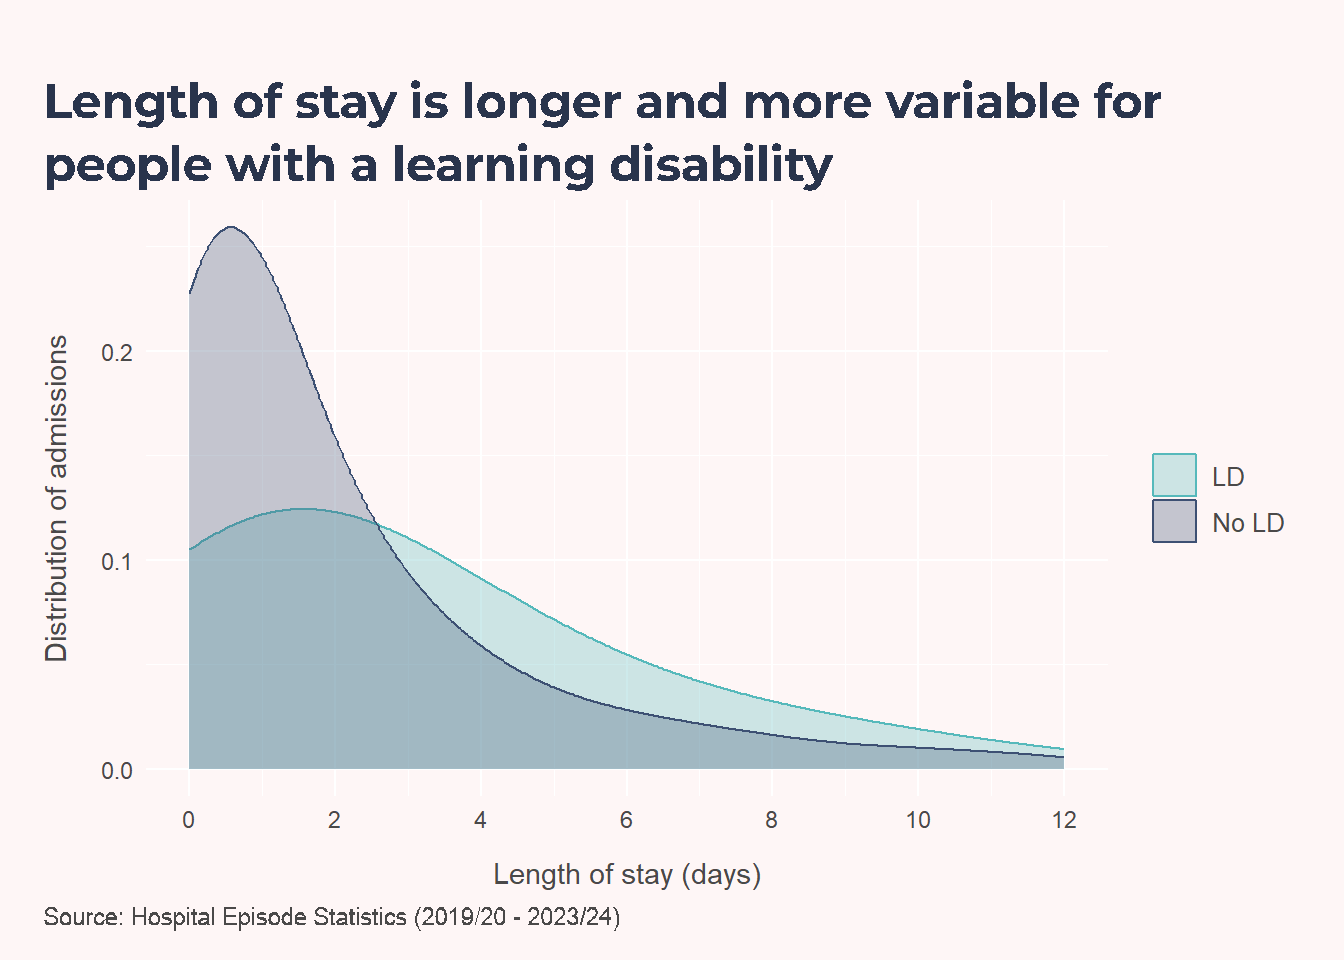
The density curves show where admissions are most concentrated in each group. In this dataset, admissions of a week or more were 19.1% in the learning disability group and 11.9% in the non-learning-disability group. These admissions include planned and unplanned episodes, including day cases.
NoteTechnical Note
Length of stay is not a direct proxy for delayed discharge, but it can partly reflect discharge barriers alongside clinical complexity and care-process factors.
Mortality
Mortality narrative to be added once NCL LeDeR report 2022/23 (most recently published) received.
Services
The CQC assessment highlighted a number of strengths relevant to adults with learning disabilities in Camden. The local authority has taken a strategic approach to developing accommodation and support options, with planning driven by an ambition to support people to move away from residential care and live more independently within the community. The refreshed Learning Disability Accommodation Strategic Framework (2024) reported that all 26 supported housing schemes for people with learning disabilities were subject to annual quality monitoring, with the proportion rated as requiring significant improvement (“Red”) falling from almost one-third of schemes in 2019 to 11.4%. The Council is also investing in future capacity, with 17 new supported housing units planned by 2027/28, alongside expansion of Shared Lives and other community-based support options.
The assessment found strong partnership working and governance arrangements across learning disability services. CQC noted clear accountability, quality assurance and information-sharing processes, including integrated working arrangements within the Camden Learning Disability Service (CLDS). Partnership working on learning disability accommodation and market management was identified as an example of effective collaboration, while co-produced services for adults with learning disabilities were recognised for supporting equality of experience and person-centred solutions. CQC also highlighted Camden’s strengths-based approach to prevention and early intervention, including the Living a Good Life - Opportunities Planning project, which helps people with learning disabilities identify and access meaningful opportunities, reducing or delaying the need for more intensive statutory support.
Particularly relevant to this Health Needs Assessment was the strong praise for transition arrangements between children’s and adult services. CQC identified effective communication and joint working between teams supporting young people with additional needs, highlighting the integrated 0-25 transition pathway spanning the Camden Young People’s Disability Service (CYPDS) and Camden Learning Disability Service (CLDS). The assessment described this as a notable example of successful partnership working between adult social care, children’s services and health partners, helping to ensure continuity of support as young people move into adulthood. This was cited as one of Camden’s key strengths and demonstrates a well-developed transition model for young people with learning disabilities.
CLDS
Demography, language, deprivation and residence
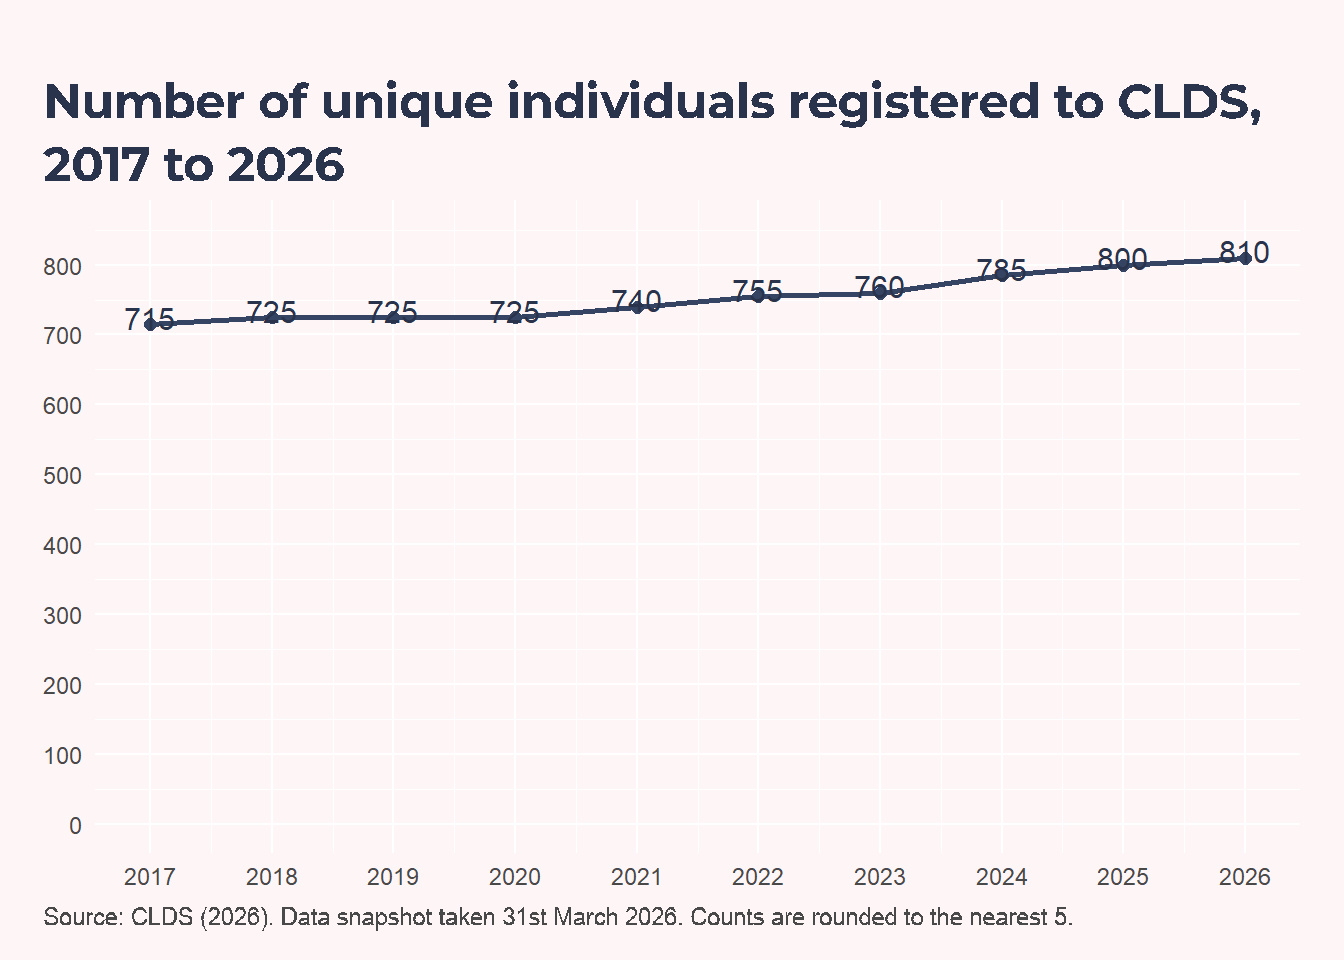
In 2026, the CLDS register includes 810 people, compared with 810 on the GP Learning Disability Register. These are not the same denominator populations: the GP register is a primary-care diagnostic register used for annual health check eligibility, while CLDS reflects people known to specialist local services. The similar headline counts provide a useful triangulation check rather than a direct one-to-one validation.
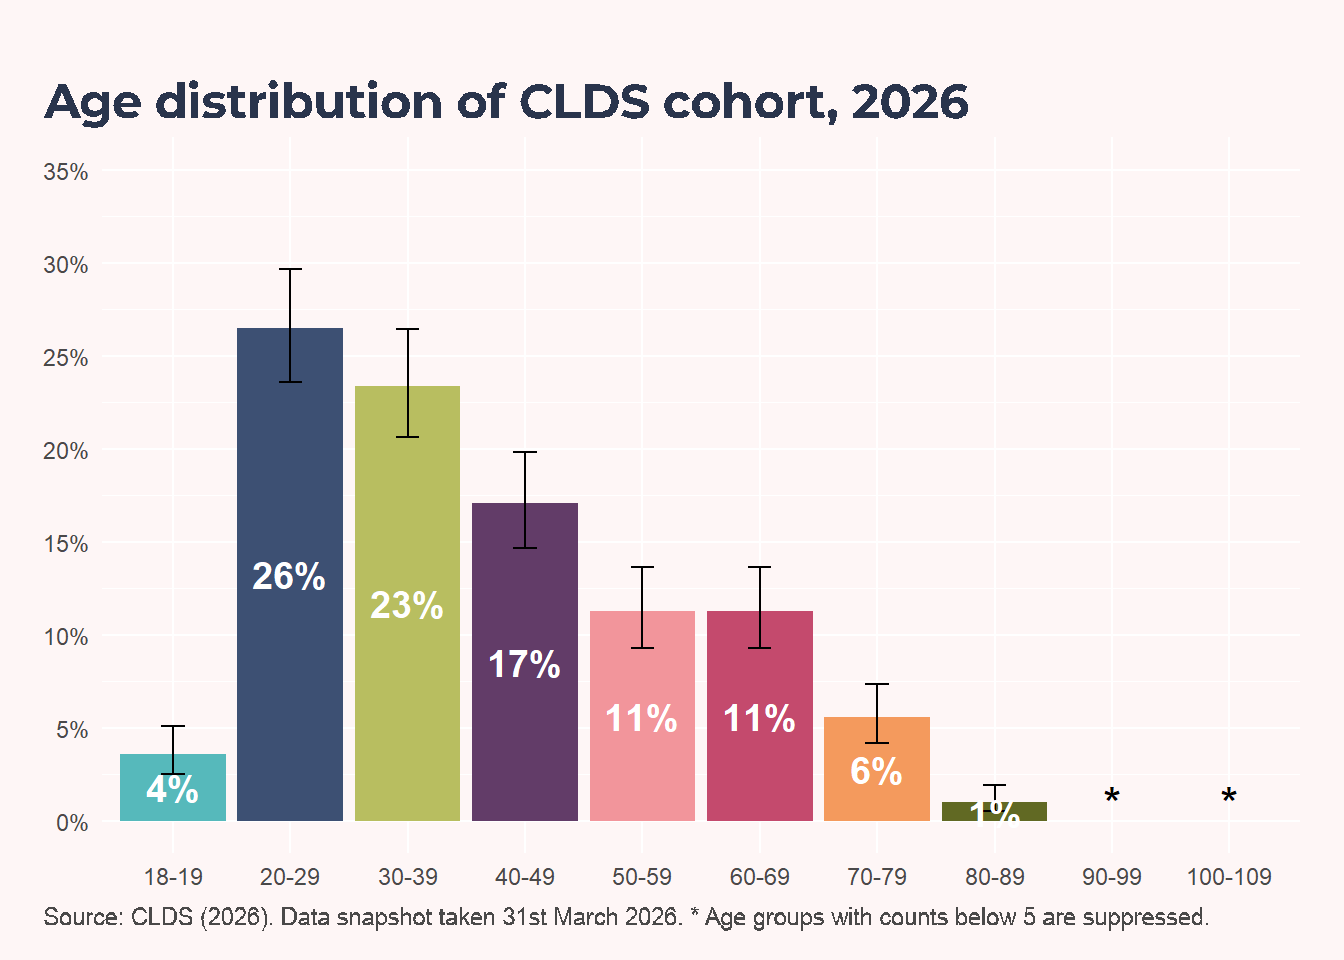
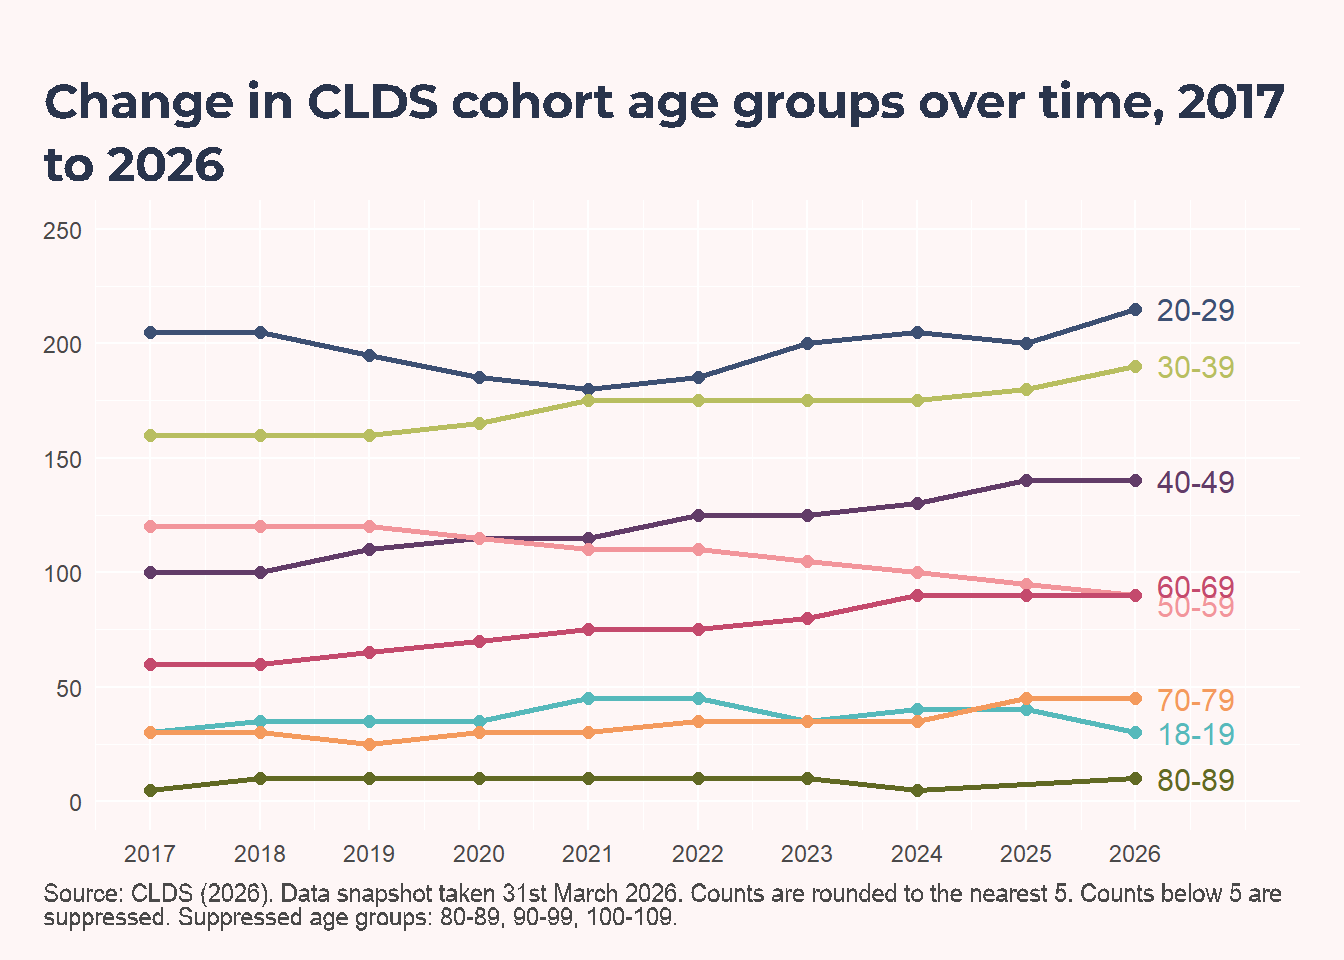
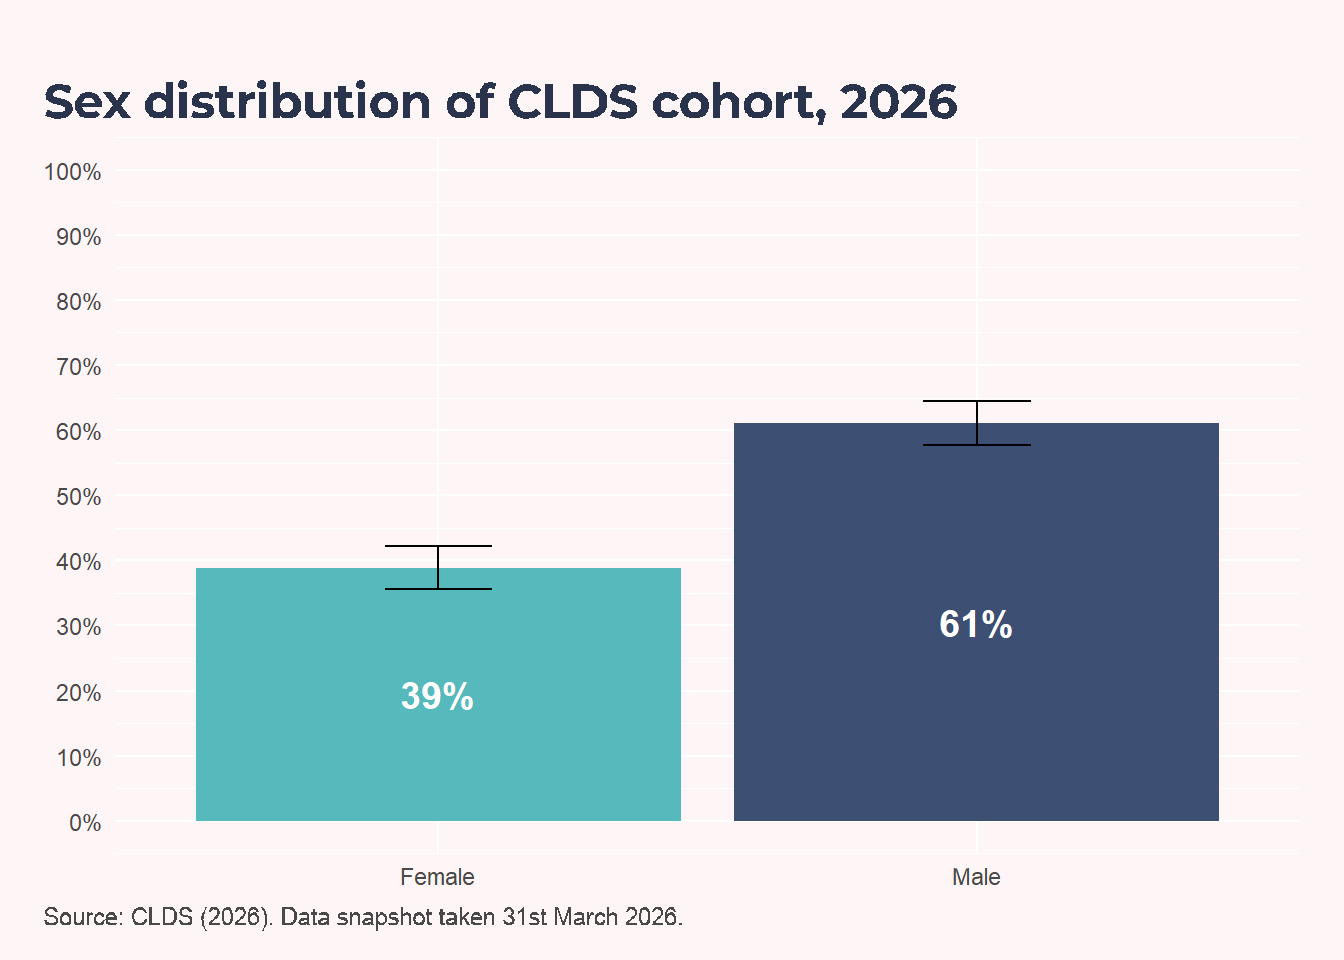
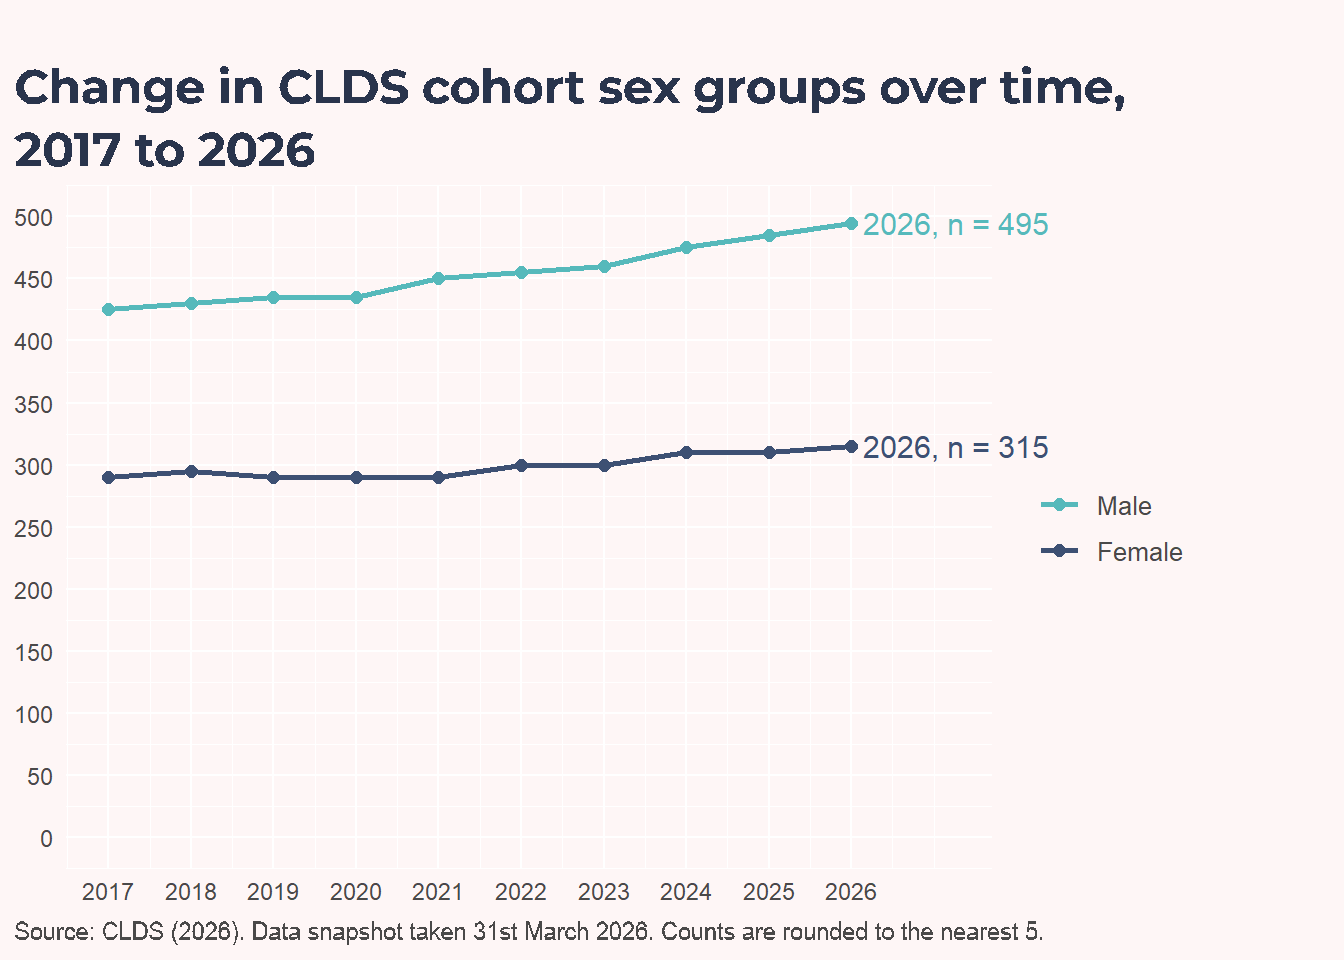
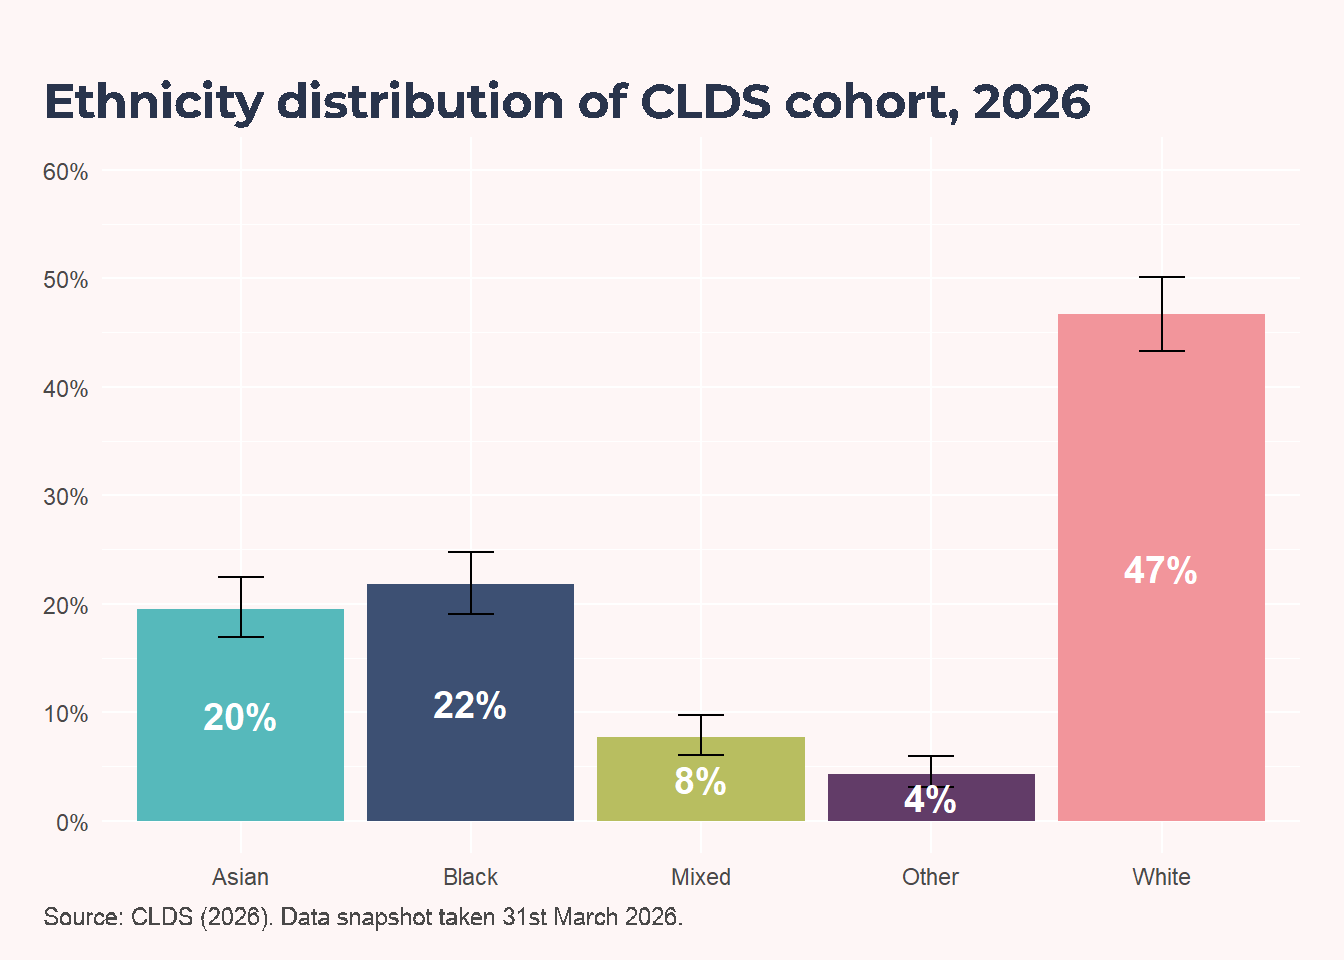
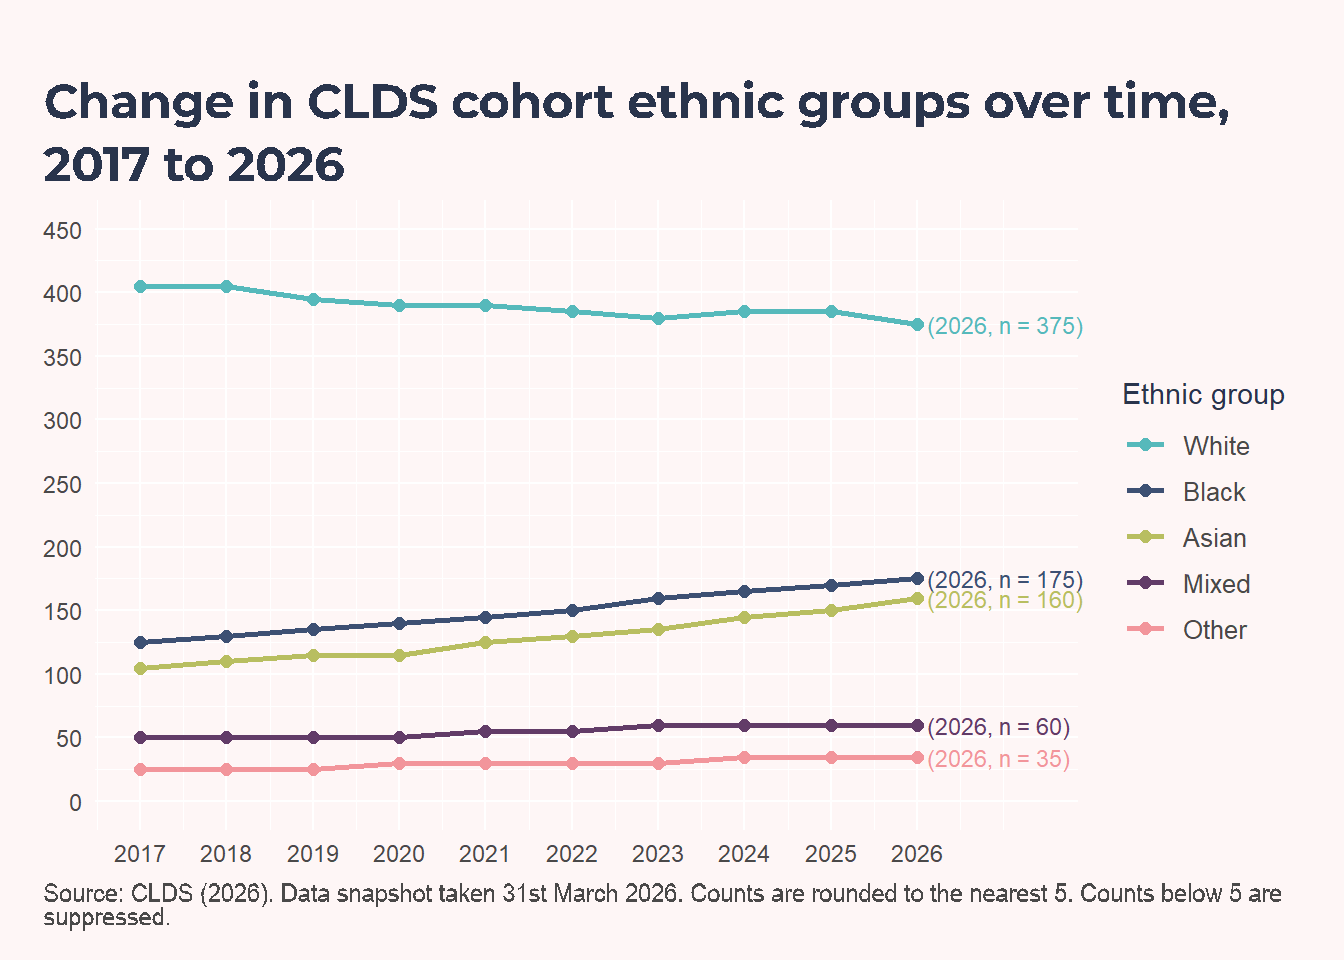
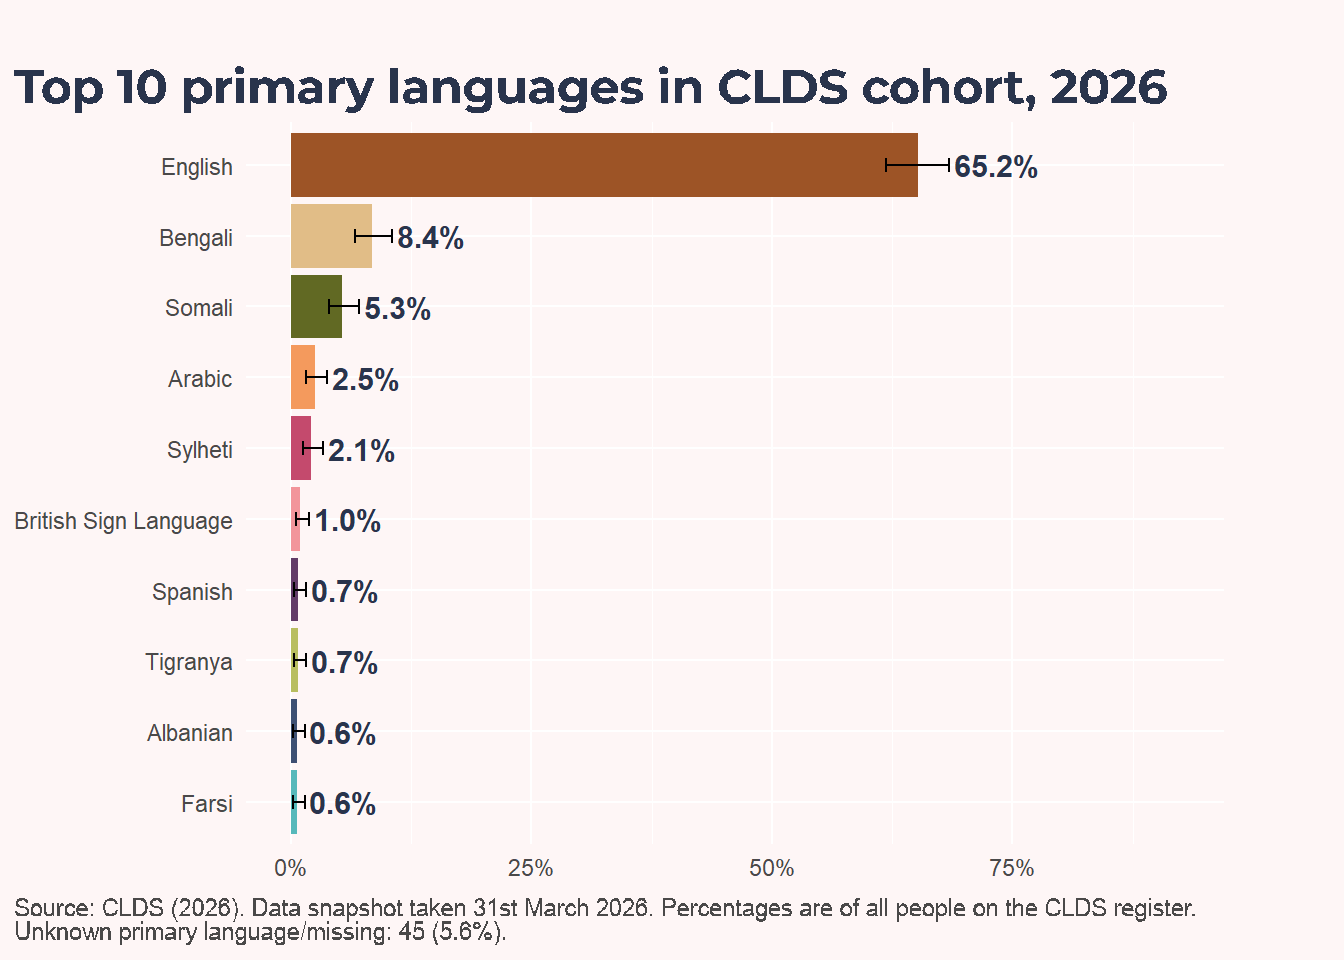
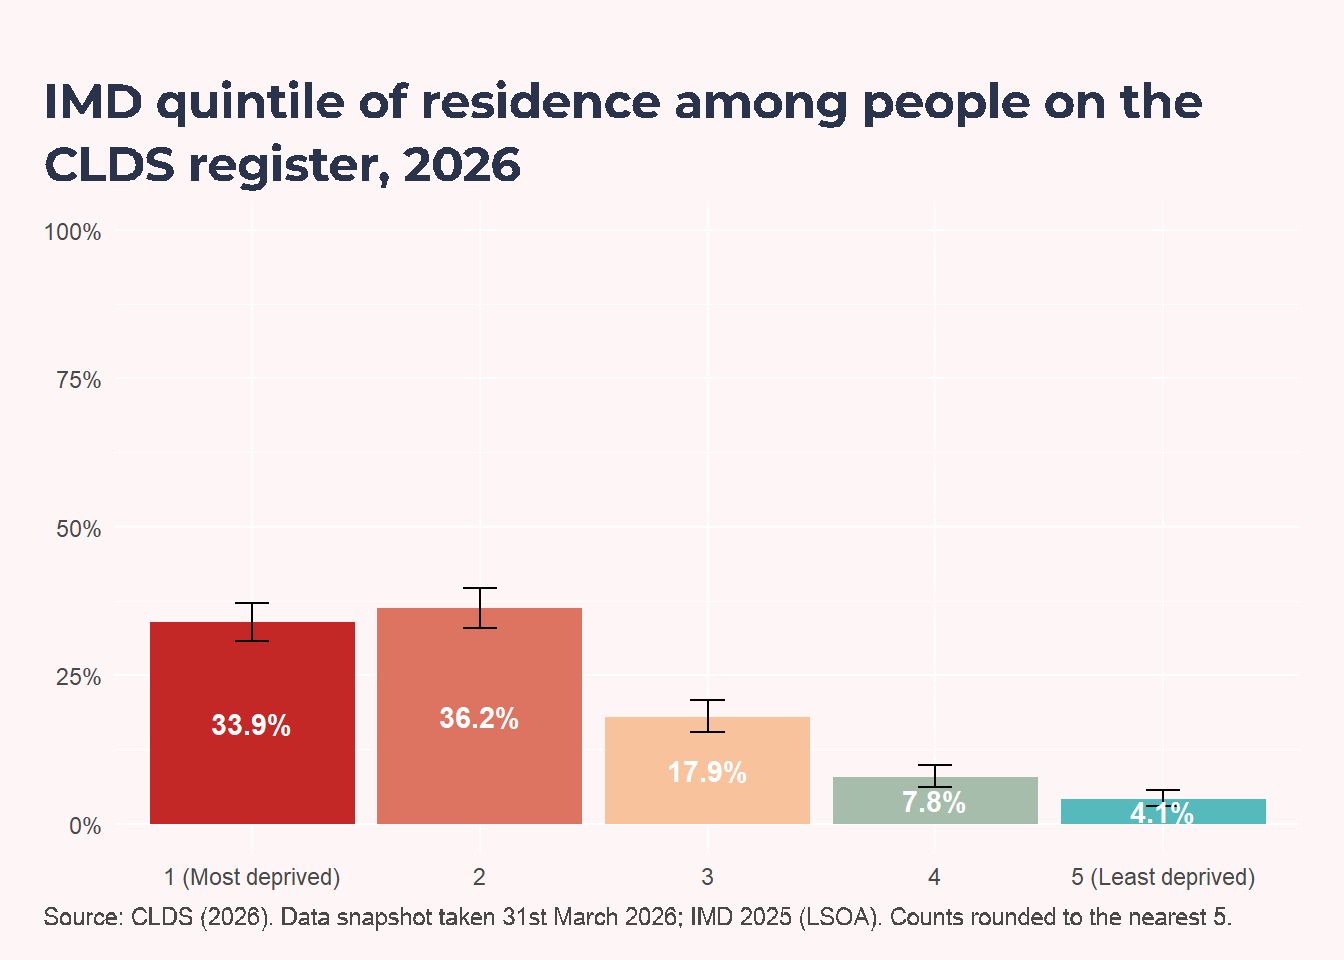
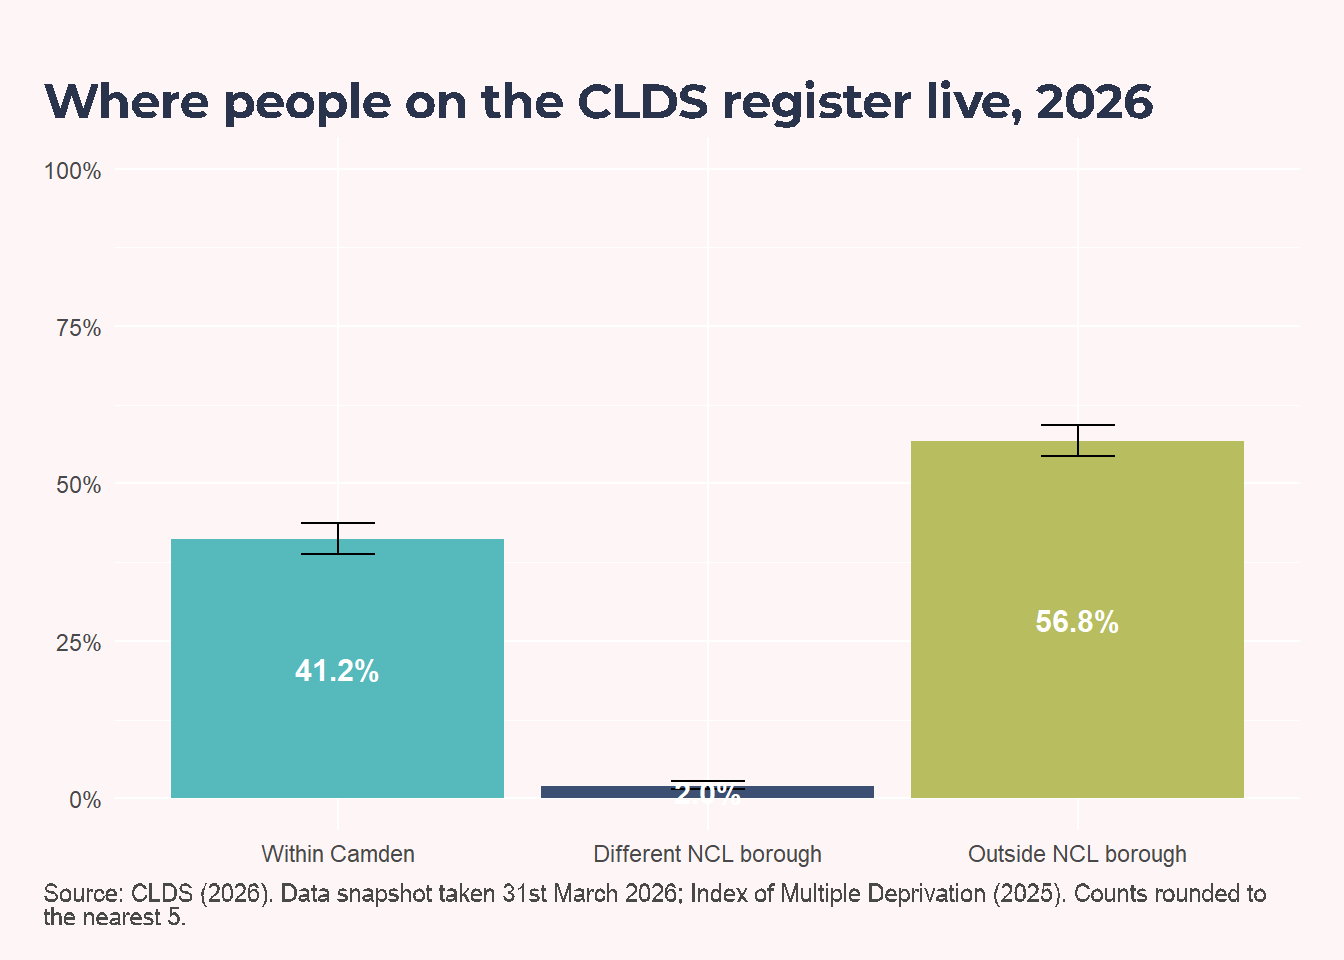
Across the current CLDS profile, the largest age group is 20-29 (26.5%). Sex distribution is Male 61.1% and Female 38.9%. The largest recorded ethnicity category is White (46.7%), and the most common recorded non-English primary language is English (65.2%), with unknown/not recorded language at 5.6%. By area, the largest IMD group is quintile 2 (36.2%), and most people live outside ncl borough (56.8%).
Learning disability severity and co-occurring conditions
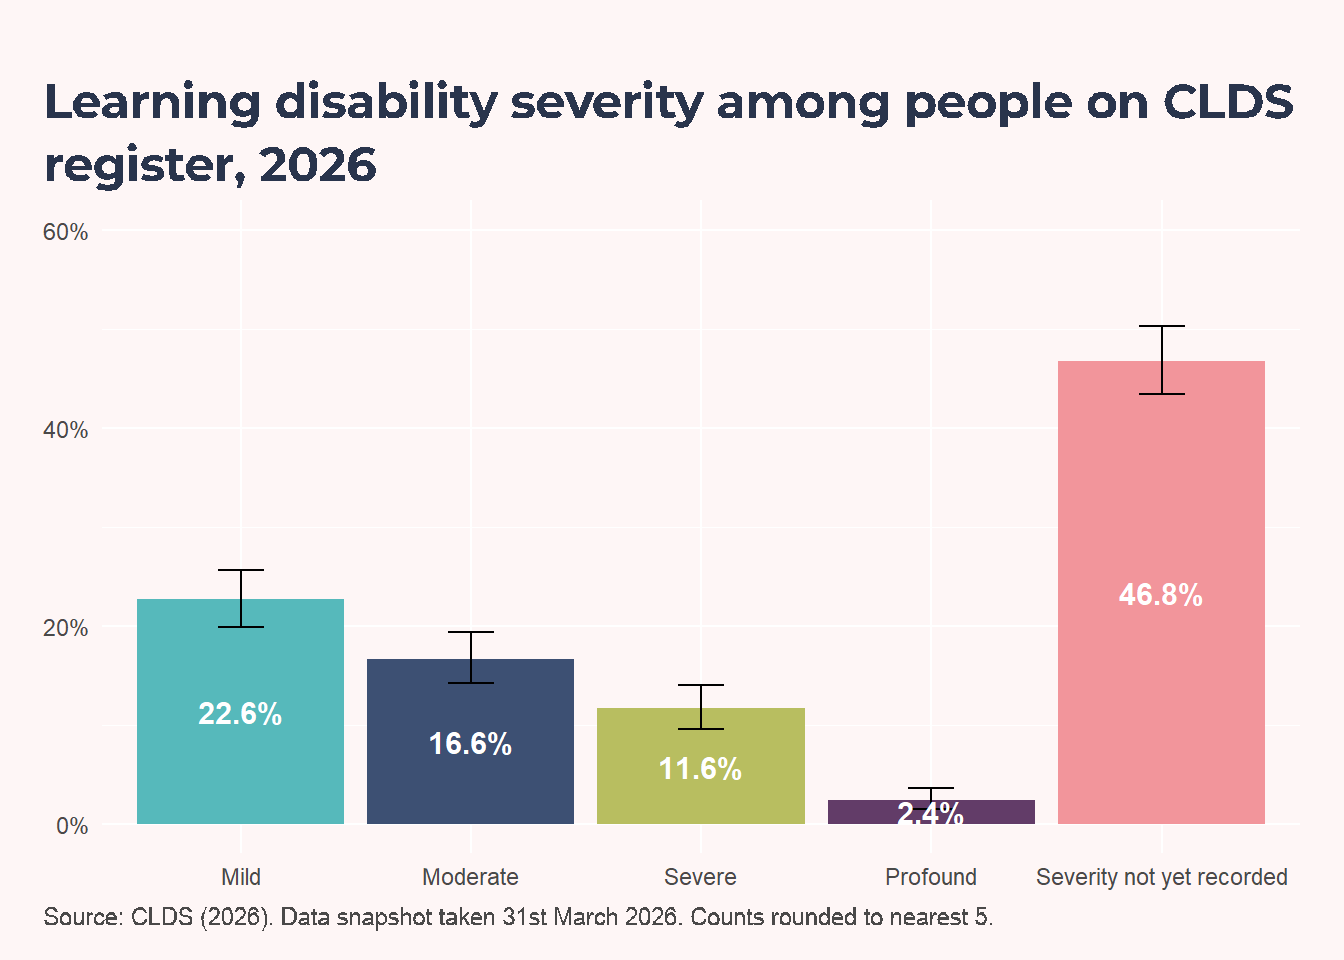
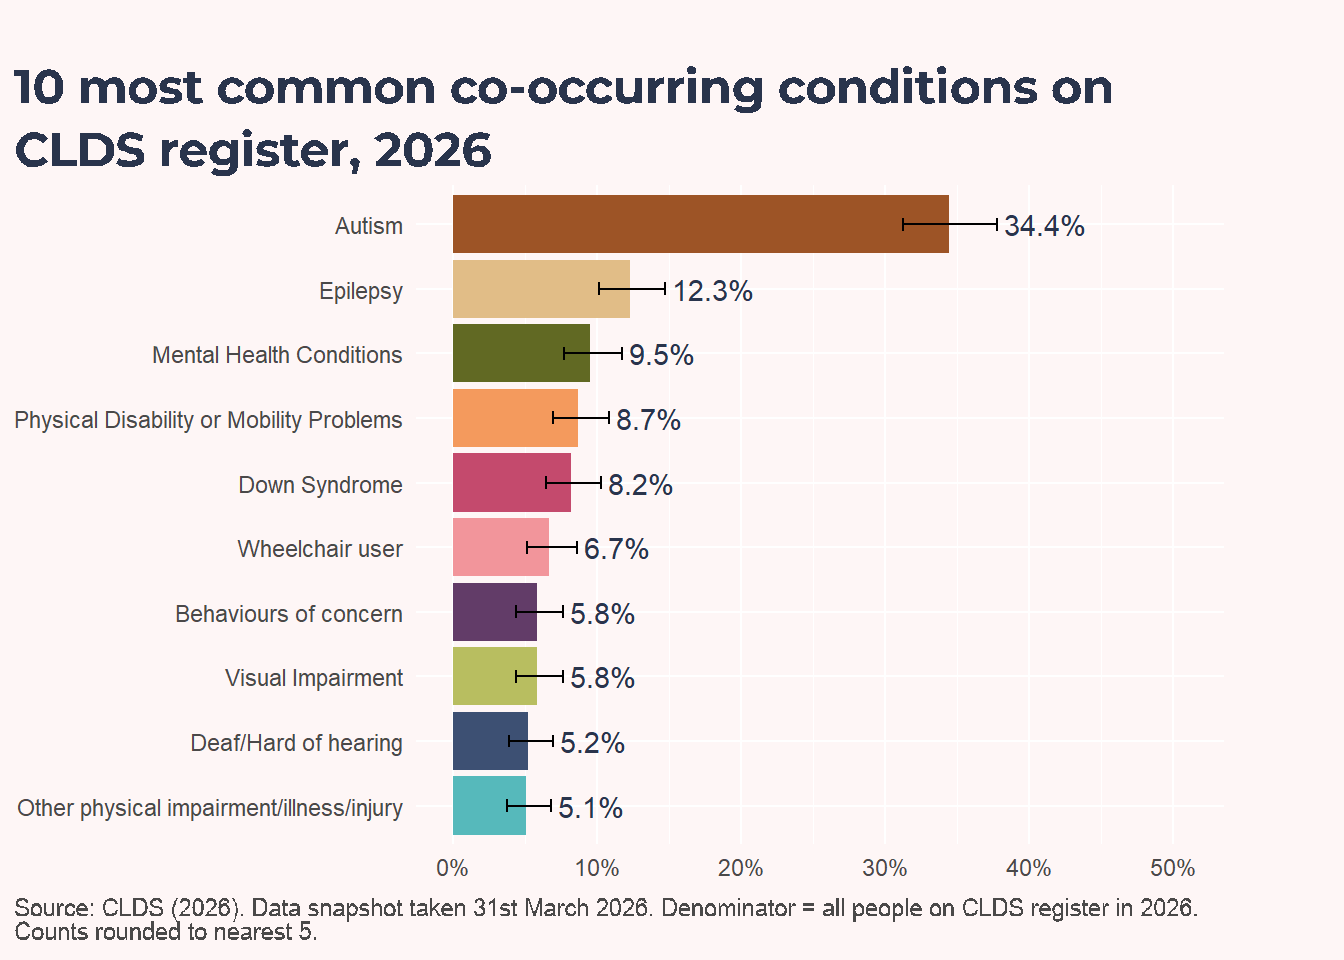
Autism (n = 280) and Down syndrome (n = 65) are among the most frequently recorded co-occurring conditions. Only 53% of people on the CLDS register have learning disability severity recorded (430 of 810), so other disabilities and health conditions may also be under-recorded. CLDS is taking active steps to review and add missing data.
Carers and living setting
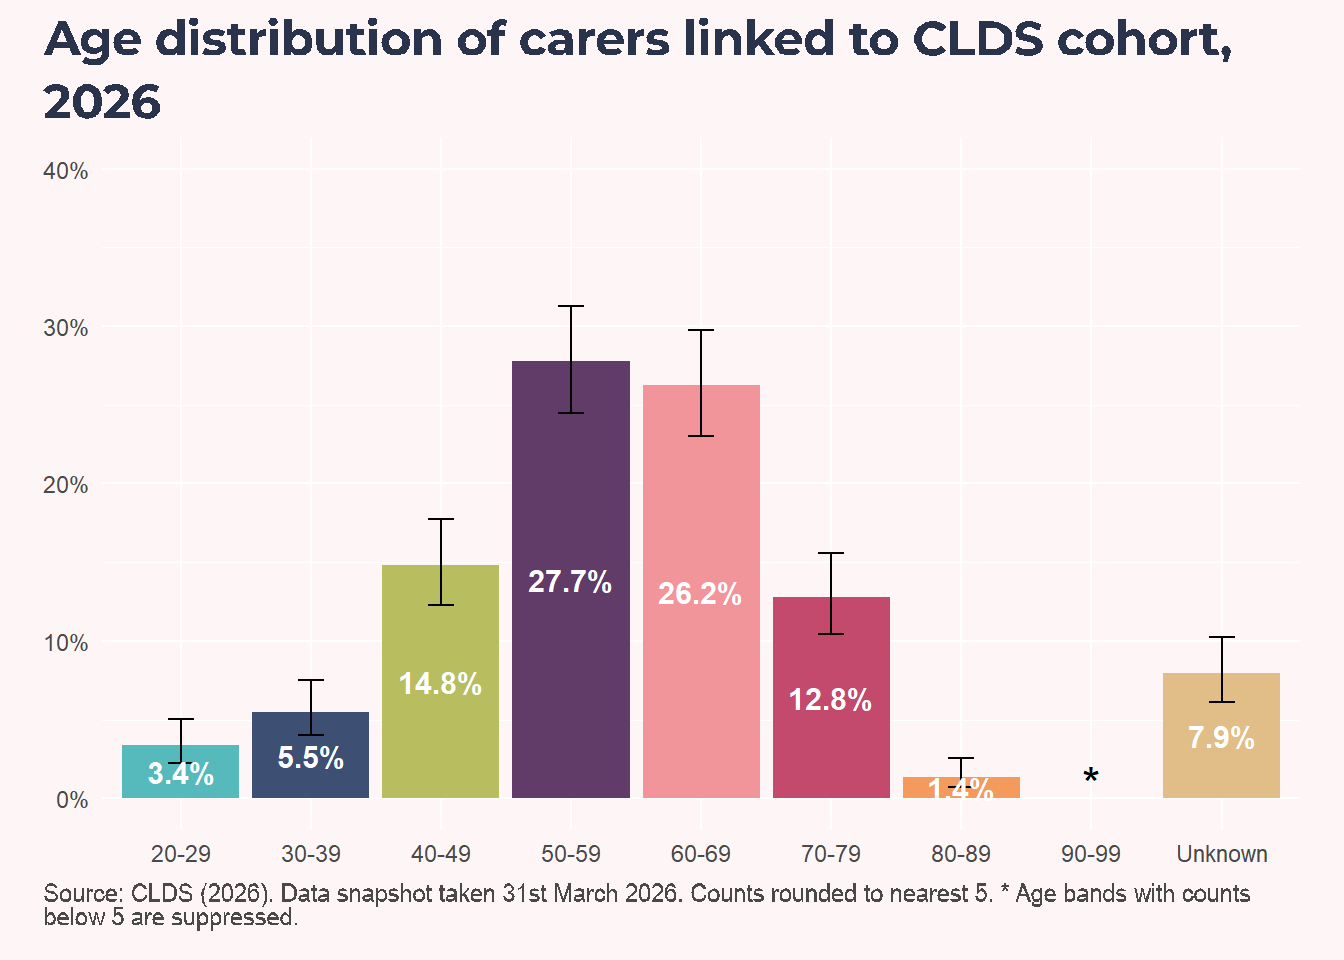
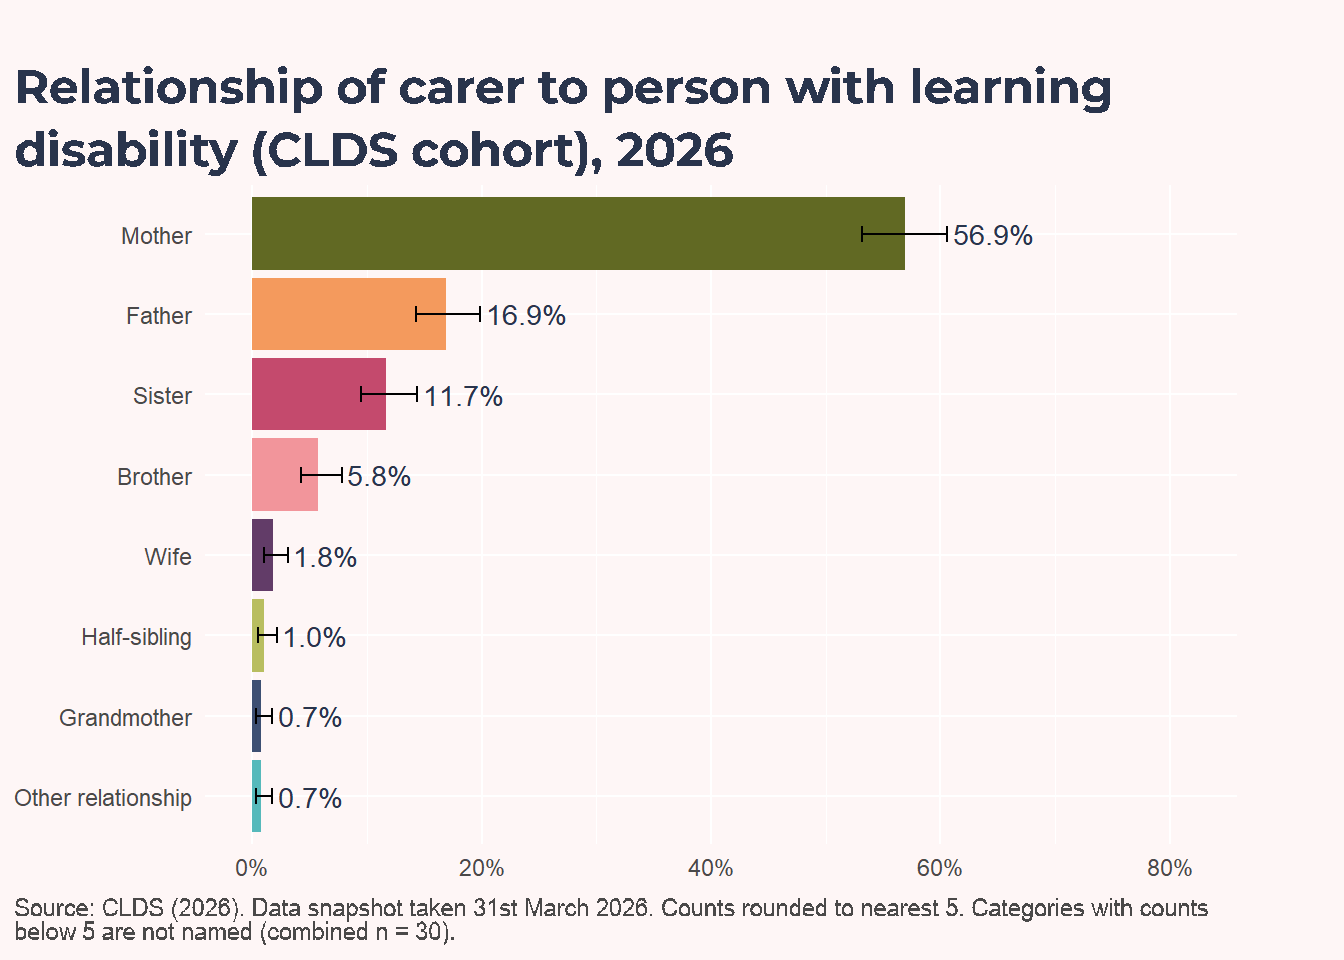
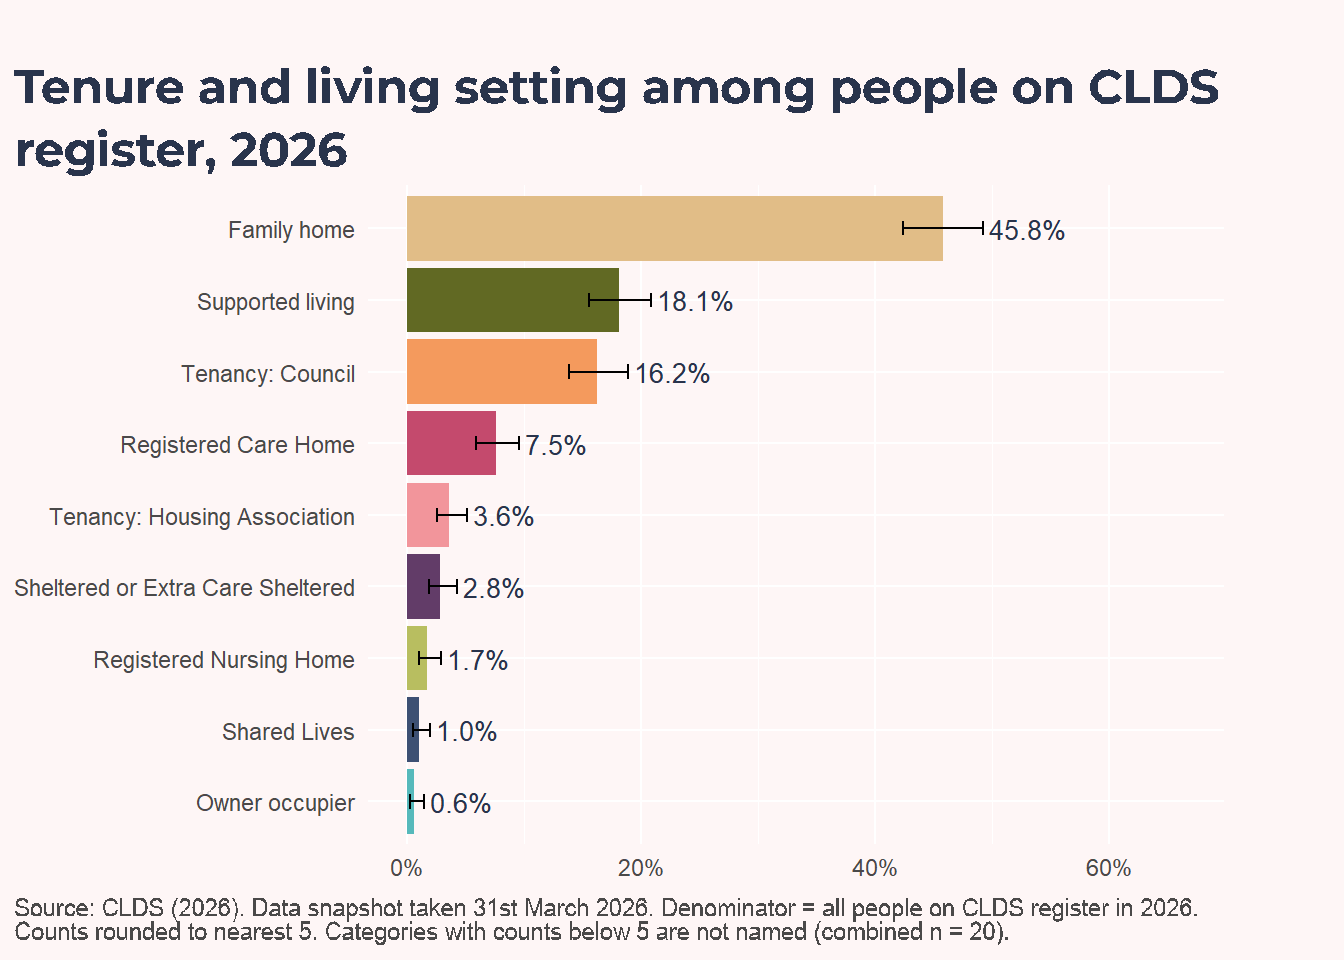
In 2026, 370 / 810 people on the CLDS register lived in the family home (45.8%).
For CLDS, living in the family home is a useful proxy for having an informal carer, but it is not exact: some people may be living with family without receiving informal care, and some people receiving informal care may be living in a separate property.
In 2026, care plans were reviewed in the last 12 months for 280 people (55.6%), and not reviewed in the last 12 months for 225 people (44.4%).
Services accessed
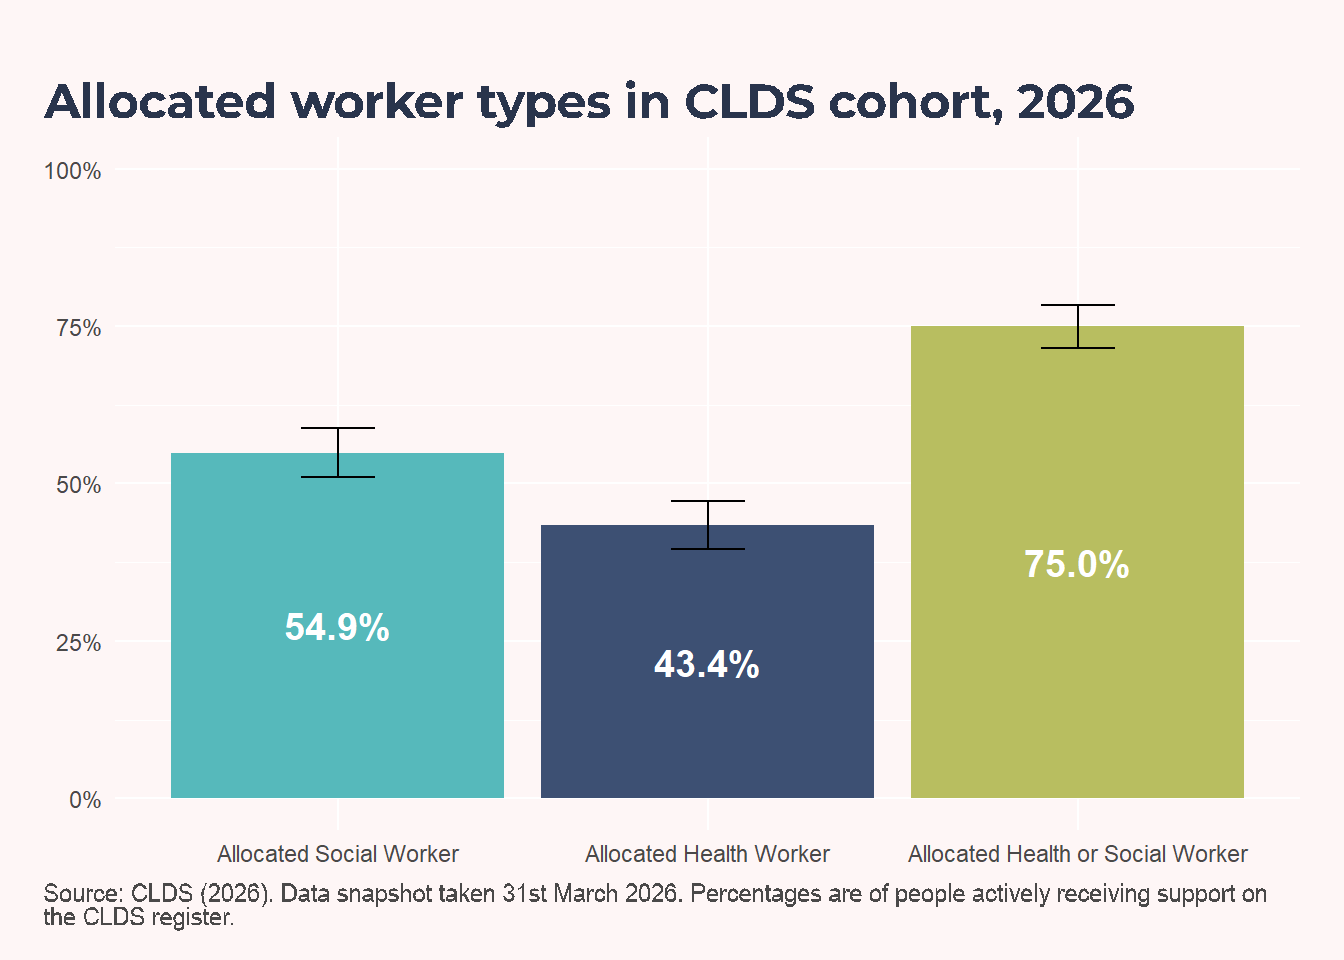
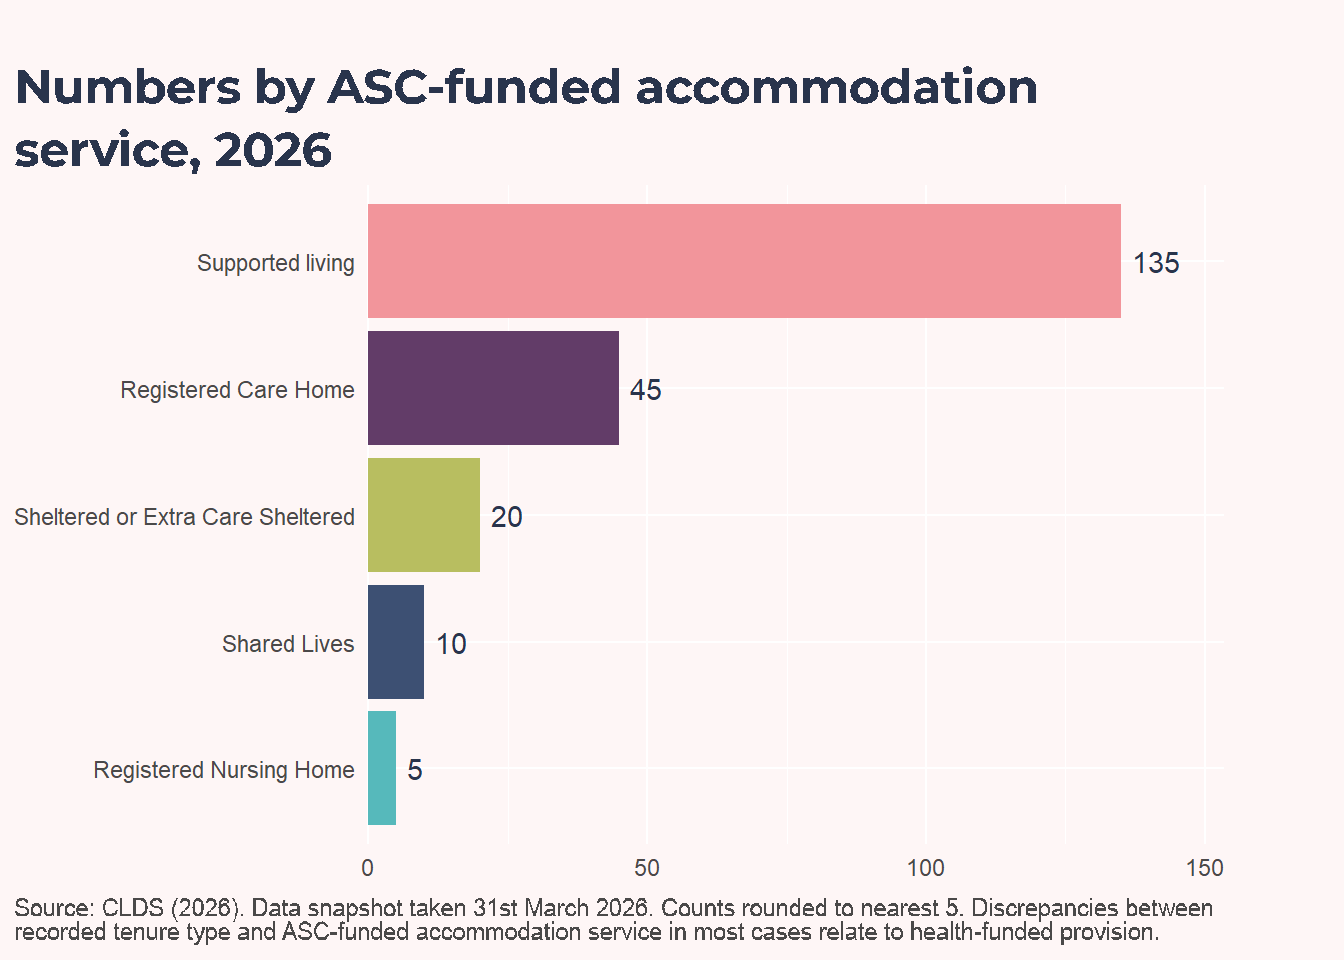
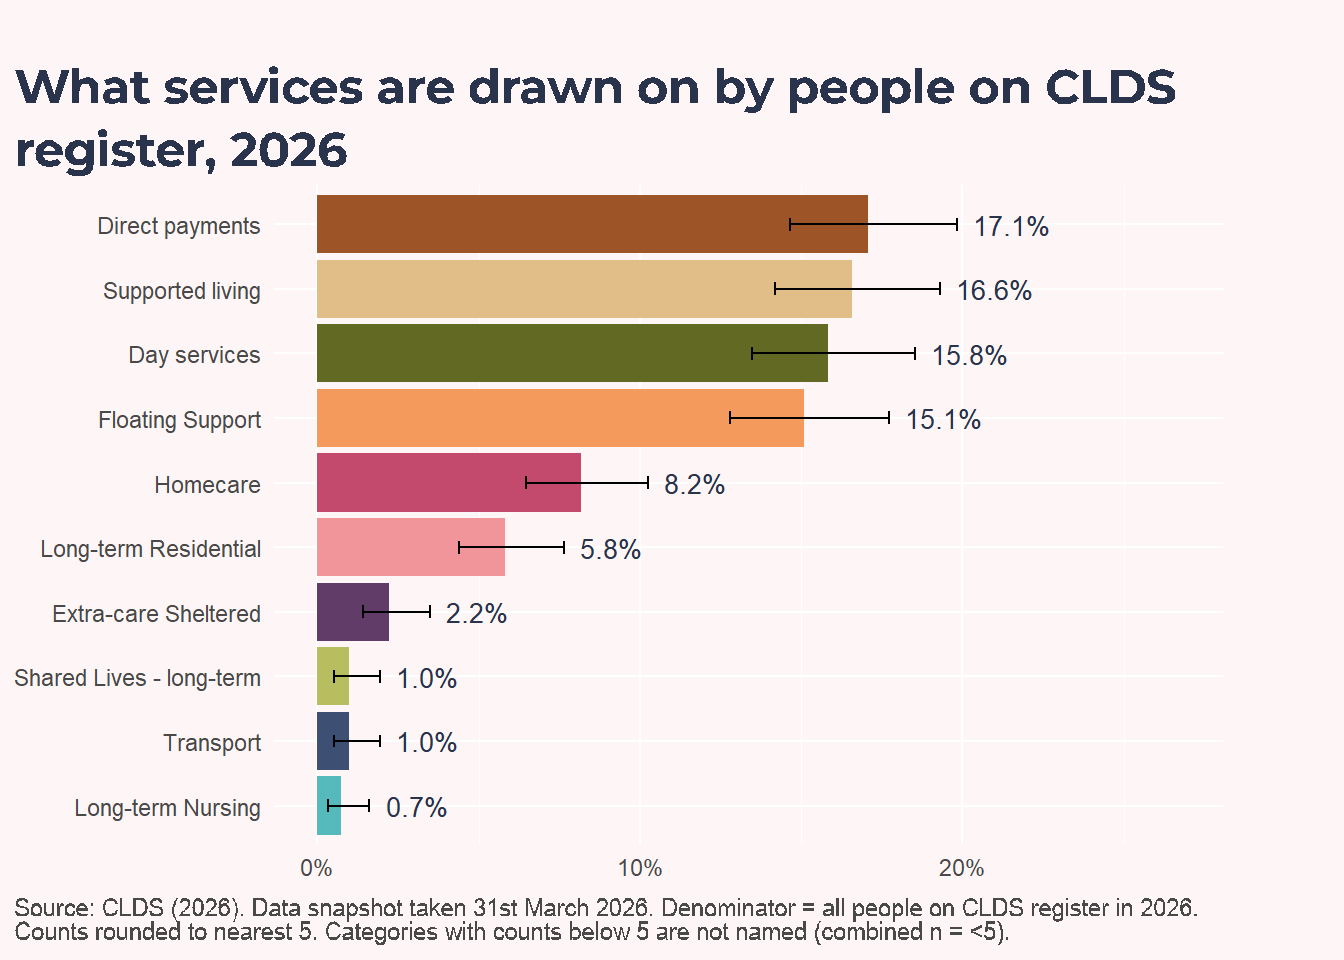
Employment
In 2026, 40 people were recorded as seeking work and 55 were recorded as employed. Of those recorded as employed, 14 are in receipt of services and are reviewed annually, and around six others are also confirmed to still be in employment. Because people in employment are often among those with lower ongoing support needs, some may have long periods without CLDS contact, so employment status may be out of date for a subset.
CYPDS
Demography and time trends
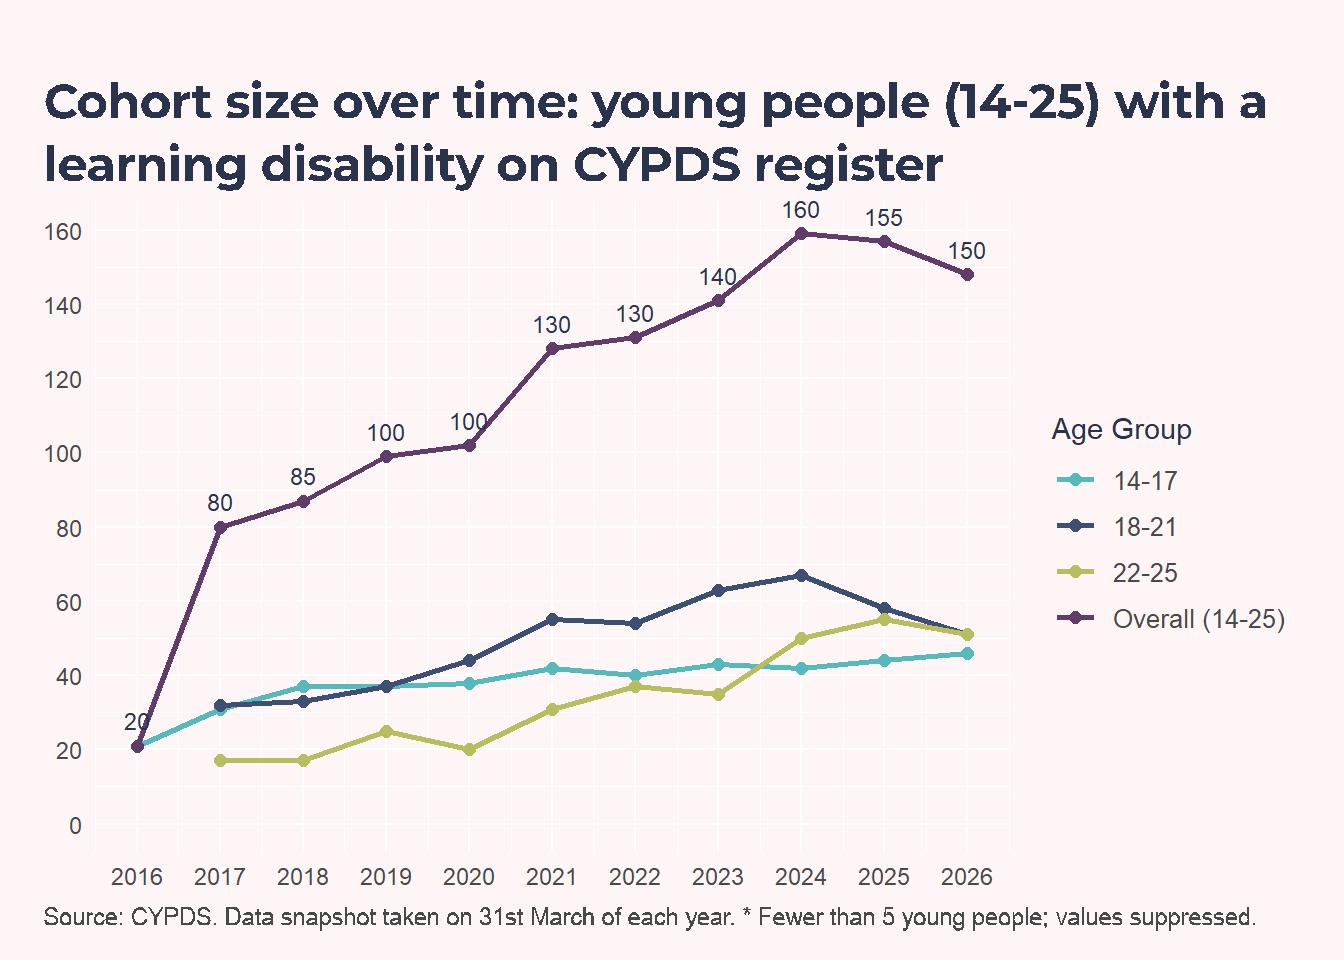
Referrals and support
Conditions and inequalities
Education
NoteTechnical Note - Learning Disability Proxy
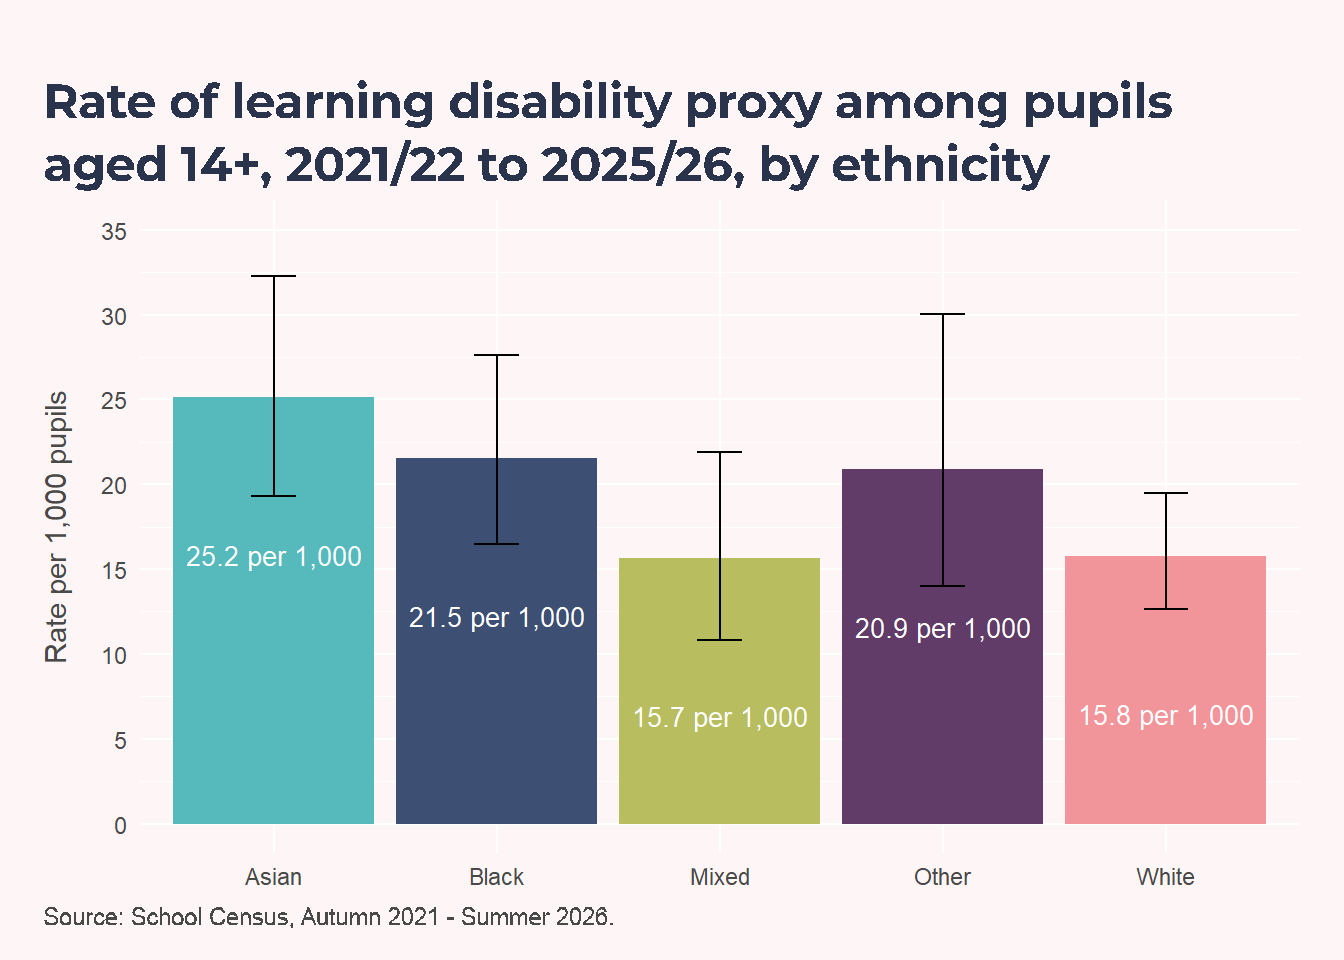
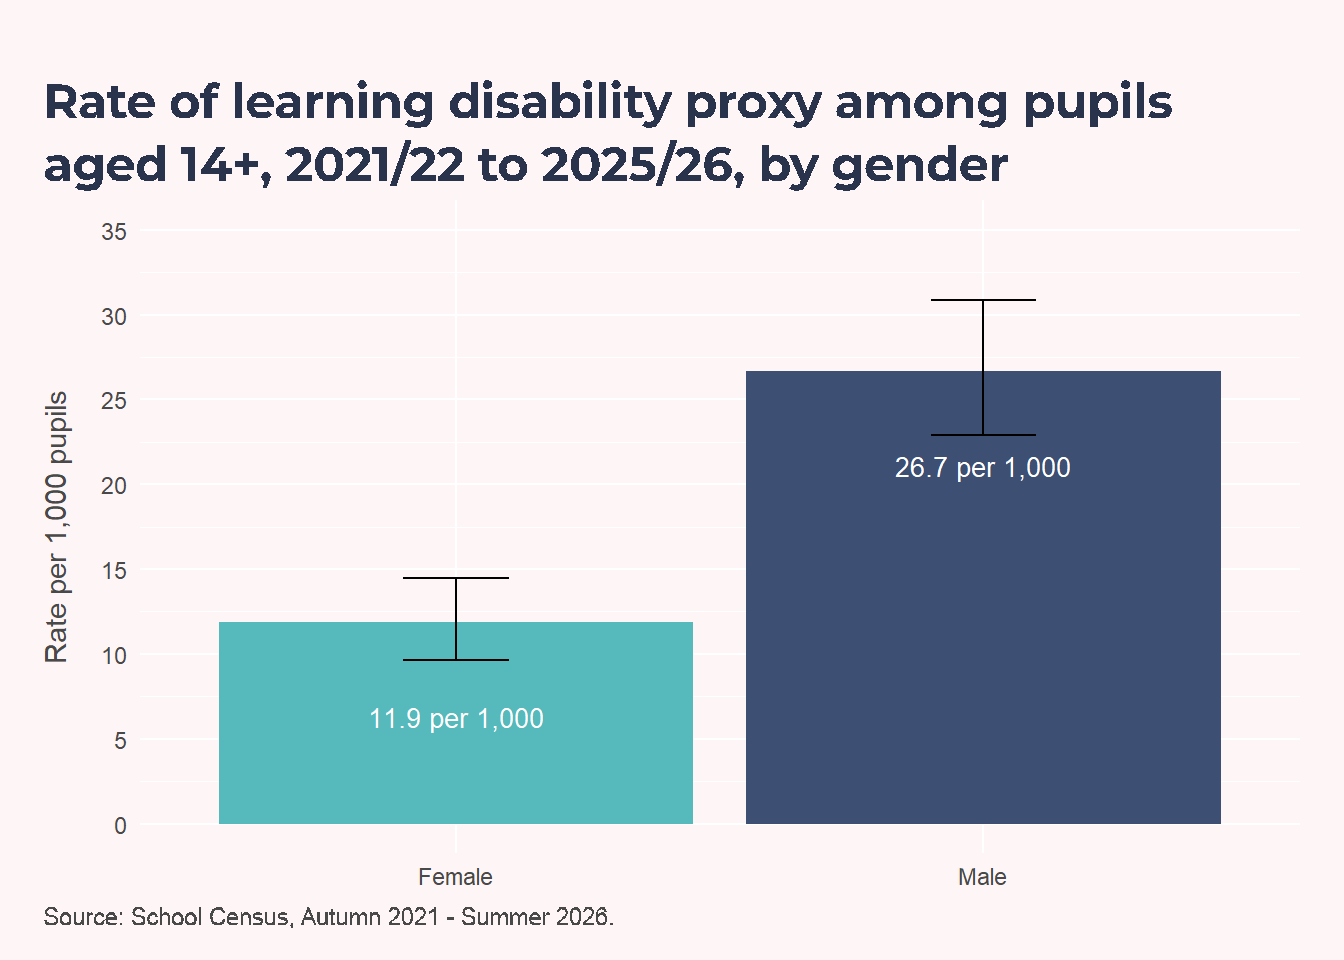
In education datasets, the term “learning disability” is not used in the same way as in health and adult social care. Education coding more commonly uses “learning difficulty” categories, which can include learning disability and other needs such as dyslexia and ADHD.
For this reason, this section uses a learning disability proxy based on pupils with moderate learning difficulty (MLD), severe learning difficulty (SLD), or profound and multiple learning difficulty (PMLD). This approach has been used in previous analyses of education data where direct clinical learning-disability identification is not available.
| Pupils aged 14+ with a learning disability proxy by category | ||
| Summer 2026 school census (n = 5,960 pupils) | ||
| Learning disability proxy category | Pupils | % of pupils |
|---|---|---|
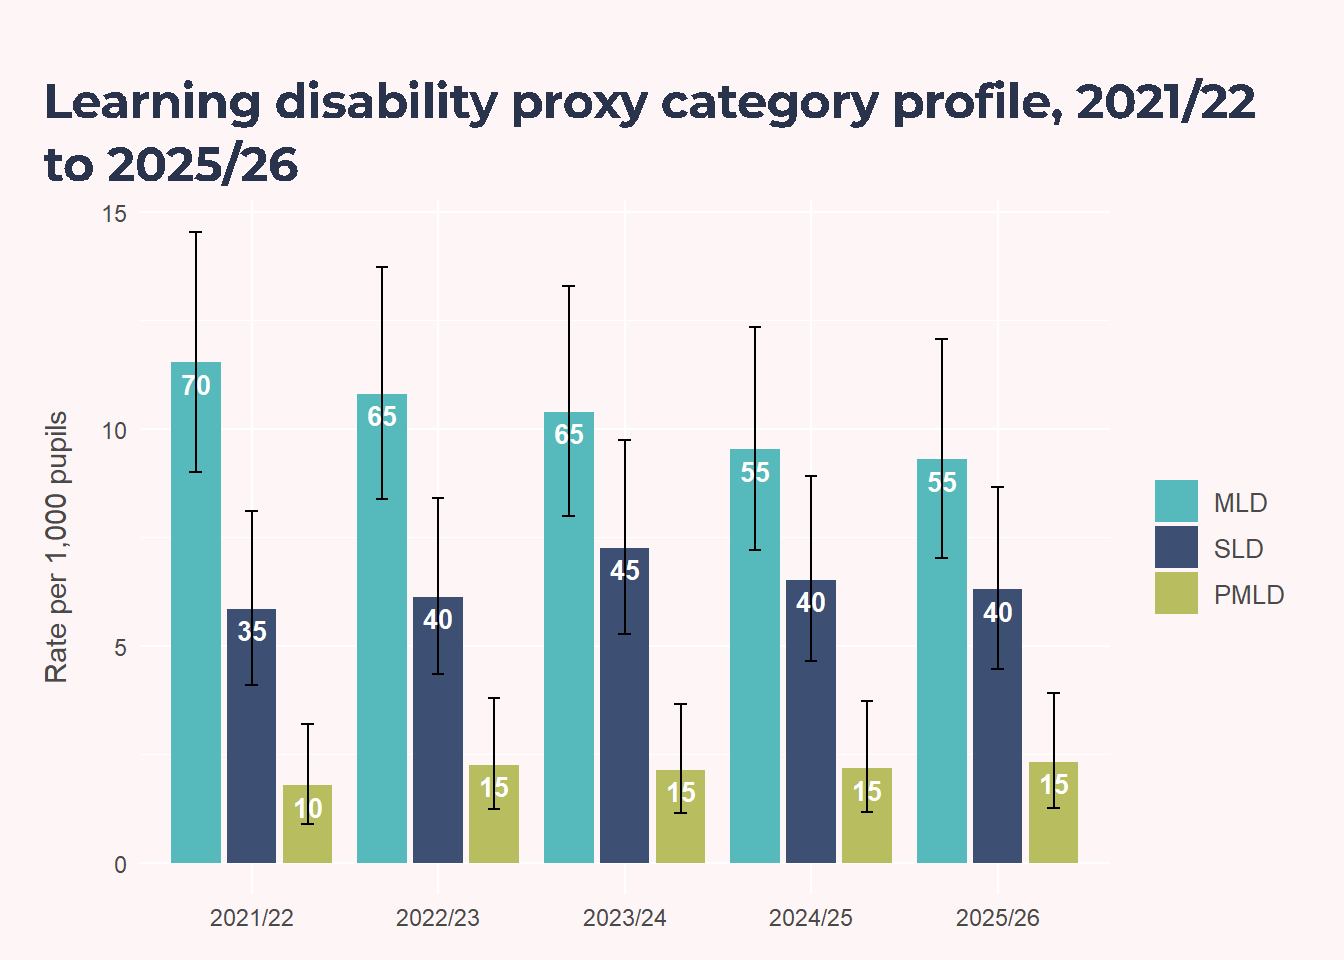
| Moderate Learning Difficulty | 55 | 0.9 |
| Severe Learning Difficulty | 40 | 0.6 |
| Profound and Multiple Learning Difficulty | 15 | 0.2 |
| Total | 110 | 1.7 |
| Source: School Census, Summer 2026. Categories with fewer than 5 pupils omitted. Remaining counts rounded to the nearest 5. |
||
Demography
Learning Support
Across unique pupils with a learning disability proxy (MLD/SLD/PMLD), 180 (65.1%) had an EHCP as their highest recorded provision, 95 (34.9%) had SEN Support, and (%) had no SEN provision recorded as highest.
Additional SEN types
This table summarises other recorded SEN types among pupils included in the learning disability proxy group.
| Other SEN types among pupils with a learning disability proxy | ||
| Unique pupils with MLD, SLD or PMLD, 2021/22 to 2025/26 (n = 280) | ||
| Other SEN type | Pupils | % of pupils |
|---|---|---|
| None | 110 | 41.4% |
| Autistic Spectrum Disorder | 55 | 20.1% |
| Speech, Language and Communication Needs | 50 | 18.7% |
| Social, Emotional and Mental Health | 35 | 12.3% |
| Physical Disability | 15 | 5.6% |
| Specific Learning Difficulty | 5 | 1.9% |
| Source: School Census, Autumn 2021 - Summer 2026. Categories with fewer than 5 pupils omitted. Remaining counts rounded to the nearest 5. |
||