The aim of this section is to use quantitative data to build a picture of VAWG in Camden. The objectives are to describe:
The prevalence of VAWG in Camden, including comparison to London and national figures; changes over time; types of VAWG; and geographical variation
The characteristics of victims and suspects of VAWG in Camden
Service demand and referral pathways in Camden
Outcomes of reporting crimes and services
The acronyms used in this section are listed below.
| Acronym | Full Form |
|---|---|
| APTR | Accused Perpetrator |
| ASC | Adult Social Care |
| CSN | Camden Safety Net |
| CSSW | Children Safeguarding and Social Work |
| CSEW | Crime Survey for England and Wales |
| CYP | Children and Young People |
| DVA | Domestic Violence and Abuse |
| EH | Early Help |
| FGM | Female Genital Mutilation |
| MARAC | Multi-Agency Risk Assessment Conference |
| MASH | Multi-Agency Safeguarding Hub |
| MPS | Metropolitan Police Service |
| ONS | Office of National Statistics |
| VAWG | Violence Against Women and Girls |
| IDVAs | Independent Domestic Violence Advisers |
Approach
Scope
This report focuses on VAWG as defined by the United Nations definition of gender-based violence. This assessment covers the whole population of Camden and crimes that occur within the borough.
Informed by a mixture of legislation, and other adopted abuse types within VAWG, the abuse types covered in this report are:[103],[104]
Domestic violence & abuse (DVA)
Controlling or coercive behaviour
Violent or threatening behaviour
Economic abuse
Physical or sexual abuse
Psychological, emotional, or other abuse
Female genital mutilation (FGM)
Forced marriage
Domestic homicide
Honour based violence
Sexual exploitation
Sexual violence
Stalking and harassment
While data focusing on DVA is undoubtably the most comprehensive, this assessment aims to ensure other forms of VAWG are represented where possible. A common challenge in measuring the prevalence of VAWG is the absence of a robust, comprehensive data source, as it is often a hidden crime.[105] In addition, difficulties in identifying and recording different forms of VAWG, coupled with inconsistencies across data sources, can lead to double counting of offences. This underscores the reality that VAWG-related offences frequently overlap and co-exist.
Whilst this analysis primarily focuses on 2024, data will also go back five years to 2019 where available, ensuring that trends across time are considered. The COVID-19 pandemic had an impact on the incidence and reporting of VAWG offences, and this which is likely to affect the data captured between 2020-2024 period. By looking back to including data from 2019, it allows comparison of 2024 data to pre-pandemic data and reflect the changes over that period.
It is worth noting that victim and survivors of VAWG may only disclose the offence or their situation until many months after it has commenced or occurred, if they report it at all. For this reason, data used in this report will focus on the date that offences were first recorded rather than the date that the offence was alleged to have taken place.
Analysis will primarily be conducted on at a Local Authority level, allowing for benchmarking to other boroughs. There will also be comparison to London wide trends, and England national figures where possible.
Data sources
The main data sources were Metropolitan Police Service (MPS) crime data and data from Camden Council services. A full table of data sources can be found in Appendix 6a.
Metropolitan police service data
The largest external data source used across this assessment is from the Metropolitan Police Service (MPS). The data is comprised of London crime level data from 2020 to 2024, data on Camden-specific crimes since 2019, and suspect and victim demographic information.
Structure of MPS data
Within MPS data, each offence is assigned a group and subgroup, following national guidelines.[106] The MPS then apply a further categorisation, flagged as a specific VAWG offence where appropriate. The full categorisation of crimes within MPS data can be found in Appendix 6b. Moreover, MPS supply the data with flags for DVA, FGM, forced marriage and honour based violence. One offence can have multiple flags if applicable.
The conditions which might lead to an offence being flagged as VAWG within MPS data are:[107]
At least one victim of a recorded crime has a recorded sex of female
Victim(s) should be 10 years and over
Either any crimes that have a DVA or honour-based abuse flag, or one of the following crimes, whether flagged as DVA or honour-based abuse or not:
forced marriage
female genital mutilation
homicide
rape
other sexual offences
violence with injury
public fear, alarm or distress
exploitation of prostitution
stalking and harassment
modern slavery
To align MPS data to the definition and included abuse types used within this work, flags have been created. Informed from the UN definition of VAWG, these flags form the basis for analysis of each abuse type.[108] The full table is available in Appendix 6c. As VAWG-related offences often overlap and co-exist, some offences are counted as more than one type of abuse. While DVA includes different subtypes, this analysis takes a broad approach, including any VAWG offence that could be related to DVA, even if it’s not clearly labelled as such.
This analysis uses date of recording, not date of offence, as there is often a delay between a VAWG offence occurring and it being reported.
Limitations of MPS data
Underreporting of VAWG offences
One of the biggest limitations of VAWG data is the underreporting of VAWG cases, and the actions taken afterwards. Figure 2 details the pathway that DVA cases follow within the legal system, highlighting at which point individuals may enter or leave the system. In addition to this, the MPS data only contains crimes, rather than non-crime incidents. This analysis relies predominantly on police records logged as “domestic-related crimes”, meaning it captures only incidents that were formally reported. As a result, it implicitly highlights the many cases that go unrecorded, and therefore remain absent from the dataset.
Many types of VAWG are often hidden; For example, sexual violence, stalking, and honour based abuse often occur in private or are obscured and may never come to the attention of authorities. Victim/Survivors may be deterred from reporting due to fear of retaliation, lack of trust in services, or cultural and social pressures.[109]
As a result, the official figures significantly underestimate the true prevalence of VAWG, creating substantial challenges in understanding the scale of the issue and effectively allocating resources. This data gap also limits our ability to assess the effectiveness of interventions and develop evidence-based policies to combat VAWG.
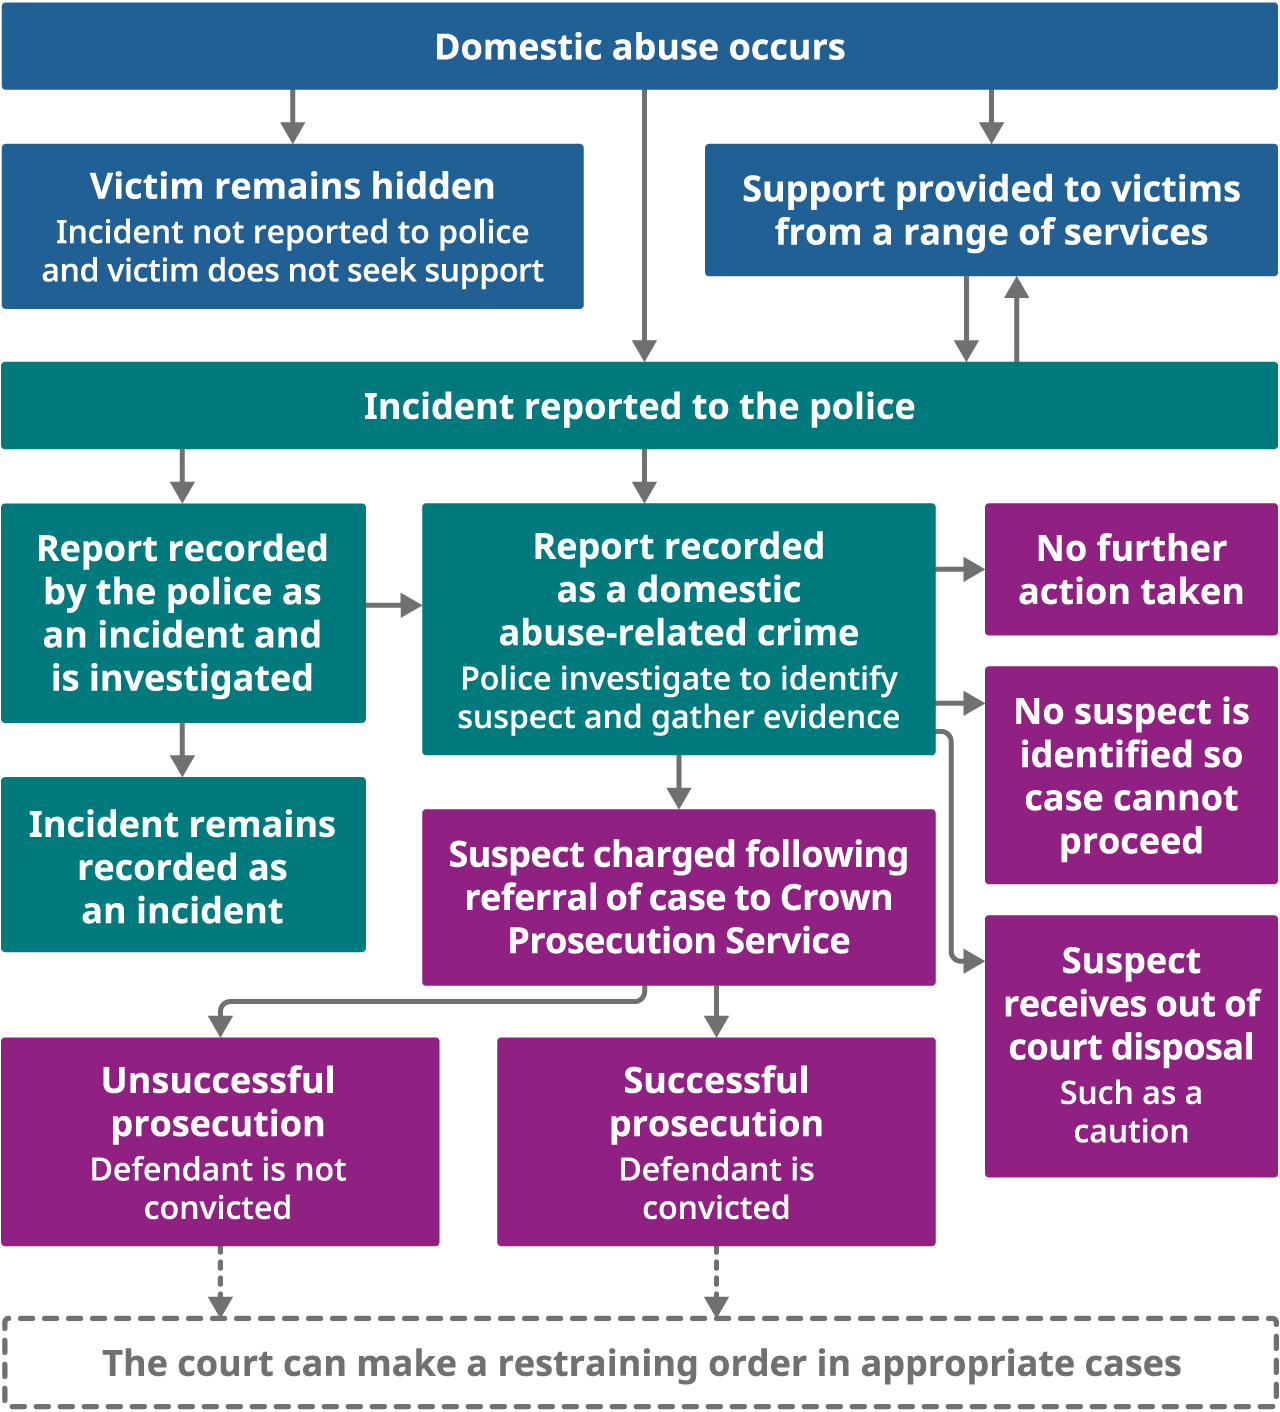
Figure 2: How domestic abuse data are captured through the criminal justice system - Office for National Statistics
Recording of VAWG crimes by MPS
In March 2024, the MPS introduced a new system, CONNECT, which integrates several previous legacy systems. With this implementation, the methodology used to count DVA offences has changed. Due to this, totals from March 2024 onwards cannot be directly compared to other periods.[110],[111] To account for this, while 2024 will serve as the sole basis for yearly analysis, temporal comparisons across different years will only extend up to 2023, or within a year.
Population data
Where possible, crime rates have been calculated specifically for this analysis based on Office of National Statistics (ONS) population estimates. Where the crime was marked as VAWG, the crime rate is calculated using the population estimates for the female population as the denominator, whilst the crime rate for all (non-VAWG specific) crimes has been calculated using the entire population estimate. The estimates used are based on the year in which the offence was recorded, with 2024 offences being divided by the mid-2023 population estimates from ONS. A table of calculations used to make metrics is available in Appendix 6d.
These calculations are complicated by the doubts over accuracy of population measures; The 2021 Census recorded Camden’s population at approximately 220,000, which was significantly lower than the previously projected figure of 280,000 based on the 2011 Census. This gap may be partly explained by temporary population shifts during the COVID-19 pandemic, with some evidence suggesting a reversal of that trend in subsequent years. Camden Council recognises that while the 2021 Census figures may underestimate the true population, the earlier projections may have overestimated it.[112] Due to this, crime rates could be overinflated and should be interpreted as estimates.
The 2021 Census was also used to provide information on the demographics of Camden population for comparisons, where appropriate. The 2021 Census cannot be used as a comparator for disability due to differences in how the information is collected. The census asks about health conditions people have that affect their daily life, rather than whether someone identifies as disabled, so likely captures people who would not identify as disabled when interacting Camden services.[113]
Other data sources
Data on victim demographics was collected from Victim Support from the Mayor’s Office of Policing and Crime (MOPAC).
Any other data sources used in this section are cited when used. Throughout this report, we will indicate whenever data is missing, insufficient, or unavailable for certain populations. Where local data is unavailable, we have presented regional, national, or other published evidence instead. However, the risk of VAWG in Camden is likely different from the risk regionally or nationally and therefore these figures may not be applicable to Camden.
While we are aware of numerous organisations delivering VAWG related services in Camden, data requests were focused on Council provided or commissioned services and key partners (e.g. police) due to the limited time and capacity to complete the needs assessment. These sources were prioritised primarily due to existing data sharing arrangements, the scale and comprehensive nature of the data, and them being the main source of VAWG-related data. Where it was possible to capture service-specific data from additional sources, that has been summarised in Chapter 4 and incorporated into the data analysis where possible.
Approach to analysis
Camden’s population
Data from the 2021 Census was used to describe the population of Camden. The percentage of the population within at-risk groups in Camden were compared to figures from London and England and Wales.
Recorded VAWG offences in Camden
Crime rates were calculated as the number of offences per 1,000 residents. The prevalence of VAWG offences were calculated per 1,000 female residents for Camden, all London boroughs and England that were reported in 2024. Rates for 2024 used the 2023 population estimate as 2024 estimates were not currently available at the time of analysis.
Data were examined by abuse type. Changes over time were only considered from 2019 to 2023 due to the change in data collection system in 2024.
Victim and suspect profiles
VAWG victim/survivors and suspects in 2024 were described in terms of protected characteristics and other characteristics relevant to risks associated to VAWG abuses. Information on victim/survivors and suspects were sourced from data on reported crimes and people accessing Camden services.
The report looks at all protected characteristics in the Equality Act 2010 and care leavers, which is considered a protected characteristic in Camden.[114]
In addition to protected characteristics, this report also considers other groups who are disproportionately affected by VAWG offences. The other factors we consider are Children and Young People (CYP), women experiencing homelessness or in temporary accommodation, employment status, school pupils, children involved in social care and child protection services. Other vulnerable populations were not included due to a lack of data, for example women on low incomes or single parents.
Service demand and referrals
Referrals to and progress through each service where VAWG abuses may be seen are described.
Outcomes
A positive outcome is recorded in crime data if there is a criminal justice outcome, including formal charges, cautions, community resolutions, and penalties.
Measuring outcomes for survivors that utilise Camden services is challenging. Progression through the services is not linear, measures of success are indeterminate and there can be several outcomes at each stage of contact. For numerous services, the support offered cannot be quantified or recorded, such as emotional support or building a strong relationship with the survivor that empowers them.
It is difficult to get a holistic view of one survivor’s movement through multiple services: For example, system limitations, complexity in cases and differences in data collection methods can hinder the accuracy of service progression. There is now an internal focus to develop a single view of victims, aligning several data sources to ensure the outcomes can be tracked and measured.
Statistical testing
All comparisons were tested for statistical significance. Any differences reported are statistically significant unless otherwise stated. Details of statistical methods used for significance testing are in Appendix 6e.
Camden’s population
The latest population estimates, released in 2023, put Camden’s population at 220,903, and 117,718 of these were women and girls. The distribution of sexes within Camden is 53% female and 47% male.
In the 2021 census, the median age of Camden residents was 34 years old, slightly younger than the London median of 35. Camden residents are more likely to be single and have never been married or in a civil partnership (42.3%) compared to London (35.7%) and England and Wales overall (26.7%).
The 2021 Census reported that 15.2% of residents were disabled. In GP practice records, 0.36% of patients in Camden have a learning disability recorded. Poor health and disability rates are higher in Camden than in London, with women more affected than men.[115]
Within Camden, 0.7% of the population identified with a gender different from their sex registered at birth. Focusing on trans women, Camden has 0.1% less than the London total but is in line with England and Wales. However, there were issues with how the question was asked in the census and correct interpretation by those with limited English proficiency.[116]
In 2024, there were 23,890 births. The birthrate in Camden has been declining; From a peak of 30,487 in 2018 to 2024, there has been a decrease of 21.64%.[117]
In comparison to England and Wales, Camden has an ethnically diverse population. The overall proportion of White residents in Camden is 59.5%, this is lower than the national average of 81.7%, but slightly higher than London’s 53.8%.
Camden has a more diverse sexual orientation profile than both London and England and Wales, with a higher proportion of resident identifying as gay or lesbian (3.7%), bisexual (2.5%), and pansexual (0.2%).
For the year ending March 2024, Camden had a looked-after children rate of 59 per 10,000 children, which is higher than the London average of 51 per 10,000 but still below the national average of 70 per 10,000.[118]
At risk groups
While VAWG can affect anyone, certain populations experience increased vulnerability due to intersectionality and compounded disadvantages.[119] Table 1 provides an overview of these at risk populations within Camden.
| Characteristic | At Risk Group | Camden | London | England and Wales | Source |
|---|---|---|---|---|---|
| Sex | Female Population | 53.29% | 51.45% | 50.97% | ONS Census 2021, RM121 – Sex by Age table, via Nomis |
| Sex | Female Adult Population (16 yrs old or over) | 45.79% | 41.8% | 41.36% | ONS Census 2021, RM121 – Sex by Age table, via Nomis |
| Sex | Female Children Population (under 16 yrs old) | 7.15% | 9.25% | 9.01% | ONS Census 2021, RM121 – Sex by Age table, via Nomis |
| Gender | Trans Women | 0.1% | 0.2% | 0.1% | ONS Census 2021, TS070 – Gender identity - Nomis - Official Census and Labour Market Statistics |
| Housing |
Households assessed as homeless (per 1000 applications) |
1.91 | 2.83 | 1.86 (Just England) | Ministry of Housing, Communities and Local Government 2024, Statutory homelessness: Detailed local authority-level tables |
| Housing | Households in Temporary Accommodation (Single parent Female, Single adult) | N/A | 35.9%, 11.0% | 33.3%, 11.6% | Ministry of Housing, Communities and Local Government 2024, Statutory homelessness: Detailed local authority-level tables |
| Housing | Socially rented housing | 33.7% | 23.1% | 17.1% | ONS Census 2021, TS054 |
| Ethnicity | Black, Asian and other Ethnicity Minorities | 43.6% | 48.5% | 19.4% | ONS Census 2021, TS021 |
| Ethnicity | Black, Asian and other Ethnicity Minorities (Female) | 41.57% | 46.89% | 18.30% | ONS Census 2021, RM032 |
| Legal partnership | Divorced (Total) | 7.4% | 7.3% | 9.1% | ONS Census 2021, TS002 |
| Divorced (Female) | 8.53% | 8.56% | 10.34% | ONS Census 2021, RM074 | |
| Sexual Orientation | LGBTQ+ Individuals | 6.9% | 4.2% | 3.2% | ONS Census 2021, TS079 |
| Sexual Orientation | LGBTQ+ Individuals (Female) | 5.62% | 3.63% | 3.31% | ONS Census 2021, TS079 |
| Disability | Disabled in Census | 15.2% | 13.2% | 17.5% | ONS Census 2021, TS021 - Disability. |
| Disability | Disabled in Census (Female) | 16.29% | 14.15% | 18.45% | ONS Census 2021, RM073 |
| Disability | Learning disability: QOF prevalence | 0.4% | 0.5% (North Central London ICB) | 0.6% | Department of Health and Social Care, Learning Disability Profiles, 2024 |
| Children and Young People | Children in need at 31 March aged under 18 years (rate per 10,000) | 490.2 | 370.2 | 332.9 | Department of Education , Children in Need reporting, 2024 |
| Children and Young People | Children Looked After (rate per 10,000) | 59 | 51 | 70 | Department of Education , Children in Need reporting, 2024 |
| Deprivation | Households in one dimension of deprivation | 31.9% | 33.5% | 32.9% | ONS Census 2021, Household deprivation - Census Maps, ONS |
Recorded VAWG offences in Camden
Crime in Camden
In 2024, Camden recorded a total crime rate of 193.7 offences per 1,000 residents, nearly double the London-wide average of 102.5. The borough’s most dominant crime type was theft, accounting for over half of all recorded crimes locally. Violence against the person, public order offences, vehicle offences and burglary were all more prevalent in Camden than London.
Recorded VAWG offences in Camden
Across the country, at least one in twelve women experience gender-based violence each year, and in 2022–23, offences related to VAWG accounted for 20% of all crimes recorded by the police.[120]
In Camden, there were 18,856 VAWG-related offences recorded in MPS data between 2020 and 2024. These make up 2.8% of the 662,819 VAWG-related offences recorded in London during this period. This also comprises 8.10% of crimes within the borough in this time. VAWG offences make up a smaller proportion of all crimes in Camden (8%) than in other London boroughs (13.6%).
Focusing on 2024, using data standardised using population estimates to calculate the rate per 1,000 female residents, the VAWG offence rate in London was 26.49 per 1,000 female residents, whereas in Camden it was 29.05 per 1,000 females, representing an increased rate of 8.83%, and above the average for London Boroughs of 26.53 per 1,000 females. The absolute figure for Camden in 2024 is 3,466 VAWG crimes. This is a statistically significant difference (p < 0.01).[121] Camden had the 11th highest prevalence of VAWG of the 32 London boroughs.
Within the abuse types of VAWG, the majority of both VAWG crimes and all crimes in 2024 for Camden are concentrated within DVA, stalking and harassment and sexual violence, comprising 35.8%, 23.7% and 18.0% of VAWG crimes respectively. Across London, a similar pattern is observed, with DVA comprising 48.4% of all VAWG crimes, followed by 37.4% stalking and harassment, and 14.1% in sexual violence.
When looking at specific crime types, sexual offences are overwhelmingly related to VAWG, with 69.8% of all sexual offences in Camden in 2024 falling under this category. Violence against the person is also significantly driven by VAWG, accounting for just under one in three offences. A similar pattern is observed in public order offences, where 28.1% are linked to VAWG.
The relationship between the victim/survivor and alleged offender changes. A key finding is that across all VAWG offences, 68% were known to the victim/survivor, which increases in Violence Against the Person to 76.6%. Stranger based incidents are more common in Public Order Offences, where over half of suspects were not known to the victim/survivor, and in Sexual Offences, where 49.8% were not known to the victim/survivor.
Changes over time
Within London, VAWG has increased over the last year and has been described as “endemic”[122]. According to published figures from the Metropolitan Police reported sexual offences increased by 7.4% in the 12 months up to the end of January 2025, compared to the previous 12 months.[123]
As previously discussed, trends in VAWG offences over time is complex, in part because changes in recording methods in April 2024, limiting the ability to compare data since the change to offences recorded before the change. This is further compounded by the impact of COVID-19 and the lag in recording offences.
Looking at offence rates among women in Camden between 2020 and 2024, there were noticeable changes from year to year. Rates went up in 2022 and 2023 compared with 2020 (by about 6% and 8%), but then dropped sharply in 2024, falling by around 16% compared with 2020. The small rise in 2021 was not meaningful.
From 2020 to 2023, Camden has seen an 8.2% increase in VAWG offences. In comparison, between 2020 to 2023, London has seen a 6.4% increase, and the average for all other boroughs was 5.7%. A statistical test showed that the percentage change in Camden’s crime rate from 2020 to 2023 was significantly different from the rest of London, indicating that this difference is unlikely to be due to chance. The fact that this difference is statistically significant suggests that Camden’s increase is not just part of a general upward trend across the capital, but may reflect specific local factors or emerging risks.
When reviewing 2024 data, from January to December, a reduction in VAWG offences in Camden per 1,000 female residents of approximately 15% was observed. London saw a 17.6% reduction in total. As previously discussed, this decrease is due to the introduction of a new CONNECT system.
Within Camden, 2020 and 2022 saw a higher proportion of VAWG crimes from all crimes, ranging from 13.3% to 12.3%. VAWG rates peaked in 2023, at 11.1%, showing an increase before the new system was introduced in 2024 when the proportion drops to just 8.1%.
Camden has maintained a fairly high position in ranking of VAWG rates per 1,000 female residents, when compared to other London Boroughs, with a rank of 7th in 2020, dropping to 8th in 2023, and now sitting at 11th.
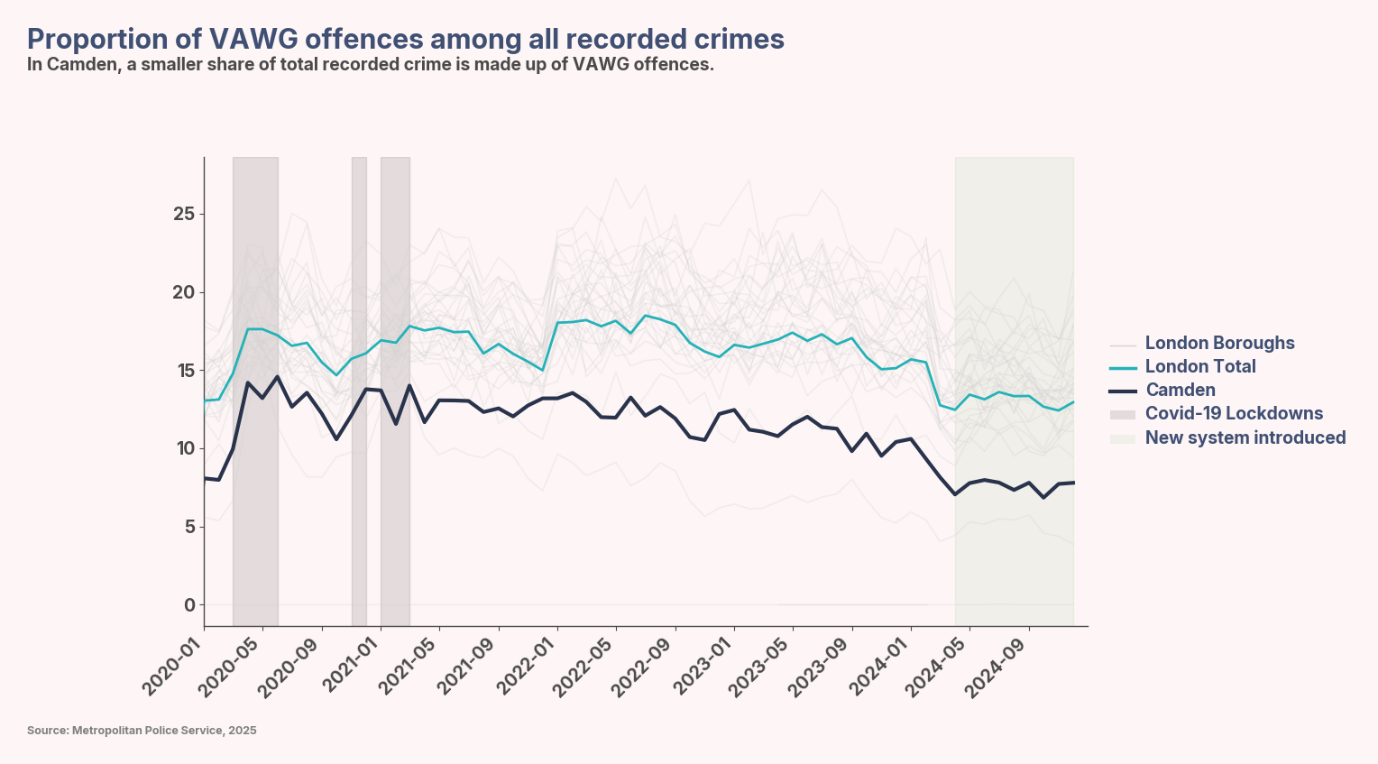
Figure 3: Proportion of VAWG offence among all recorded crimes
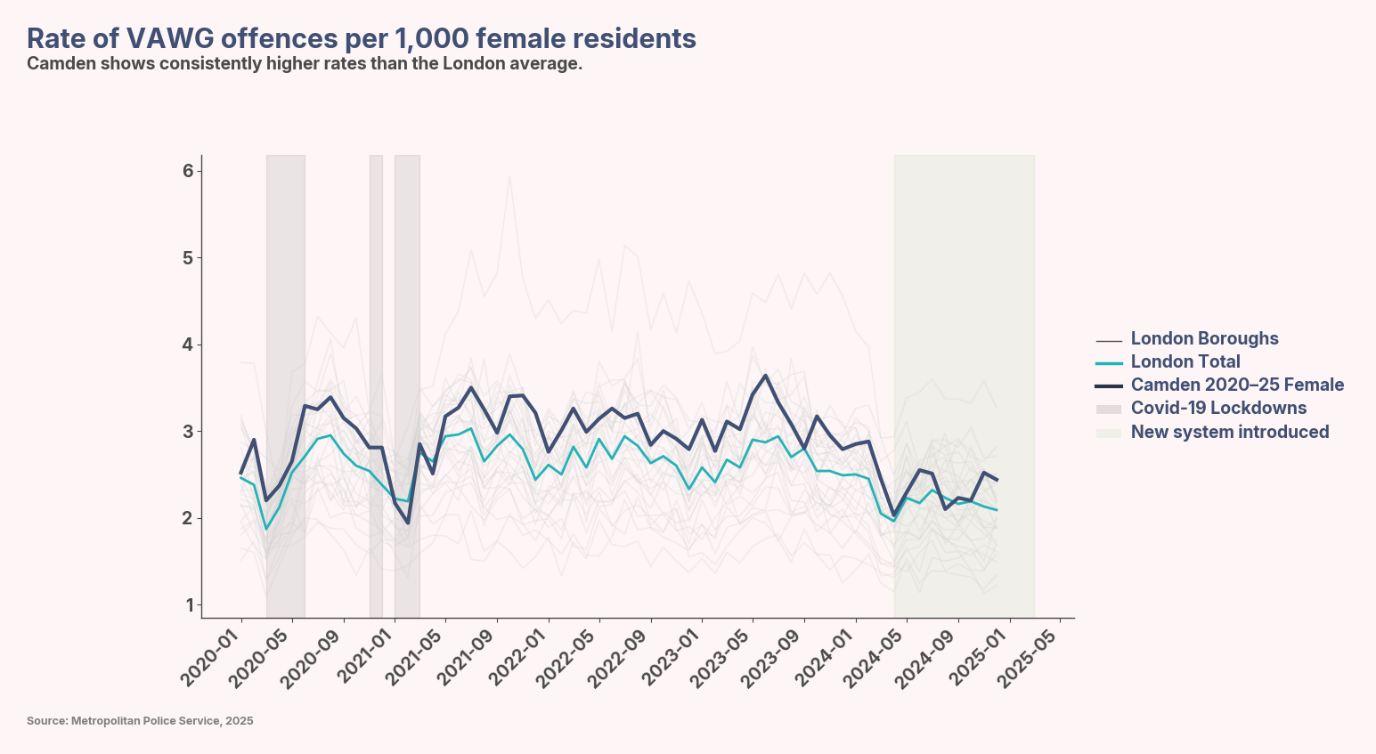
Figure 4: Rate of VAWG Offences per 1,000 female residents
VAWG abuse types
Some types of offences are noticeably more common in Camden than in the rest of London. Sexual violence stands out, with rates more than 40.8% higher (5.2 per 1,000 people in Camden compared with 3.7 per 1,000 across London). Other offences also occur more often in Camden, including stalking and harassment (+18%), physical and sexual abuse (+23%), and violent or threatening behaviour (+18%). All of these differences are highly statistically significant.
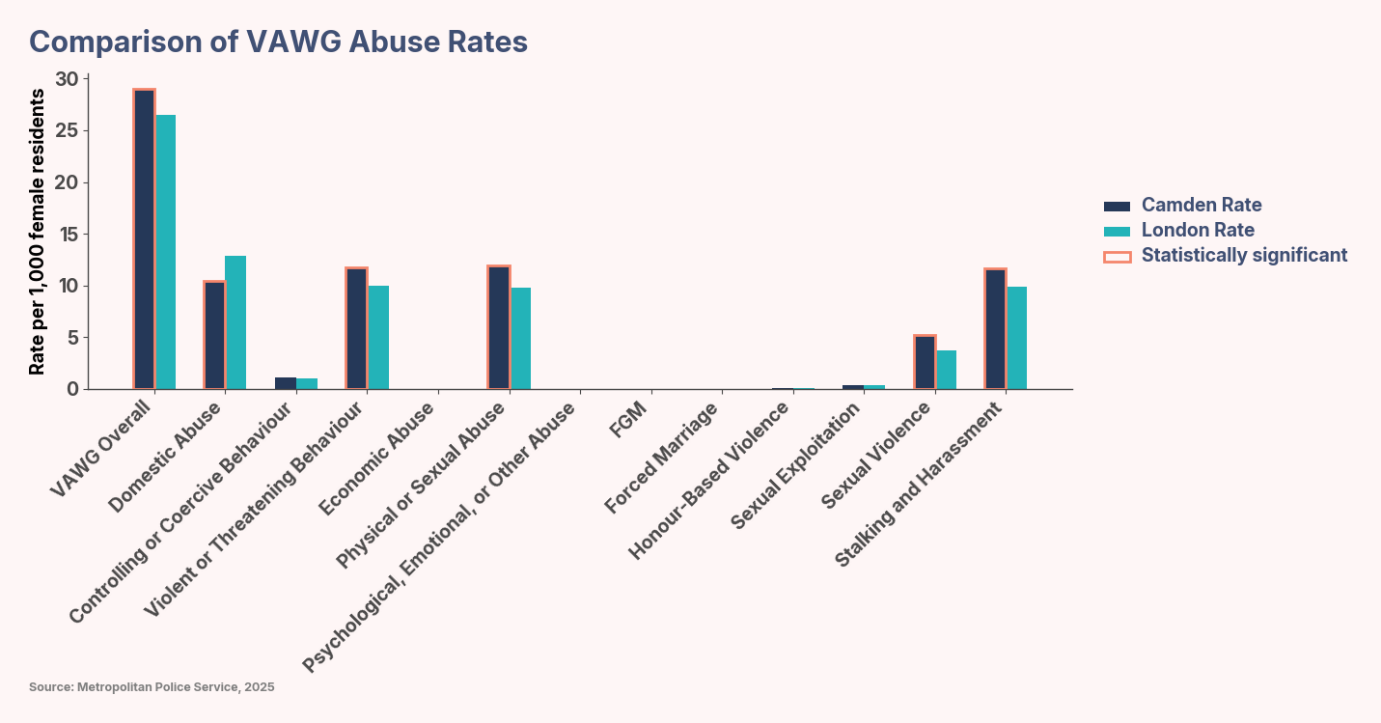
Figure 5: Comparison of VAWG abuse rates per 1,000 female residents
Conversely, DVA rates in Camden were 18.9% lower than the rest of London (10.5 compared to 13.0 per 1,000), a statistically significant difference (p < 0.001).
Other offence types such as FGM, forced marriage, honour-based violence, sexual exploitation, and controlling or coercive behaviour showed no statistically significant differences, with very low overall rates.
| Offence Type | Camden Rate (per 1,000) | Rest of London Rate | All London Rate | % Diff (Camden to Rest of London) | Z-Score | P-Value (2.d.p) | Significant (p < 0.05) |
|---|---|---|---|---|---|---|---|
| Overall (all VAWG Offence) | 29.05 | 26.46 | 26.49 | 9.82% | 5.47 | 0.00 | True |
| Domestic Abuse | 10.47 | 12.91 | 12.83 | -18.93% | -7.35 | 0.00 | True |
| FGM | 0.01 | 0.00 | 0.00 | 443.49% | 1.78 | 0.08 | False |
| Forced Marriage | 0.03 | 0.02 | 0.02 | 44.47% | 0.63 | 0.53 | False |
| Honour-Based Violence | 0.05 | 0.08 | 0.08 | -35.52% | -1.07 | 0.28 | False |
| Sexual Exploitation | 0.34 | 0.32 | 0.32 | 6.05% | 0.37 | 0.71 | False |
| Sexual Violence | 5.19 | 3.69 | 3.73 | 40.58% | 8.32 | 0.00 | True |
| Stalking and Harassment | 11.66 | 9.88 | 9.91 | 18.04% | 6.09 | 0.00 | True |
| Physical or Sexual Abuse | 11.91 | 9.70 | 9.75 | 22.76% | 7.61 | 0.00 | True |
| Violent or Threatening Behaviour | 11.78 | 9.95 | 9.98 | 18.47% | 6.26 | 0.00 | True |
| Controlling or Coercive Behaviour | 1.08 | 1.05 | 1.05 | 2.95% | 0.32 | 0.75 | False |
| Psychological, Emotional or Other Abuse | 0.01 | 0.01 | 0.01 | 52.18% | 0.41 | 0.68 | False |
Domestic violence and abuse
In 2023, the Crime Survey for England and Wales (CSEW) estimated that one in four women (27%) had experienced DVA since the age of 16.[124] While long-term trends from the CSEW suggest a gradual national decline in prevalence since 2005, DVA remains a major concern[125]. In the year ending March 2024, police recorded 851,062 DVA-related crimes across England and Wales, comprising 15.8% of all recorded crime. Of these, 72.5% of victims were women.[126] Notably, the number of DVA-related incidents rose to 499,366 from 482,772 the previous year, but the number of DVA-related crimes actually fell. This marks the first annual decline since police records began in 2015. This likely reflects previous improvements in reporting and recording practices, rather than a sharp shift in prevalence.[127]
In 2024, 6.4% of all recorded crimes in London were flagged as DVA related. This was lower than the national average of 8.0%. For women specifically, the rate in London was 7.3%, compared to 9.5% nationally.
In Camden, just 2.9% of all recorded crimes were flagged as DVA in 2024, with a rate of 10.5 per 1,000 female residents, lower than London’s 12.8. DVA crimes comprises 36.0% of all VAWG crimes in Camden, whereas one in two VAWG crimes across London were flagged for DVA.
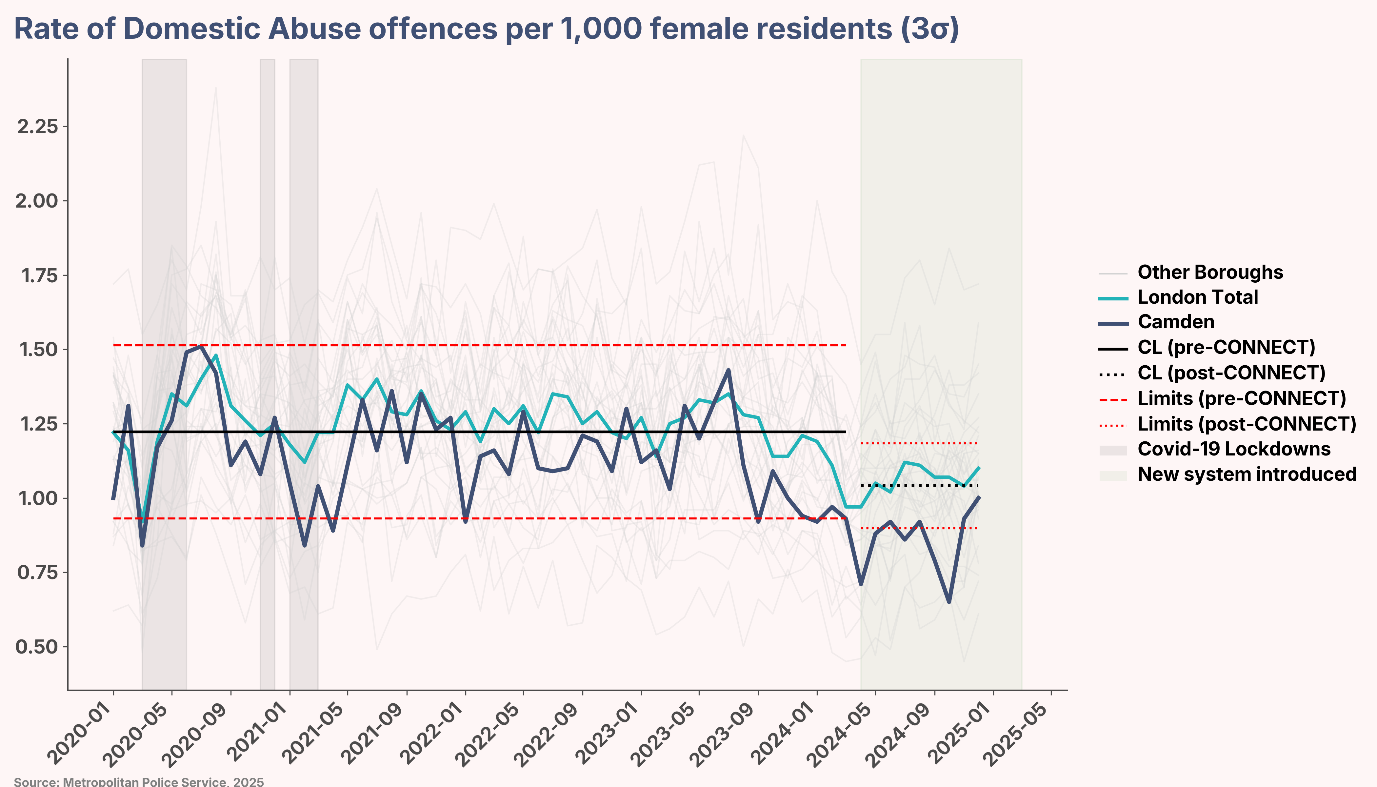
Figure 6: Rate of Domestic Abuse offences per 1,000 female residents in Camden compared with London (2020–2025) [3σ control limits, showing impact of COVID-19 lockdowns and CONNECT system introduction]
Between December 2023 and December 2024, Camden experienced a 6.3% increase in DVA offences. However, this change was not statistically significant. In contrast, the rest of London saw an 8.6% decrease over the same period, and this reduction was statistically significant.
In terms of volume, there are consistently records between 1,500 and 1,600 DVA crimes per year recorded within Camden. While DVA represents a smaller share of total crime in Camden compared to the London average, the rate itself has remained relatively stable over time. Most DVA-flagged offences in Camden fall under violence against the person (14.2%), sexual offences (8.6%), and miscellaneous crimes against society (6.5%). Although these categories mirror the London-wide pattern, the intensity differs: in London, 20.6% of violent offences are flagged as DVA-related, compared to 14.2% in Camden.
Within services offered by Camden, DVA is routinely the top risk identified within CSSW and Early Help (EH) cases, with two in five pathways for girls and young women being for DVA in 2024. This has reduced since 2022, where it was one in four. One in six of all pathways are for DVA between parents. A pathway, or workflow, is used to describe how a case or individual moves through a service, from initial referral, through assessment and ongoing review, to eventual case closure.
Within CSN for 2024, 826 clients were referred in for DVA, across 949 workflows. This accounts for 85.0% of all cases. The predominance of these are for DVA perpetrated by ex-partners, followed by current partner and then within the family (46.4%, 34.2% and 21.1% respectively).
This implies that, although DVA is a significant concern for internal Camden services and constitutes a high proportion of their casework, there may be barriers, such as not wanting to go to the police. According to the MPS, this pattern has been consistently observed over time and is attributed to Camden’s unique local context. While the specific factors weren’t detailed, this could include differences in housing stock, population demographics, service pathways, or community engagement models.
The intersections between VAWG, specifically DVA, and homelessness are under-estimated in the data. The reporting field “main reason for loss of last settled accommodation” is typically used to understand the drivers of homelessness on the case management system locally and nationally. In Camden, internal temporary accommodation and housing data shows that approximately 11% of homelessness applications identify DVA as the main reason for their application (according to data reported internally in August 2025). However, when additional abuse flags on the case management system are reviewed – “domestic abuse as a support need” and “domestic abuse identified through assessment” – the number of DVA-linked housing applications increases by 60%. Work is underway within the Camden Council housing and homelessness prevention teams to improve the data collection and how it is made available to staff to enable them to provide the appropriate support to DVA victim/survivors.
Controlling or coercive behaviour
Controlling or coercive behaviour offences have remained steady in Camden between 2019 and 2024 with a rate of 1.1 per 1,000 female residents. Notably, within the broader category of violence against the person, the proportion of controlling or coercive behaviour cases doubles from 0.8% in 2019 to 1.7%. Comparatively, London-wide data also indicates a steady rise in this offence type, increasing from 0.8 per 1,000 female residents in 2020 to 1.2 per 1,000 by 2023.
Within CSN, from all cases active within 2024, 26.2% of clients said their abuser had tried to control them or were excessively jealous. This is extracted from the risk indicator list, which comprises DASH, alongside extra questions on risk level and changes in risk.[128]
Physical or sexual abuse
Camden has a rate of 12.1 per 1,000 of offences within MPS data marked with the physical or sexual abuse flag, making Camden the 4th highest borough across London. Two in five VAWG offences in Camden are flagged for physical or sexual abuse, comprising 41.0% of VAWG offences, and is statistically higher than the rest of London. The majority of physical or sexual abuse cases are categorised within sexual offences, and violence against the person.
Within Camden services, ASC safeguarding has seen an increase in the proportion of physical or sexual abuse flagged cases within their case load from 6.2% in 2022 to 8.9% in 2024.
From VAWG cases within EH and CSSW, based on cases for girls within 2024, 26.6% had a form of physical or sexual abuse raised.
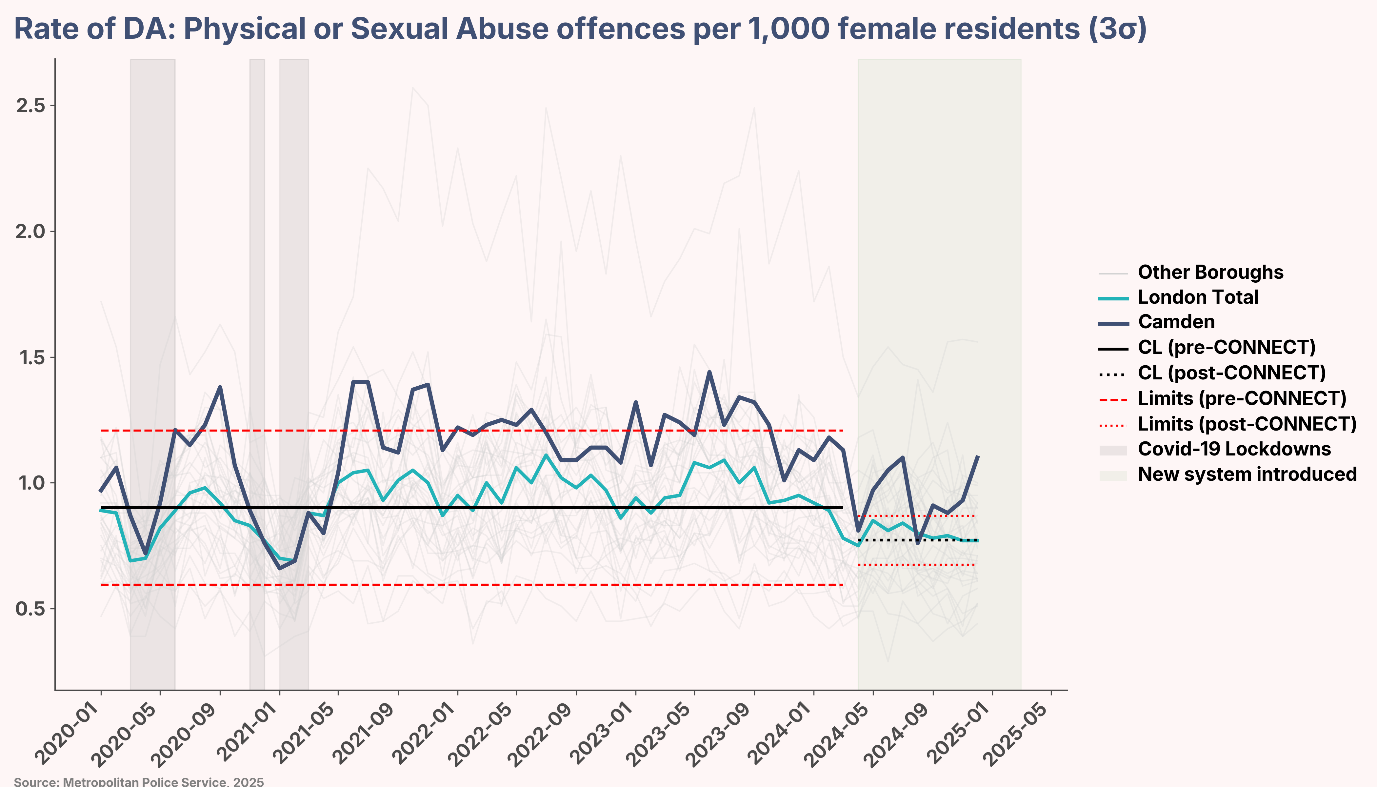
Figure 7: Rate of Physical or Sexual Abuse offences per 1,000 female residents in Camden compared with London, (2020–2025) [3σ control limits, showing impact of COVID-19 lockdowns and CONNECT system introduction]
Violent or threatening behaviour
In 2024, Camden had a rate of 11.9 per 1,000 female residents experience violent or threatening behaviour and is one of the most common VAWG abuse type flagged across VAWG offences; 40.6% of VAWG offences were flagged for this abuse type, and this is statistically higher than the rest of London (by 7.9%).
Despite a continuing steady decline observed since 2020, Camden is still the 5th highest borough in London for these offences. Between December 2023 to December 2024, Camden saw a 29.5% decrease in violent or threatening behaviour, as did the rest of London (21.5%). These changes are statistically significant from each other. Camden’s drop is significantly larger than the rest of London.
Conversely, ASC Safeguarding recorded an increase, with the proportion of cases flagged as involving VAWG-related violent or threatening behaviour rising from 5.64% in 2020 to 7.77% in 2024.
In the CSN risk indicator checklist, among the 611 workflows where a risk form was completed, 38.0% indicated that the individual, or someone they know, had been threatened with being killed by the abuser.
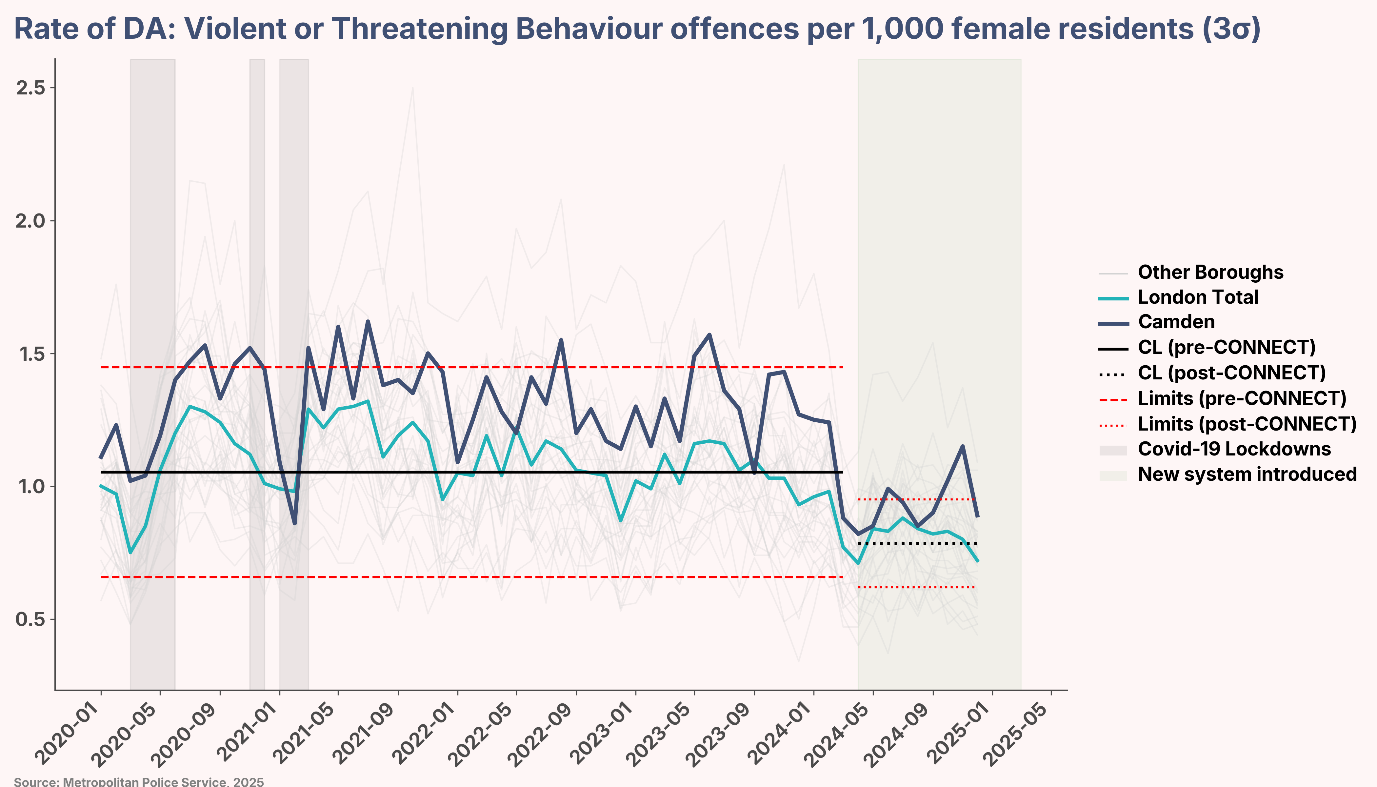
Figure 8: Rate of Violence or Threatening Abuse offences per 1,000 female residents in Camden compared with London (2020–2025) [3σ control limits, showing impact of COVID-19 lockdowns and CONNECT system introduction]
Economic abuse
In the UK, around one in six adults have experienced economic abuse from an intimate partner.[129],[130] Research also shows that 95% of DVA victim/survivors have faced at least one form of economic abuse.[131] However, accurately measuring national prevalence remains challenging, as economic or financial abuse is often grouped under broader categories like non-physical or psychological abuse in officialfig data.[132] For instance, in England and Wales, financial abuse is assessed through a subjective question about whether a partner prevents fair access to household money, an approach that fails to reflect the full complexity of economic abuse.[133]
Within MPS data, there is no clear indication of economic abuse across the categorisation of crimes, meaning a flag could not be created. It is possible that crimes categorised under ‘Fraud and Forgery’, with a DVA flag, could be interpreted as economic abuse. However, there are a minute amount of cases across London that fit these criteria. Fraud and Forgery is also recorded under different crime categories. However, akin to MPS, the numbers are small; Within 2024/25, there were around 50 cases across London.
Within ASC Safeguarding data, the proportion of cases linked to economic abuse reached a high of 14.6% in 2021 and dropped to 11.4% in 2024. There is limited data collected on economic abuse within CSN data and is likely documented within free text case notes.
Psychological, emotional or other abuse
In the year ending March 2023, the CSEW estimated that 3.0% of individuals aged 16 and over experienced partner abuse, with a significant portion involving non-physical forms such as emotional and psychological abuse. Specifically, around two-thirds (65.7%) of partner abuse victim/survivors reported experiencing non-physical abuse, including emotional abuse.[134]
Nationally, emotional abuse is a significant concern. In 2022/23, over 61,000 police-recorded offences related to emotional abuse were documented in England, Wales, and Northern Ireland.[135] Within the MPS data, emotional abuse is implicitly embedded within other VAWG offences, as it is often a natural consequence of such behaviours.
In Camden, specific data on psychological and emotional abuse is limited. Within ASC Safeguarding, the proportion of cases flagged with such abuse declined from 14.5% in 2020 to 6.9% in 2024. Within CSN data, from the 611 risk forms competed, 69.9% reported feeling frightened, 36.3% reported feeling isolated from family and friends, and 67.1% were finding their emotions hard to deal with.
Domestic homicide
Ultimately, DVA can lead to homicide. In the UK since 2009, a woman is killed by a man every three days, with men’s violence against women a leading cause of premature death for women globally.[136], [137]
The characteristics of homicides are striking; 90% of perpetrators were family, partners or known to the victim, 61% were killed by a current of former partner, and 80% of offences were committed in the home of the victim or perpetrator.[138],[139]
Within London, from 2019 to 2024, there have been 969 murders recorded by MPS, making up 97% of homicides. 22% of the victims were female, and 15% were linked to DVA. However, when reviewing cases of murders where the victim was female, from the resulting 151 cases, 53% are linked to DVA.[140] The data on domestic homicide within Camden is not sufficient to draw conclusions from. Moreover, research has highlighted how more women take their own lives following DVA, than are killed.[141] Within CSN for 2024, of the DVA clients that had a case intake form (n=288), 10.8% had either threatened or attempted suicide.
Female genital mutilation or cutting
The prevalence of FGM is difficult to determine as this kind of harm often occurs at a young age and is only disclosed or identified in later life, such as when women attend maternity services. This is evidenced within the MPS data. From 2020 to 2024, only 88 cases within London were recorded, with less than 10 in Camden. [142]
The NHS releases an annual report examining FGM rates.[143] A full table of all metrics is available in Appendix 6. Nationally since 2015, 37,615 women and girls who have undergone FGM have been seen in NHS services (this is only where FGM was relevant to their attendance). Based on these cases, the majority of FGM is undertaken in girls between the ages of 5 and 9 (37.2% of cases with age recorded), and all cases were first seen over aged 18 This can in part be explained by that the majority of cases are dealt with by Midwifery, at 80.7%, followed by Obstetrics, Gynaecology and Paediatrics (33.3%, 6.65 and 2.4% respectively).
From the NHS FGM annual report for 2023/24, Camden displays high engagement and identification of FGM within healthcare settings, when compared to London and England figures. This isn’t to say it has a higher prevalence of FGM, but instead that FGM is being identified better within healthcare settings. It has a high rate of attendance within healthcare settings, at 1.8 per 1000 female residents, and distinct patients of 0.9 per 1,000 female residents, placing it 4th highest among London boroughs. However, this represents only a small proportion of those who have experienced this type of harm.
Proportionally, Camden shows a higher rate of positive responses to advising women on health implications and illegalities of FGM, and lower levels of missing data in key areas. Demographically, its population profile includes a higher proportion of women born in Eastern Africa, and more cases of FGM being reported at occurring under age 5.
Despite this, it is also important to highlight that whilst the figures are above other areas, it is likely that still likely represents an underreporting of women and girls who have experienced this type of harm. As highlighted by the NHS report, poor data quality on FGM makes it challenging to draw clear conclusions in this area. The NHS characterises the FGM type, age when FGM was undertaken and country where FGM was undertaken as key information; for those seen by NHS services in England, 28% of women and girls have none of these key data items recorded, with only 22% having all three. To fully estimate the rates of FGM, the City of London University in conjunction with Equality Now and ONS released national and local authority estimates in 2017.[144] However, the estimates were calculated based on 2011 census data, there has been no re-estimation since, despite the 2021 census being available.
Within Camden services, FGM can be raised as a safeguarding risk in CSSW. Within 2024, there were under 7 cases of FGM reported. Since 2022 to April 2025, there have been less than 7 cases in EH assessments, and between February 2023 to current day, there have been under 7 cases in CSSW assessments.
Forced marriage
Within the MPS data, the recorded instances of forced marriage are low. Since 2020 to 2024, 514 instances have been reported across London, with just 82 cases reported in 2024. Forced marriage is also rarely recorded by Camden services, with fewer than 7 cases recorded in 2024. In 2023, the national Forced Marriage Unit received 802 contacts for both forced marriage and FGM nationally and offered advice or support for 283 cases related to possible forced marriage or FGM instances.[145]
Sexual exploitation
Camden has a sexual exploitation rate of 0.35 per 1,000 female residents in 2024. This is 6.05% higher than the rest of London, albeit this is not a statistically significant difference. The absolute figure is 41, with the predominance of these within the Violence Against the Person category. Since 2020, Camden’s rate has remained stable, ranging from 0.27 in 2020 to 0.46 in 2022, and now dropping to 0.35.
Sexual violence
Sexual violence is a prevalent VAWG abuse category within Camden when standardised by population; within 2024, the rate of 5.2 per 1,000 female residents placed it 2nd highest across all London Boroughs. When compared to the rest of London, Camden’s 2024 rate is statistically significantly higher, with a rate of 4 per 1,000, Camden’s rate sits 40.6% higher.
Sexual violence makes up 18.0% of VAWG offences within Camden in 2024, which is 28.0% higher than the rest of London. This difference is statistically significant, implying that it is unlikely to be due to random variation, and may reflect specific local dynamics
Between 2019 and 2022, Camden saw a gradual rise in the rate of sexual violence, increasing from 4.0 in 2019 to a peak of 6.0 offences per 1,000 female residents in 2022. However, since 2023, this rate dropped sharply to 5.2 in 2024. Between December 2023 to December 2024, sexual violence saw a 27.0% increase from a monthly rate of 0.5 per 1,000 females to 0.4. However, this change is not statistically significant.
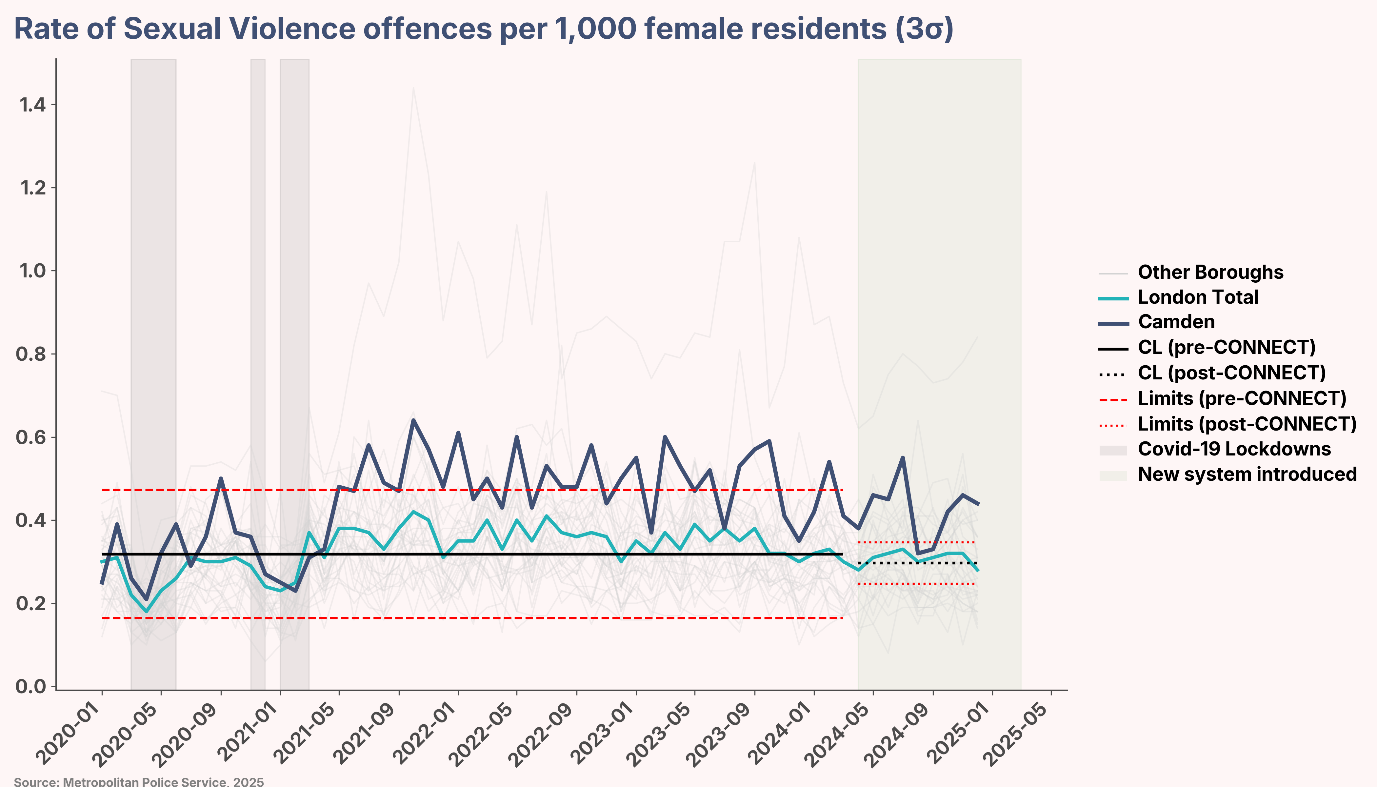
Figure 9: Rate of Sexual Violence offences per 1,000 female residents in Camden compared with London (2020–2025) [3σ control limits, showing impact of COVID-19 lockdowns and CONNECT system introduction].
So-called ‘honour’-based violence
Between 2019 and 2024, annual case numbers remained extremely low in Camden, with only 7 to 14 offences recorded in any single year. The proportion of honour-based violence within overall crime types consistently stayed under 0.05%.
Stalking and harassment
According to the CSEW, approximately 3.1% of individuals aged 16 and over experienced stalking in the year ending December 2024.[146] This equates to an estimated 1.5 million victims nationwide. Women are disproportionately affected, with 4% reporting stalking incidents compared to 2.3% of men during the same period. Younger individuals, particularly those aged 16 to 19, are also more likely to be victims, with 8.8% reporting stalking experiences.
Domestic stalking remains a significant concern, with 28% of victims reporting being stalked by a partner or ex-partner, and 9% by a family member. Despite improvements in police recording practices, the number of police-recorded stalking offences remains well below the CSEW estimates, highlighting potential underreporting and the sensitive nature of the crime. The introduction of Stalking Protection Orders in 2019 marked a step forward in providing early intervention, but challenges persist in effectively addressing stalking cases.[147]
In Camden in 2024, the rate of stalking and harassment was 11.8 per 1,000 female residents, placing it 5th highest across all London boroughs. When distinguishing between stalking and harassment, 58.8% of recorded offences in 2024 were of harassment, whilst the remaining were stalking. Within London, the proportion is similar, with 52.5% in harassment, and 47.5% in stalking.
Across all VAWG offences reported in Camden in 2024, 40.1% were for stalking and harassment. When disseminating between the two categories, harassment makes up a higher proportion of VAWG offences than the rest of London, with 23.6% being flagged for harassment within Camden.
Stalking and harassment VAWG offences have shown fluctuations between 2019 and 2024. The number of such crimes ranged from a low of 1,391 in 2024 to a peak of 1,808 in 2021. The Stalking and harassment rate per 1,000 female residents reached its highest point in 2021 at 16.2, before gradually declining to 11.8 by 2024. Between December 2023 to December 2024, stalking and harassment had a 28.6% decrease, and London had 21.3%. These changes are statistically significant, and the difference between the two are also significant.
Within Camden, stalking and harassment is primarily recorded under public order offences and violence against the person categories. For example, in 2024, stalking and harassment crimes made up 26.6% of public order offences, and 11.2% of violence against the person offences.
Within CSN in 2024, from the 611 risk indicator forms completed, 37.0% of victims reported that their abuser constantly texted, contacted followed, stalked or harassed them.
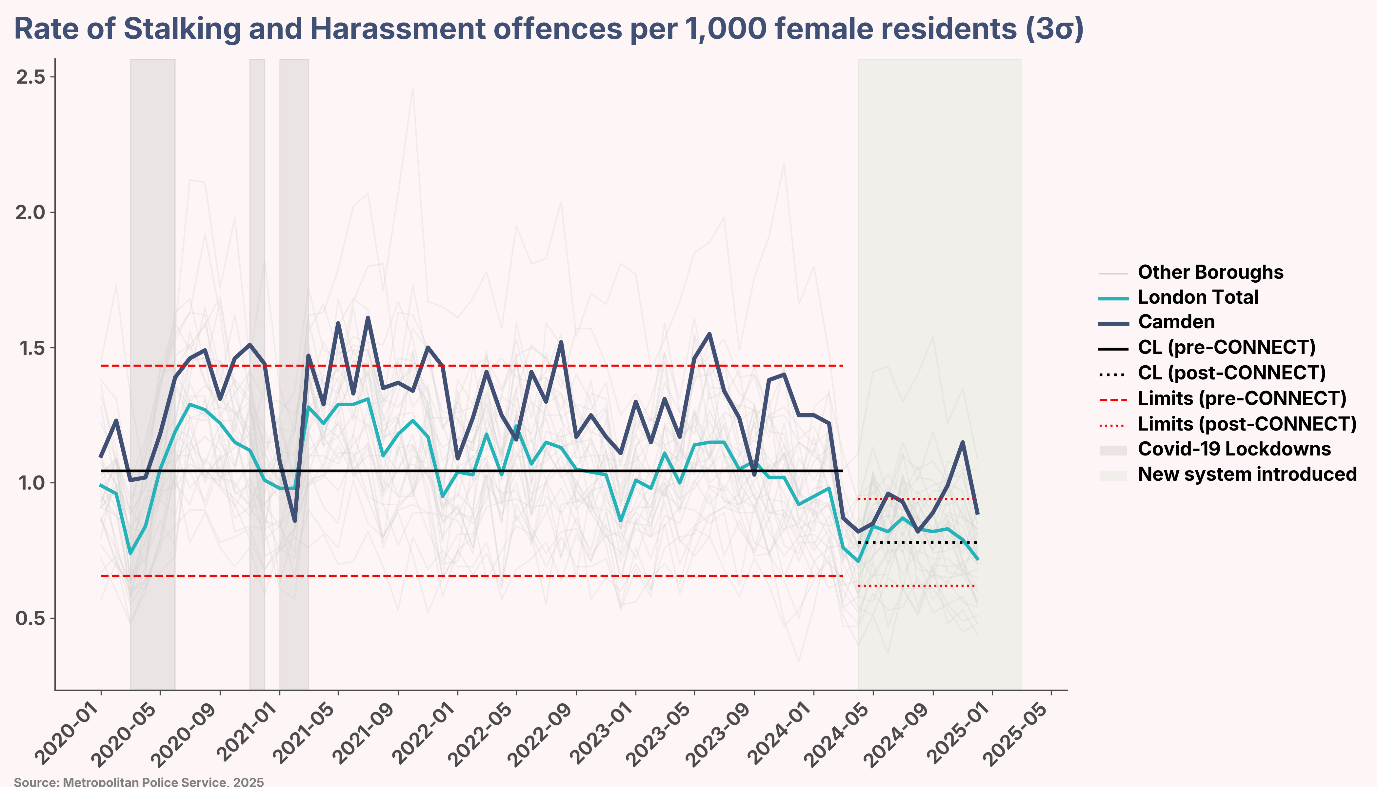
Figure 10: Rate of Stalking and Harassment offences per 1,000 female residents in Camden compared with London, (2020–2025) [3σ control limits, showing impact of COVID-19 lockdowns and CONNECT system introduction].
Geographical variation
When examining the location of reported offences, it’s important to provide context: this data reflects where incidents were located, and reporting behaviour can vary by area. For example, due to greater police presence or stronger community relationships with services, people in some locations may be more likely to report offences.
Overall, VAWG crimes being reported are centralised within the ward of Camden Town, a direct reflection of higher levels of night-time economy activity, public transport hubs, and large visitor numbers in the area; In 2024, there were 249 recorded VAWG crimes, with a rate of 73.4 per 1,000 female residents. This ranks it 7th highest ward across all of London. This is likely due to an inflated rate of crimes occurring for non-Camden residents compared to the local female population used to calculate the rate, and a direct reflection of Camden Town’s night time economy and tourist attraction.
When looking within Camden Town, the predominance of VAWG offences are flagged with physical or sexual abuse, violent or threatening behaviour and stalking and harassment, with the predominance being harassment instead of stalking (24.8%, 17.6% and 17.2% respectively).
Analysis of spatial patterns shows that wards in the south of the borough form statistically significant clusters according to the Local Moran’s I test. This means that these areas, and their neighbouring wards, have consistently higher levels of VAWG compared to other parts of the borough, indicating a clear concentration of cases in the south of the borough.
Compared to the rest of London, several Camden wards stand out for high rates of VAWG offences. Kilburn ranks 9th for DVA (29.21 per 1,000 female residents), 5th for stalking and harassment overall (29.06), with a particularly high 4th place for stalking alone (13.77), and 5th for violent or threatening behaviour (29.21). Regent’s Park is 8th for sexual exploitation (1.93) and also 8th for controlling or coercive behaviour (3.26). Camden Town ranks 7th for sexual violence, 9th for stalking and harassment overall (26.24), including 5th for harassment specifically (18.87), 5th for physical or sexual abuse (37.15), and 9th for violent or threatening behaviour (26.83).
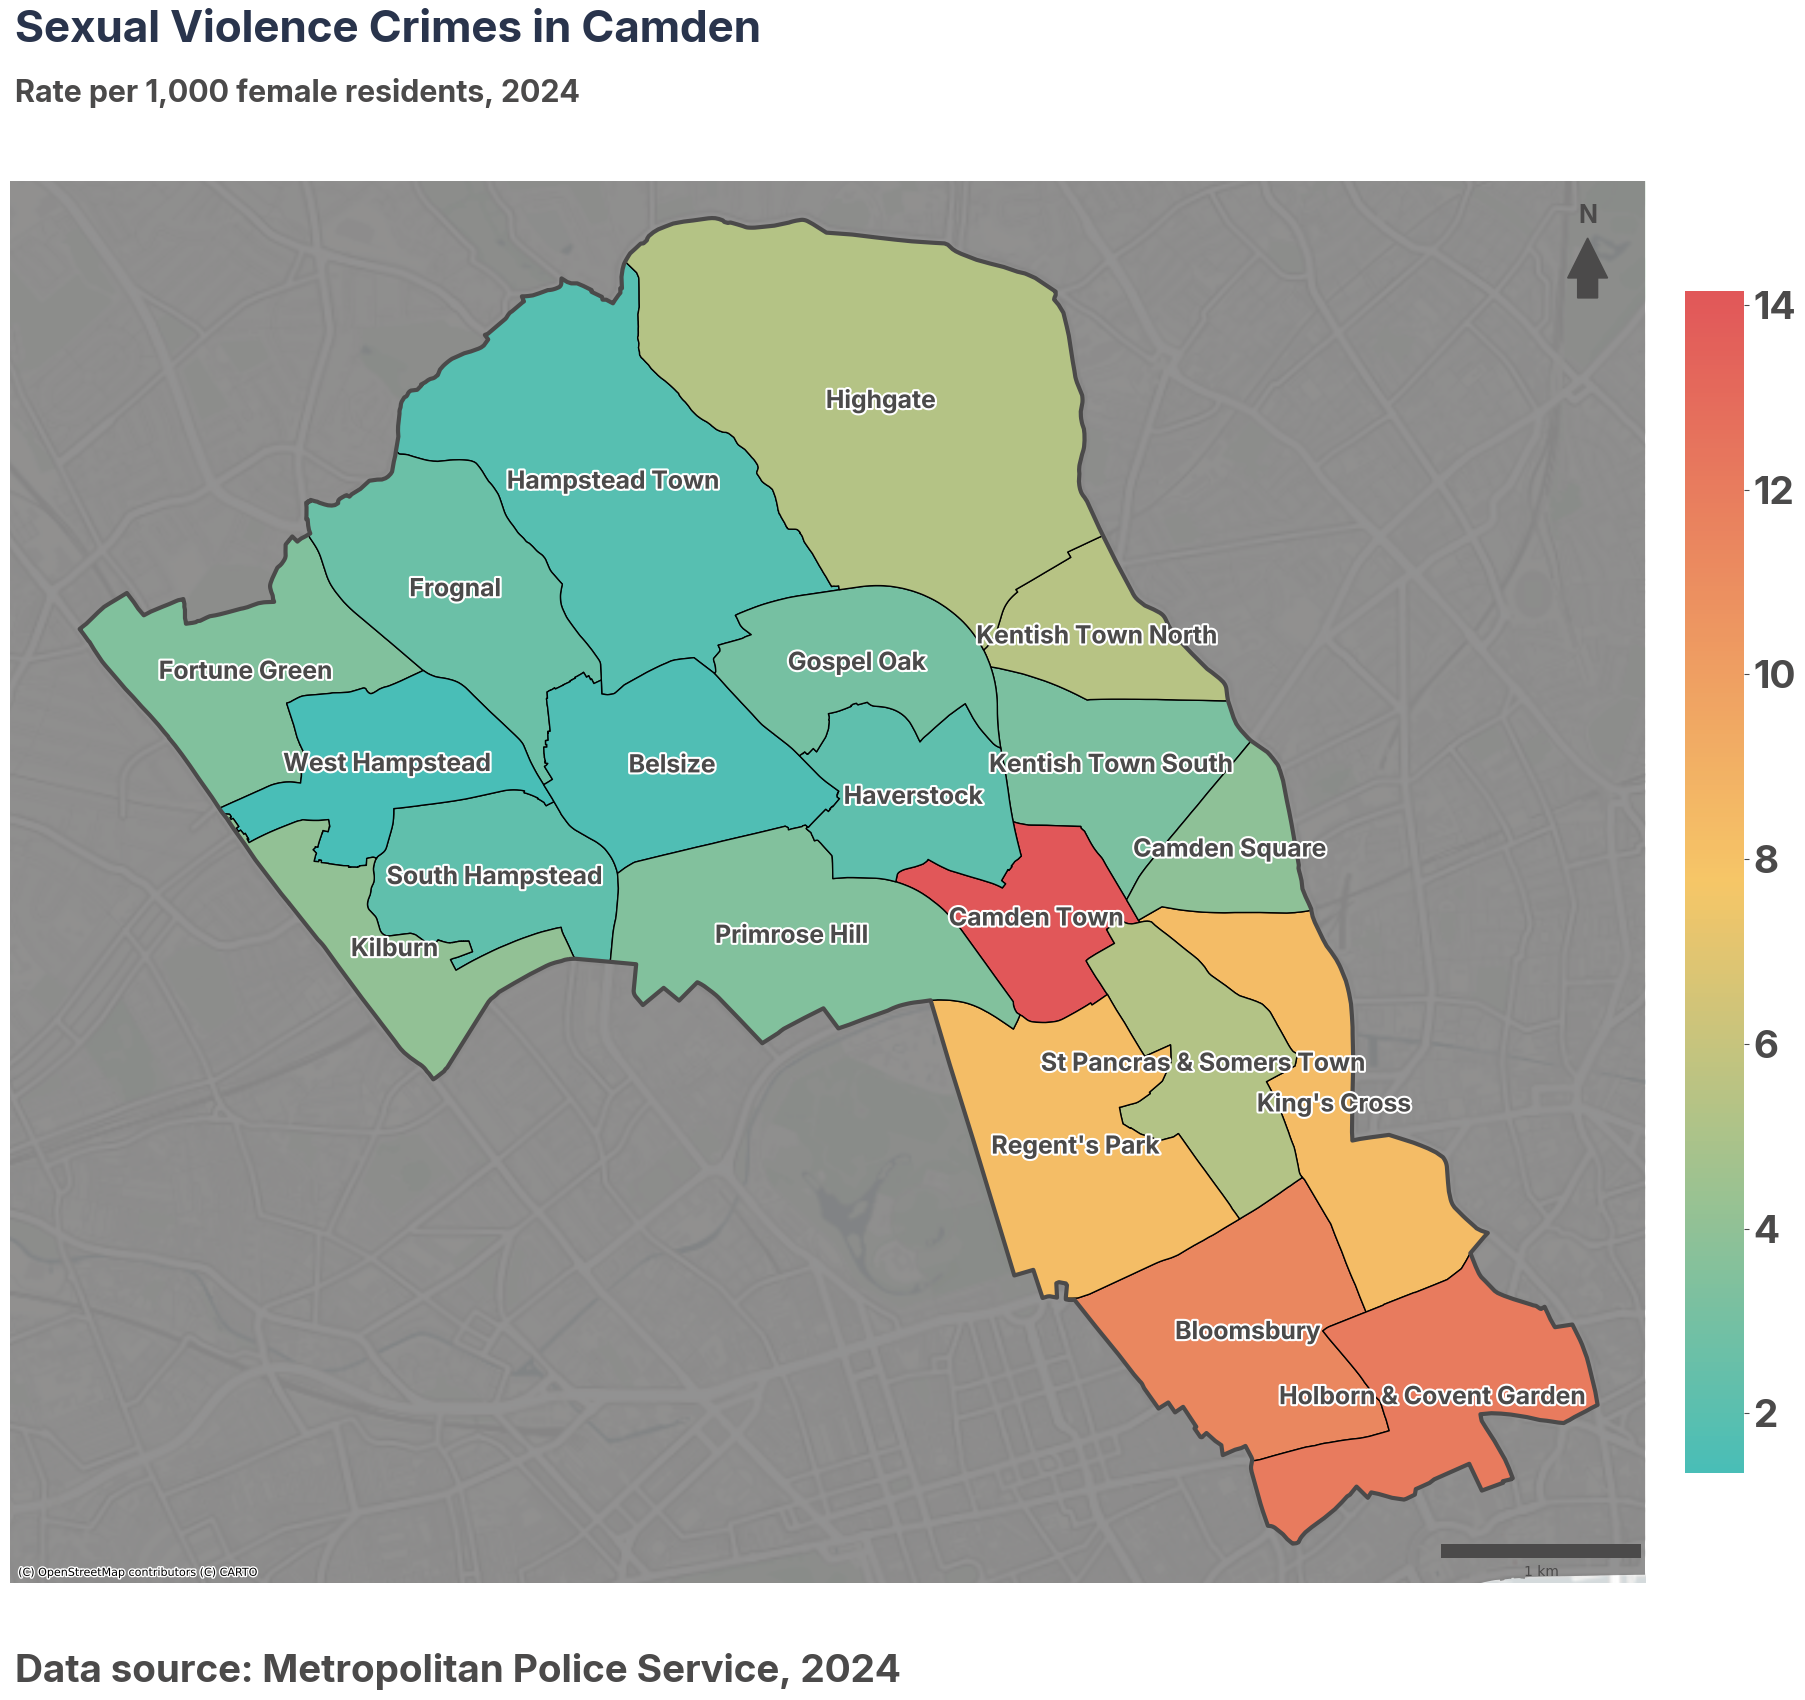
Figure 11: Map showing distribution of VAWG offences across Camden wards (2024)
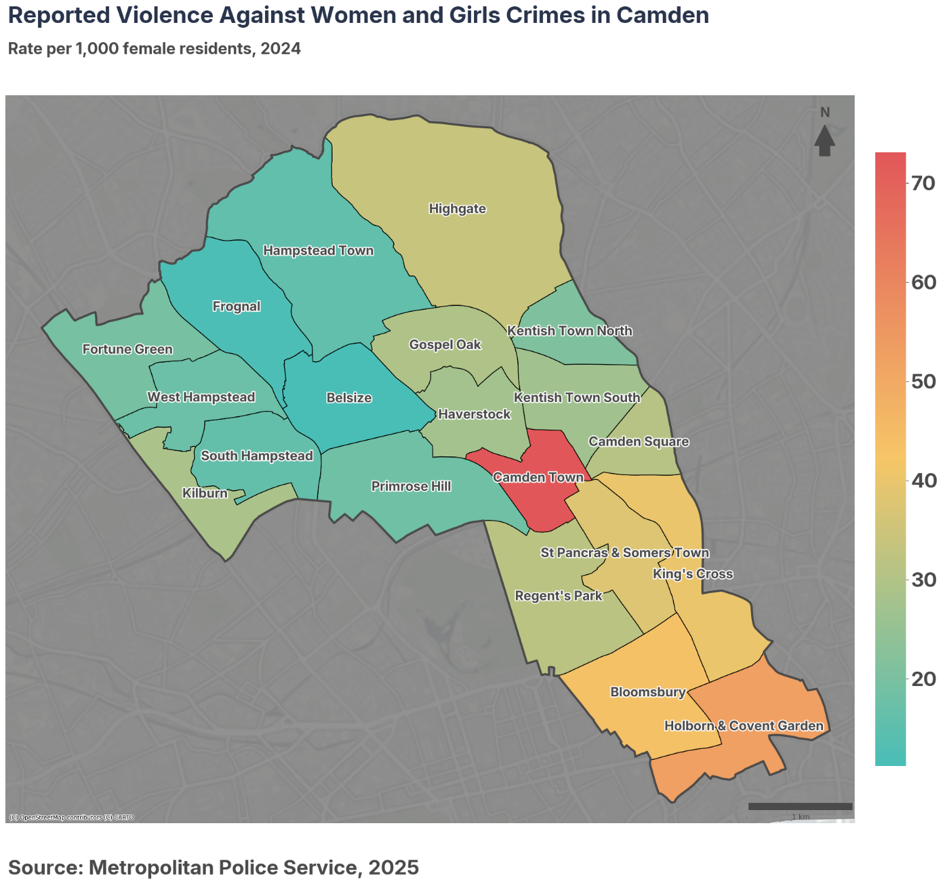
Figure 12: Maps showing distribution of DVA and sexual violence offences across Camden wards (2024)
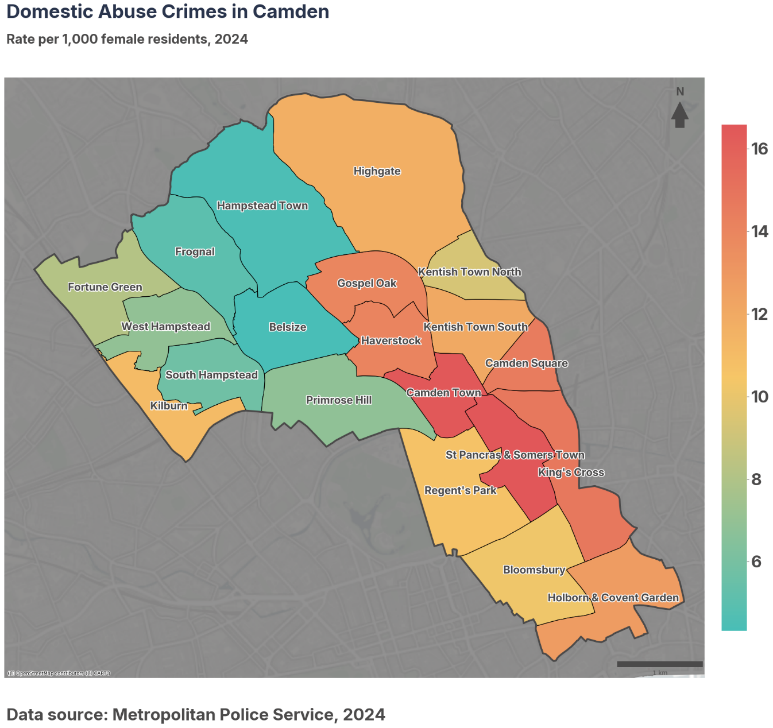
Figure 13: Maps showing distribution of stalking and harassment offences across Camden wards (2024)
Deprivation
When examining the relationship between VAWG rate per 1,000 female residents and proportion of households in at least one dimension of deprivation, across all London wards, a moderate positive correlation was observed. However, when the analysis was restricted to Camden wards only, the correlation strength more than doubled to a strong positive association (r = 0.66, p = 0.002). This suggests that the relationship between these variables is considerably stronger in Camden than the wider London context, indicating that local factors may be amplifying the link within the borough. This model does not adjust for any other factors such as demographic composition, socioeconomic status, housing characteristics, or service provision, which could plausibly account for part of the observed association. Consequently, while the findings highlight an important borough-specific pattern, they should be interpreted with caution and considered exploratory until further multivariable analyses are conducted.
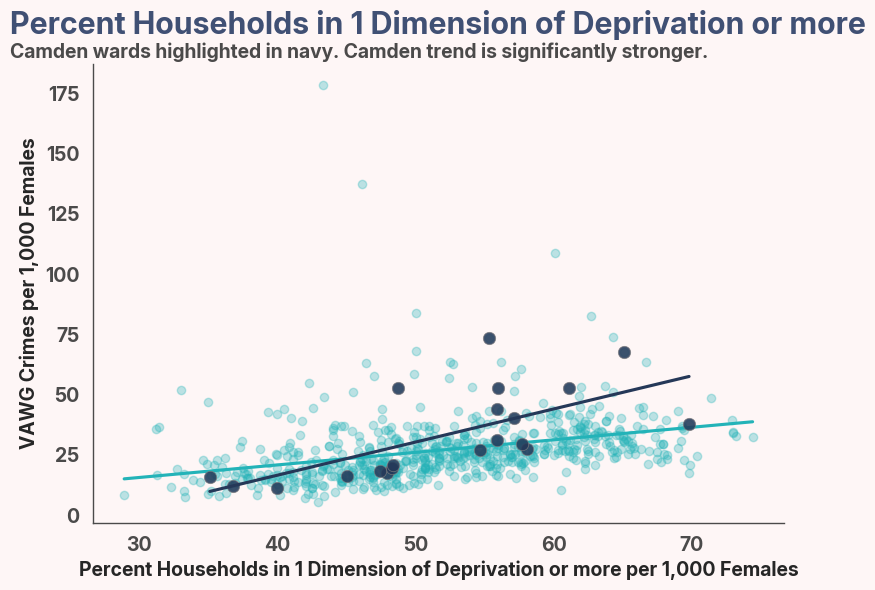
Figure 14: Correlation between VAWG rates and households in one dimension of deprivation
Victim/Survivor and suspect profiles
The following section will examine the protected characteristics (as in the Equality Act 2010 with the addition of care experience in line with Camden Council’s policy) of victim/survivors and suspects, aiming to uncover the risks for each group.
MPS has provided the protected characteristic details of victim/survivors of VAWG offences within Camden from 2019 to 2024. For clarity, this section will focus only on victim/survivor profiles from 2024. Further data has also been collected from Victim Support, from the MOPAC.
Other sources of victim/survivor and suspect profiles have been sourced from CSN, Housing Points panel, and ASC Safeguarding. For child victim/survivors, demographic details have been sourced from CSSW and EH.
There are limitations due completeness and consistency; Within the MPS, suspect characteristics are, of course, only available where there is a suspect. Due to limited data availability, it was not possible to synchronise the full details of offences to the different victim/survivor and suspect profiles. This means that the following analysis is presented by crime grouping, instead of by specific VAWG flag. Despite this, the cohort is still based on those who have experienced VAWG offences. In addition, data collected by internal services does not always include demographic details, either because these questions haven’t been asked or because records haven’t been updated.
Victim/Survivor demographics
The CSEW estimates that at least one in twelve women are a victim/survivors of a VAWG offence every year.[148] The latest CSEW, published in 2025, found that around one in eight women were victim/survivors of sexual assault, DVA or stalking in the last year.
Protected characteristics
Whilst the Equality Act 2010 does not include care experience as a protected characteristic, Camden Council recognised it as a protected characteristic in 2024. Therefore, care experience is included within this section of the needs assessment.
Age
In 2024, MPS data for Camden shows that the majority of victim/survivors of VAWG-related crimes are aged between 18 and 34 years old, accounting for around half of all recorded victims. This highlights the disproportionate impact on younger adults. Representation declines sharply after the mid-30s, though there is a slight increase among those aged 60 and over.
There are distinct age patterns between different offence types; younger adults (18 to 29 years old) are more prevalent in sexual offences, public order offences, and violence against the person. Middle-aged adults (30 to 44) tend to be the primary victims of burglary, robbery, and arson. Older adults (60+) have higher representation in arson and theft.
When looking at victim/survivors details within CSN, there is a more balanced distribution from ages 18 to 44 years old, each five-year age banding representing around 12% to 15% of all referrals. However, middle-aged and adolescent individuals are under-represented.
Despite being a prevalent age group among victim/survivors, those aged 18 to 24 are 1.95 times less likely to be progressed onwards from the referral stage compared to all other age groups combined (odds ratio = 0.51, p < 0.01). In 2024, for all referrals for 18 to 24 year olds, 23.6% were provided with safety advice, 23.0% were unable to be contacted, and 22.3% the client declined services, This may help explain, at least in part, why cases are less likely to progress.
There is a great underrepresentation within 60+ age group. One reason for the underrepresentation of victim/survivors aged 60 and over is issues around mental capacity. Where a victim/survivors lacks capacity or has additional care and support needs, CSN is unable to carry out an accurate risk assessment, and the available safety options are often unsuitable. In these situations, ASC takes the lead, with CSN providing consultation to the professionals involved. This is particularly common in cases where either the victim/survivors or the person causing harm has dementia. A second factor is the nature of adult child-to-parent abuse, where parents are often reluctant to seek support for themselves. These cases frequently involve alleged perpetrators with substance misuse issues, mental health concerns, or homelessness, and parents usually prioritise getting help for their child rather than for their own safety.

Figure 15: Age profile of CSN referrals in 2024 compared with the age-banded female population of Camden
As a direct reflection of this, within ASC Safeguarding of VAWG linked offences, those that draw on care aged 60 and over make up 50% of all referrals within 2024.
For applications to the housing register, shows that DVA points are most prominent among applicants aged 25 to 44, with the highest proportion in the 40 to 44 group where over 41% of applicants are DVA cases. Applicants aged 25–29 also stand out, with more than a third affected. While the largest number of overall applicants falls within the 30 to 34 age group, the share of DVA cases is lower than in the 25 to 29 and 40 to 44 ranges. From age 45 onwards, the proportion of DVA applicants declines to around one quarter, and in the 60+ category DVA is rare, making up just 3.4% of applications despite relatively high overall demand. This pattern suggests that DVA-related housing need is concentrated among younger and middle-aged adults, while older applicants are far less likely to cite DVA as the reason for seeking housing support.
Externally, Victim Support also records ages; within the fiscal year 2024/25, 25 to 44 years make up over half the population supported. Middle ages - 45 to 64 years old - are less represented, making up 23.27%, and over 65s are 3.31%.
Comparing the demographic profiles of victim/survivor cohorts with that of the female resident population in Camden helps to identify whether certain groups are overrepresented. This does not assume that the distribution of victim/survivors should mirror the general population exactly, as different groups may face varying levels of risk or barriers to reporting. However, identifying disproportionality can help highlight were further investigation, prevention, or tailored support may be needed. When looking at age of victim/survivors within MPS data, there is a statistically significant overrepresentation of ages 15-17, 25-29, 30-34, 35-39, and 40-44. There is a smaller but still statistically significant overrepresentation of ages 40-49.
The routes to referral within CSN inherently change based on age group; Children and Young Person Services skew towards middle adulthood, whilst DVA services are more likely to refer young adults (18 to 24), and health referrals are more common for those aged 50 to 54, MARAC referrals to CSN are more common for 15 to 17 year olds, Police referrals are more likely for 25 to 29 year olds, and self-referrals those aged 60+ are less likely.
Looking at age and abuse type recorded, and comparing to those across all age categories, victim/survivors aged 60+ are strongly over-represented in family-related DVA (4.56 more likely) but are very unlikely to appear in ex-partner DVA (5.07 times less likely), suggesting older cases often involve adult children, siblings, or elder abuse rather than romantic partners.
Those aged 18 to 24 years old are also over-represented in family DVA (1.93 times more likely) yet under-represented in intimate partner violence (1.57 times less likely), indicating that younger adults’ DVA cases may more often involve family members.
Survivors aged 30 to 34 are slightly more likely to be referred for ex-partner DVA (1.50 times more likely) and less likely to have uncompleted referrals (2.08 times less likely), pointing to stronger follow-through and partner-based case profiles in this age range.
In contrast, middle-aged adults (35 to 44 yrs old) are under-represented in family DVA (2.20 to 3.17 times less likely), suggesting different case contexts or classification patterns in these ages. Overall, the findings suggest a U-shaped relationship for family DVA, with the youngest and oldest adults most represented, and a shift from family-based to partner-based DVA across the age spectrum.

Figure 16: Age profile of MPS VAWG Victims in 2024 compared with the age-banded female population of Camden
Disability
In 2024, 7.5% of clients referred to CSN were marked as having a disability. As disability status is often not recorded (CSN has a non-recording rate of 56.8%), it is difficult to say whether this is an accurate representation of disability within the referred population. The 2021 ONS census showed that 16.3% of Camden’s female population identified as having a disability, indicating that residents with a disability may be underrepresented within CSN. There is no statistically significant difference between the prevalence of disability within CSN referrals when compared to the Camden female population.
Within CSN workflows, those with a recorded disability are more likely to be referred due to DVA within an intimate partner relationship than those without a recorded disability (odds ratio is 1.77 times more likely, p < 0.05).
When comparing conversion likelihood between disabled and non-disabled referrals, the odds ratio was 1.183 with a 95% confidence interval of 0.721 to 1.941 and a Fisher’s Exact Test p-value of 0.525. This means there is no statistically significant difference in conversion rates by disability status within CSN referrals.

Figure 17: Age profile of ASC Safeguarding referrals in 2024 compared with the age-banded female population of Camden
In ASC Safeguarding, 268 women identified as having experienced VAWG in 2024 had a learning disability recorded as their primary support need, representing 4.72% of all females receiving ASC Safeguarding support.
In comparison, there are 188 women with a learning disability recorded within safeguarding cases not related to VAWG. However, the odds ratio indicates no significant difference in the prevalence of learning disability between women flagged for VAWG and those in safeguarding for other reasons.
Within MARAC in 2024, disabled victims from Camden were a higher proportion than that of UK Wide, and MPS.
Gender Reassignment
Within the CSN referrals, 92.38% identified as women and 0.21% as non-binary. When asked if their gender was different from assigned at birth, 98.92% said it was the same, reducing to 81.79% for all workflows (irrespective of if they had the question completed).
For comparison, from the 2021 census, 91.18% of female respondents said they had the same gender identity as sex registered at birth. The data from CSN is too small to extract statistical significance.
It should be noted that the provided MPS data used does not differentiate between gender, gender reassignment, and sex.
Marriage and civil partnership
Women who are separated or divorced are at heightened risk of VAWG, experiencing post-separation abuse from their ex-partner.[149]
For the year ending March 2024, the CSEW found that people aged 16 and over who were separated or divorced were significantly more likely to have experienced DVA in the past year than those who were married or in a civil partnership, cohabiting, single, or widowed.[150]
In CSN data in 2024, 10.2% of those referred to the service were married. However, 63.1% did not have marital status recorded. When recording abuse type, CSN differentiates between current intimate partner abuse and ex-partner. In 2024, 20.9% of referrals were for intimate partner abuse (n=441), whilst 15.2% were for ex-partner (n=322). The trends within CSN workflows are unsurprising; those that are married are more likely to referred for intimate partner violence, whilst divorced clients are more likely to be referred for DVA within the family.
Pregnancy and maternity
Pregnancy is a known risk factor for escalating DVA, with perpetrators often weaponising children and child contact to abuse victim/survivors.[151] This includes forms of coercive control, and using the family court system, with direct harassment or physical abuse at child contact times.
Of all CSN referrals, 7% involved individuals who were pregnant at the time of referral, while 33.7% involved cases where children were directly affected.
Within CSN workflows, when children are involved, the outcome for a referral being a DVA client is more likely if children are involved, not involved and pregnant, and when children are involved, there is 2.84 times more likely to have a safety plan. When children are involved, there are 2.94 times more likely to be referred for ex-partner violence, and as are those that are pregnant, they are 2.80 more likely to be referred for current partner DVA. Conversely, there the risks are assessed as being standard risk CSN is most likely to provide information and advice rather than open a DVA case.
It is also worth noting that that majority of FGM recorded by the NHS occur when the victim/survivor attends midwifery services or are pregnant.
Ethnicity
For year ending March 2024, differences between any DVA estimates across different ethnic groups from the CSEW were found not to be significant.
White victim/survivors make up the greatest proportion when compared to other ethnicities in all services with 43.4% in MPS data and 39.1% in CSN referrals. When looking at applications made by women who were flagged for DVA to the housing register in 2024, 30.4% had ‘Other’ listed as their ethnicity, followed by White at 14.4% and Black as 9.2%. However, 27.2% had no ethnicity listed.
When comparing the distribution of ethnicities, within CSN referrals, to the wider Camden female population, individuals from Black, Black British, Caribbean or African background are significantly overrepresented. In contrast, White individuals are significantly underrepresented. All other groups have no statistically significant differences.

Figure 18: Ethnicity profile of MPS AWG Victim/survivors in 2024 compared with the age-banded female population of Camden
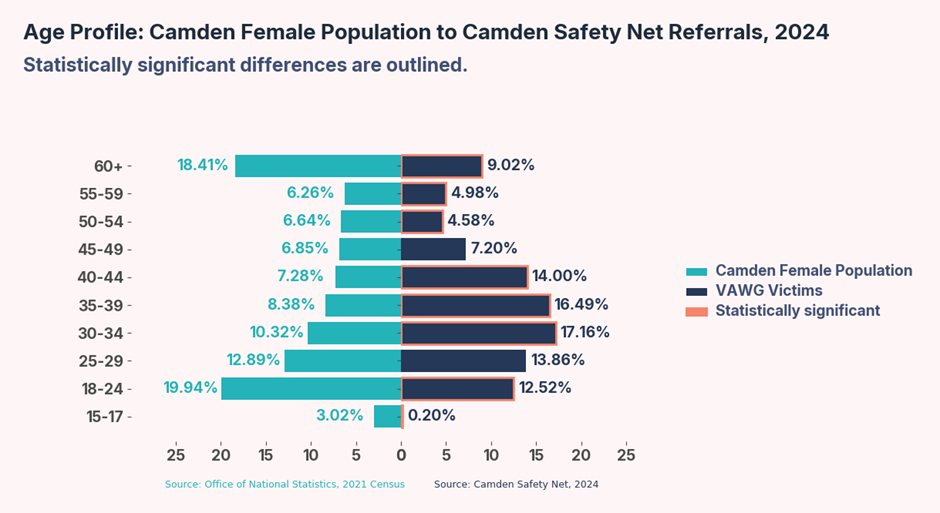
Figure 19: Ethnicity profile of CSN referrals in 2024 compared with the age-banded female population of Camden
Within the MPS VAWG victim/survivors, Black, Black British, Black Welsh, Caribbean, or African individuals once again displayed a statistically significant overrepresentation. Other ethnic groups and Asian, Asian British, or Asian Welsh individuals were also significantly underrepresented. White individuals showed a slight but statistically significant overrepresentation.
Within CSN workflows, Clients with ‘Other Ethnic Backgrounds’ recorded are 2.73 time more likely to self-refer when compared to all other ethnicities, 1.99 times more likely to be recorded as a DVA client, and 1.89 times more likely to be converted onwards into a case, but 3.66 times less likely to have the outcome “unable to make safe contact” and 1.89 times less likely to appear in the “Not Converted” group.
Asian or Asian British clients are 2.11 times more likely to be referred to another service but 1.50 times less likely to have an intimate ex-partner DVA reason. The former is likely due to there being some local and well established by and for services for Asian or British Asian women, which offers crucial resources to immigration support and financial support. Black or Black British clients are 1.62 times more likely to be referred for family DVA.
Camden’s MARAC cases consistently involve a higher proportion of Black, Asian and racially minoritised victim/survivors compared with the UK average, though broadly comparable to the Metropolitan Police. By 2024, 37.3% of cases involved such groups in Camden, compared with 15.6% nationally. Camden’s local Black, Asian and racially minoritised population (around 64.6% in 2024) aligns with this overrepresentation.
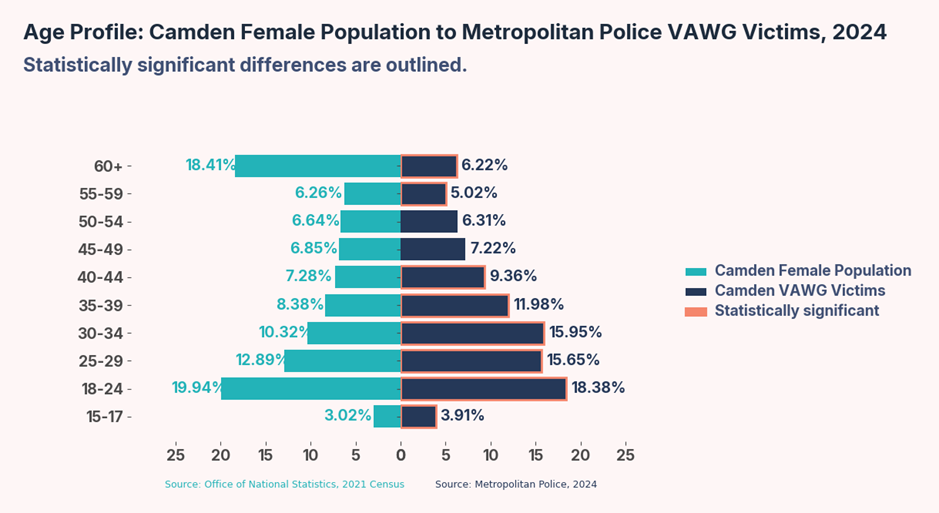
Figure 20: Line graph of MARAC Black, Asian and racial minorities cases since 2019
Religion or belief
Within MPS data, religion was not provided. Within CSN, non-reporting also hampers assessment; in 2024, 41.9% of cases had no religion recorded.
When comparing to the Camden female population, there is statistically significant under-representation of Christian, Jewish, Hindu and Buddhist, although this is a direct impact from the poor data quality. There is over-representation, bar that of the not stated. There are some statistically significant differences in CSN workflows by religious belief, but they do not indicate any meaningful or interpretable trends.
Whilst the Equality Act 2010 includes philosophical beliefs within the protected characteristic of religion or belief, the data available for this needs assessment did not include non-religious beliefs.
Sexual orientation
Within CSN, 67.2% of individuals referred into the service are recorded as heterosexual, whilst 30.2% have no sexuality recorded and 8.70% would prefer not to say. Just 2.7% identify as LGBTQ+. Comparing to the Camden female population, bisexual and heterosexual or straight individuals were significantly underrepresented. In contrast, gay or lesbian individuals or those in other sexual orientation were proportionally represented.
Less than 8% of applicants to the housing register made by women in 2024 and had DVA flagged were from LGBTQ+. However, this is around 2 percentage points more than those not flagged for DVA.
MARAC cases within Camden show that in 2024, Camden’s LGBTQ+ case proportion was roughly equal to the Most Similar Force Group and slightly below the Metropolitan Police average.
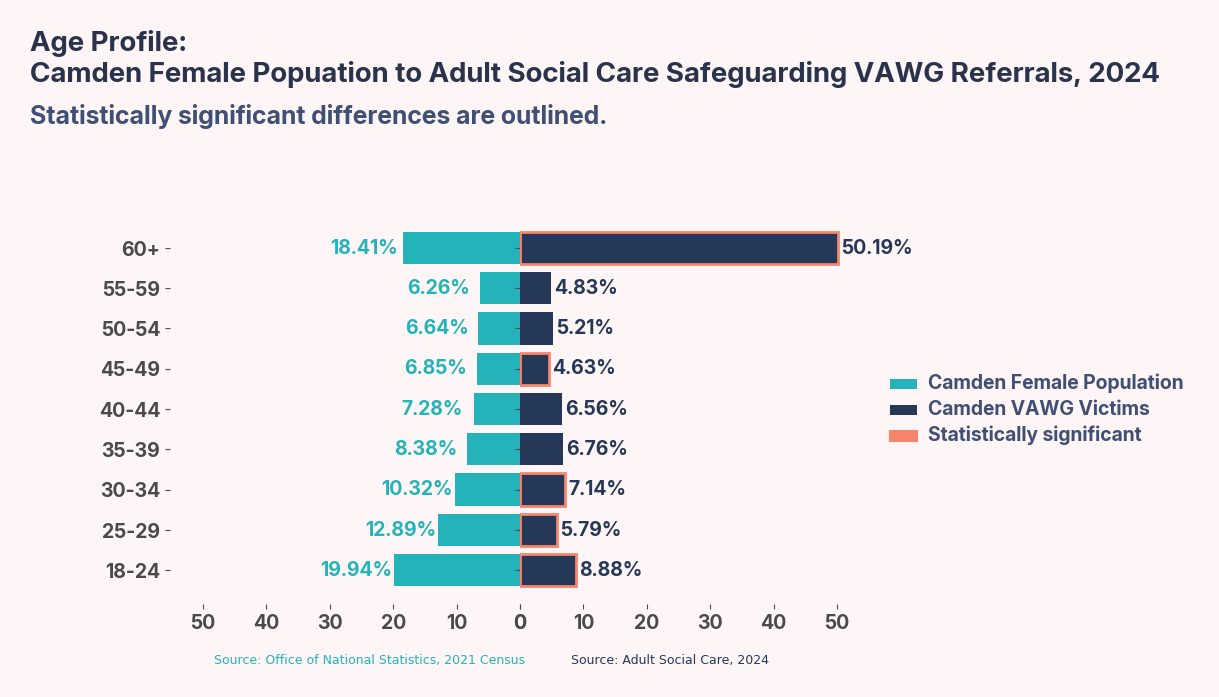
Figure 21: Line graph of proportion of MARAC LGBTQ+ Cases since 2019
Care experienced
In CSSW and EH assessments, 4.3% of girls and young women with VAWG-related cases were identified as looked after children, with Camden acting as the corporate parent. This compares to a lower proportion of 2.5% among girls and young women without VAWG. This doesn’t consider other authorities who act as a corporate parent. When widening to all children with VAWG, we see a similar proportion of Children Looked After.
At risk populations
The following outlines populations that are at increased risk of experiencing VAWG, though this list is not exhaustive and may not include all at-risk groups.
Homelessness and temporary accommodation
According to the Housing Act 1996, anyone experiencing or at risk of DVA is considered legally homeless. More details on the prevalence of VAWG in homelessness applications to Camden is provided in the internal services section.
Within CSN, from the 270 DVA clients, 68.9% reported they were no longer living with the Accused Perpetrator (APTR), or had separated. 45.6% said the APTR sill had access to the client’s address. One in four wanted to flee home.
Children and young people
In MARAC data, children in the households of MARAC cases has been increasing from 2019, where just 280 were recorded, to 395 in 2024, representing a 41.1% increase. As a proportion, 44.5% of cases had children in the household in 2024, in line with the London total at 47.6% and lower than the national value which is 52.2%.
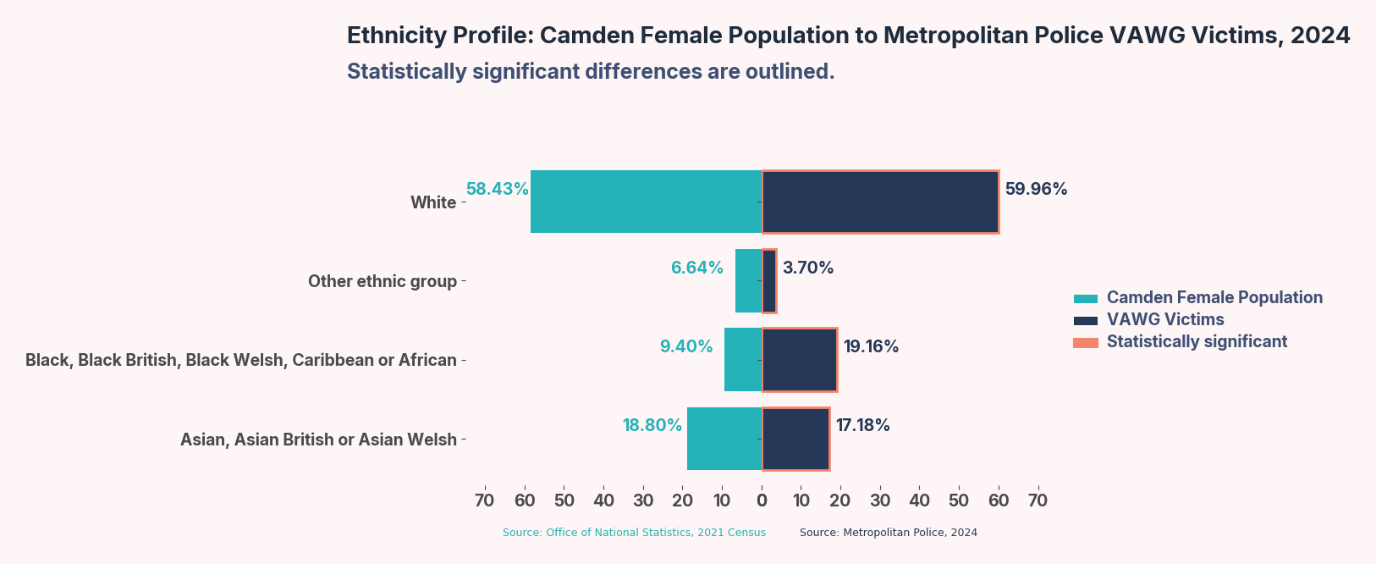
Figure 22: Age profile of non-VAWG to VAWG cases in 2024 from CSSW and EH
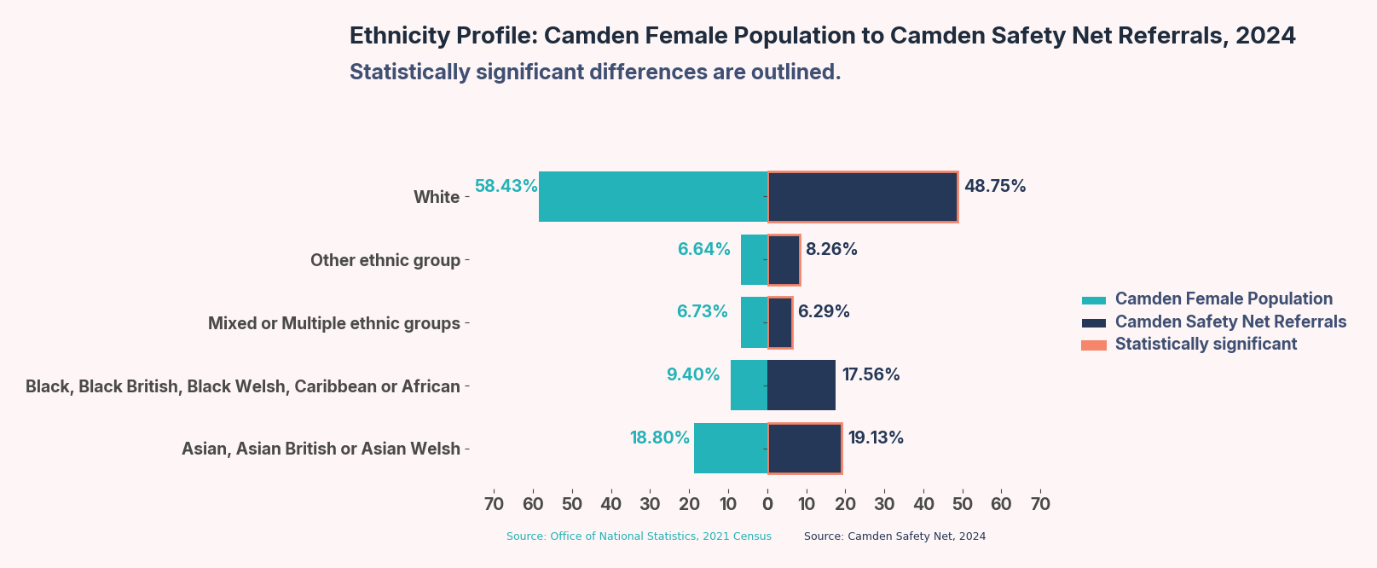
Figure 23: Line-graph showing percentage of MARAC cases with children in the household since 2019
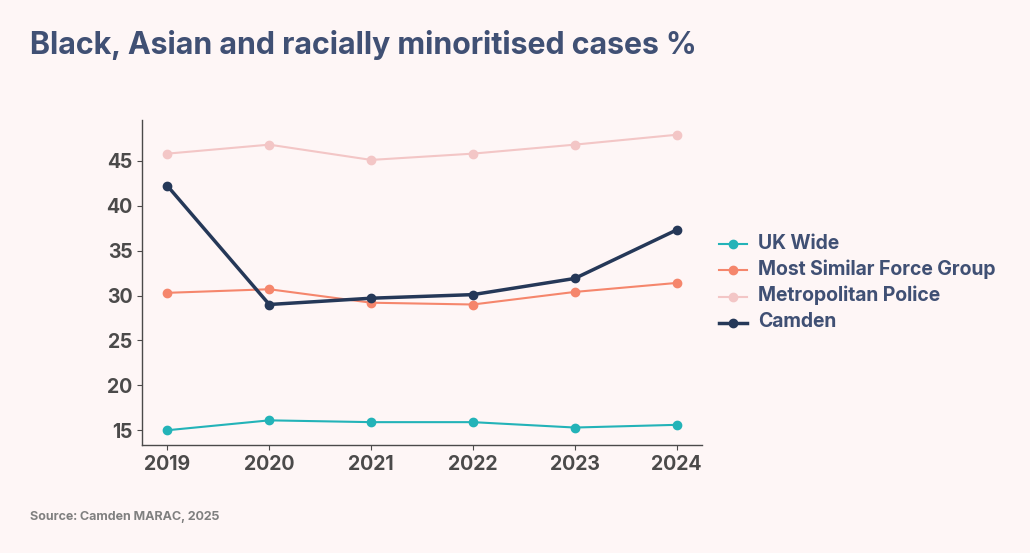
Figure 24: Line graph of percentage of MARAC cases with victims aged 16 to 17 since 2019
Girls and young women
When looking at the demographics of girls and young women referred into Children’s services with a VAWG risk in either EH or CSSW front door or assessments; age is equally distributed between five-year age bands between 0 to 19 years, with roughly 25% in each, with the majority of victim/survivors being in the 15 to 19 year old age bracket (28.4%). When comparing to the entire female CSSW and EH population, there is an under-representation of ages 5 to 9, with an over representation of ages 15 to 19.
The predominance of girls and young women referred in for VAWG are white, at 30.1%, followed by Asian or Asian British and then Mixed (22.2%, 16.7%). When comparing to the rest of the EH and CSSW population, there is an overrepresentation of Asian or Asian British CYP, and an underrepresentation of Black or Black British. These results are statistically significant, whilst the remaining have a proportional reflection.
The unknown rate for religion is high, at 53.8% for VAWG girls and young women. This is then followed by Muslim, at 25.2% and then Christian at 15.9%. These are all proportional to the entire CSSW and EH female population.
Within VAWG cases, one in ten are flagged as disabled. This is proportional to that of the rest of the CSSW and EH girl and young person population. However, there is a high non-recording rate, at 89.1%. 5.4% are flagged as having a physical disability, and 6.8% have a learning disability. These figures are both proportional to the rest of the entire EH and CSSW population. The other protected characteristics are not applicable to this group.
All children
When widening VAWG workflows to include all children, from cases flagged for a VAWG offence, 48.1% were flagged as female, and 49.8% as male. Age is predominantly concentrated within the ages 15 to 19, with 30.6% of VAWG cases in this category. This tapers off for younger ages, as seen in Figure 26. Looking at ethnic groups, the majority are White, at 29.5%, followed by Asian or Asian British, and Black or Black British. However, when compared to non-VAWG CYP, there is an under representation of Black or black British, and an overrepresentation of Asian or Asian British and Mixed ethnicities. Religion once again has high rates of non-disclosure. Around 13.6% are flagged as disabled.
The analysis of VAWG-related workflows shows a clear difference in service engagement across different pathways. For workflows flagged for VAWG, there were more likely to have a child in need visit, strategy discussion or a child in need plan developed when compared to all other workflows in CSSW and EH.
Within the CSN risk assessment, elements about children’s involvement in cases are asked. From the 611 forms completed in 2024, 7.5% of cases said children had been, whilst 24.2% said they hadn’t. From the 1,115 workflows in 2024, 35.0% had children.
Employment status
The CSEW showed that a lower percentage of those who were employed (4.6%) experienced DVA in the last year compared with those who had a long-term or temporary illness (12.9%), students (9.9%) and those who were looking after their family and home (8.4%).
However, those who were retired experienced a lower proportion of DVA in the last year compared with those who were employed. It is likely that differences seen by occupation type are also linked to age.[152]
Within CSN data, employment status can be collected at the intake form or contact form. Within 2024, from the 1,115 workflows with a contact form completed, 796 answered questions around employment status. The highest proportion of respondents reported being unemployed, which was 29.0% for those who answered, and 20.7% of all eligible forms. This was followed by ‘Don’t Know’, at 42.0% or respondents, or 30.0% of all forms. Only 12.8% reported being in full time employment, 5.3% in part time, and self-employed was just 1.1%. When going onto become a client, in the client intake form, unemployment is accounted at 35.7% of respondents whilst full-time employment increases to 20.6%.
For applications to the housing register from women flagged for DVA in 2024, 25.2% were not working because of long term sickness, 21.6% had other, and 21.6% were registered as unemployed. 18.0% were employed (n=252), compared to 23.4% employed for those applying not with DVA flagged.
Mental health
For cases that were active in 2024 within CSN (n=1,402), 15.9% had diagnosed mental health, and a further 3.9% had mental health conditions which were undiagnosed. However, there are high rates of non-recording for this too. When focusing on cases with a MH status, 41.8% are DVA cases, and 57.6% are repeat workflows. When comparing to those without mental health, unknown or not recorded, the re-referral rate is lower at 37.0%, and DVA workflows are 26.6% (total n=914). This equates to those with diagnosed mental health diagnosed being 2.6 times more likely to be a repeat referral and are 2.2 times more likely to become a DVA client.
From the 612 risk indicator checklists completed in 2024, 32.2% felt depressed, 36.3% feel they have a low mood and 5.4% were suicidal.
Drugs and alcohol use
Within CSN in 2024, from the 1,115 workflows with a contact form, around 6.9% had use of either drugs or alcohol or both recorded. However, once again, the non-recording rate is high, at 52.1%, reducing the robustness of any conclusions in difference of outcome. When looking at disparities in outcomes for those with drugs and alcohol use, those with drug use recorded are more likely to be unable to make safe contact with, more likely to be a repeat referral (2.31 times for alcohol use, and 3.7 times for drugs and alcohol).
The MPS are developing a Drug Harm and Vulnerability Assessment which uses the ONS Crime Severity Score to attribute offending and victimisation scores for drugs users across London. A high number of women and girls feature in the victim cohort, where levels of violence, DVA and sexual offences feature disproportionately. Once the assessment is formally launched it will enable partners to work together to support those identified. Changes in scored harm, at individual and local levels, will then be reviewed at regular intervals to demonstrate the impact of this joint working.
Suspect characteristics
The MPS data team have highlighted that interpreting suspect data is challenging, as suspects are not the same as confirmed accused individuals. In many cases, multiple suspects may be linked to a single crime until one is confirmed as the accused, or there may be no suspects at all due to a lack of evidence. Nationally, it is estimated that one in twenty adults in England and Wales will be a perpetrator of VAWG.[153]
Perpetrator characteristics in MPS data
In 2024, 2,636 suspects were identified as suspects of VAWG offences in Camden. While the dataset did not include unique crime reference numbers, a proxy crime ID was created by combining details such as date, location, and offence type. This method estimated approximately 2,305 distinct crimes, with around 275 involving multiple suspects. Assuming all perpetrators are unique individuals, and filtering to just male suspects, this equates to a rate of 18.89 per 1,000 male residents in Camden - though this also assumes all suspects are Camden residents.
Overall, suspects of VAWG offences were predominantly comprised by young to middle aged males, with a concentration in the 18 to 34 year old bracket. Male suspects made up over 72% of suspects, whilst females accounted for just under 20%. It should be noted that MPS data does not distinguish between sex, gender reassignment, and gender.
Black and White North European suspects appear the most frequently, although there is high non-disclosure or recording, around 18%.
When looking within crime types, sexual offences skew towards younger adult male suspects, with the age bracket 18 to 34 yrs old accounting for over 37% of this group. There is a relatively high unknown or not recorded demographic characteristic in age and ethnicity.
Violence against the person is the most demographically diverse group, with a spread of suspects across all age bands. However, those aged 18 to 39 still dominate, representing over 45% of suspects. Male suspects account for 70%, with a small but notable 21% female share. Over 76% of suspects were known to the victim, highlighting that violence in these cases is frequently interpersonal. There is also a relatively more complete ethnic and self-defined ethnicity profile in this group compared to others, although “Not Recorded” still accounts for a majority.
Public order offences stand out for having the highest proportion of suspects not known to the victim (57%). The age distribution is broadly spread but peaks between 35 to 44. Gender is more balanced here than other subgroups, with 28% female suspects, one of the highest female representations across offence types. The ethnic appearance data shows the widest spread too, indicating that public order offences draw from a more varied demographic pool. The remaining crime categories had minute suspects identified, all amounting to counts under 60.
Perpetrator characteristics in Camden Safety Net
CSN also collects data on alleged perpetrators (APTR). In 2024, 922 forms included responses to questions related to APTRs, accounting for 19.8% of all completed forms. However, completion of these fields is not mandatory, so the absence of APTR data does not imply a lack of attention to this area. In many cases, relevant information is instead captured within case notes.
When looking at these forms, 68.1% didn’t live together, with 24.6% living together. 18.1% of APTRs had been arrested, yet it’s unclear if it was for the referral offence or for historic offences. 43.1% had access to the client’s address. 8.7% had a recorded mental health issue that impact their ability to function, and a further 9.1% had substance use disorder. 35.4% were an intimate ex-partner, whilst 15.6% were an intimate partner, and 10.9% were a family member. 4.7% considered themselves disabled. In 9.1% of cases there were multiple APTRs.
Service demand and referral pathways
Internal services
The London Borough of Camden provides a range of services that directly or implicitly support those affected by VAWG offences, with abuse types often overlapping with their cohort. While the Chapter 4 on the local offering outlines the scope and performance of each service, this chapter focuses on understanding demand, how referrals are made and what workflows look like for survivors.
Camden Safety Net
In 2024, there were 1,115 referrals recorded, of which 1,047 were for women. These were across 883 unique people. This amounts to a referral rate of 7.50 per 1,000 female residents. 48.3% were new referrals, whilst 41.8% were repeats. The most common referrer category was children and young person services, self-referral and followed by adult safeguarding (22.9%, 19.7%, 16.1%). 36.1% of all referrals were due to DVA from an ex or current partner.
For those that had a contact form completed (n=1,115), the different abuse types recorded are shown in Table 3. Overall, 85.1% have a form of DVA recorded.
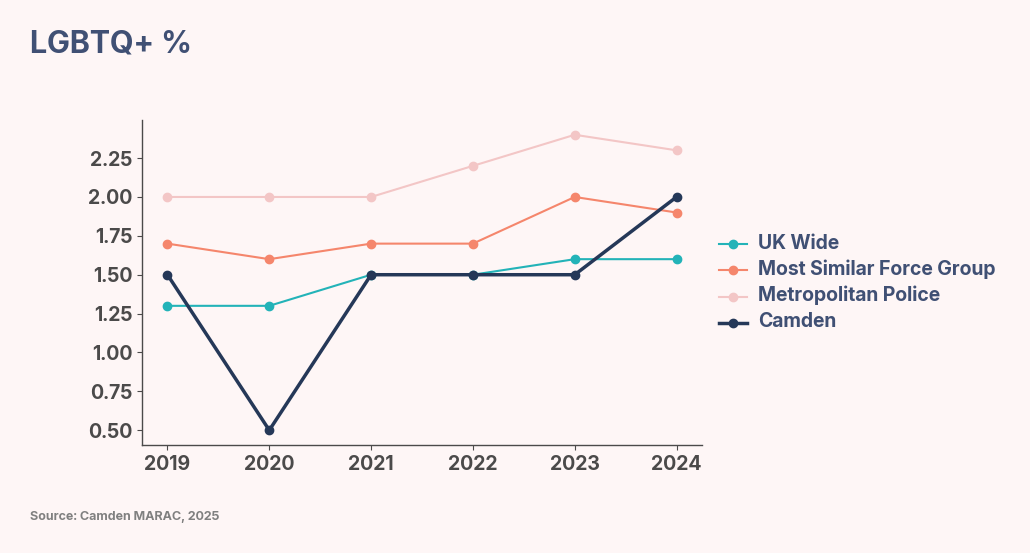
Figure 25: Proportion of abuse types for CSN cases in 2024
| Abuse Type | Count of Abuse Type | Percentage of Abuse Type |
|---|---|---|
| DVA | 949 | 85.1 |
| DVA - Intimate ex-partner | 441 | 39.6 |
| DVA - Intimate partner violence | 325 | 29.2 |
| DVA - Family (incl. child v parent, brother v sister) | 201 | 18.0 |
| DVA – Honour Based Violence | Redacted | |
| DVA - Forced Marriage | Redacted | |
| Non-DVA | 40 | 3.6 |
| Non-DVA - Sexual Exploitation | Redacted | |
| Non-DVA - Stalking & Harassment | 13 | 1.2 |
| Non-DVA - Rape / Sexual assault | 27 | 2.4 |
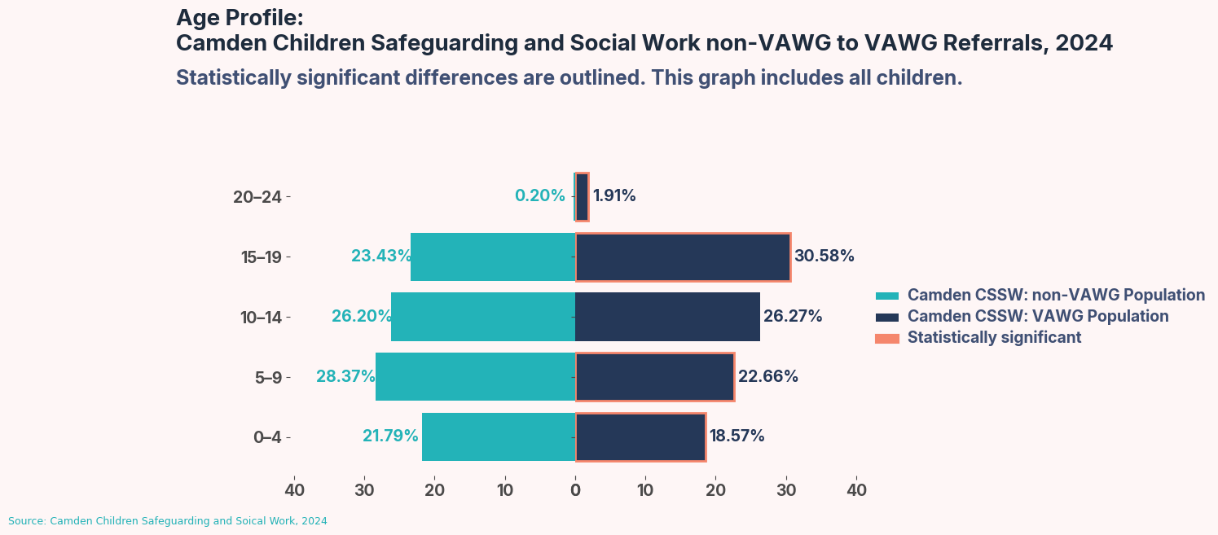
Figure 26: Sankey chart showing referral source to referral outcome of CSN clients in 2024
From referrals within the year, 22.9% went on to become cases. For those that had a risk assessment, this increases to 52.6%. For these cases (n=462), the most common outcome from a referral was becoming a DVA client, meaning they are continued as a client. This occurred 237 times and accounted for 51.3% of all outcomes. This was followed by safety advice being provided, with 109 occurrences, representing 23.6% of the total. The third most common outcome was referred to another service, recorded 41 times and making up 8.9% of all cases.
Across all referrals, irrespective of whether a risk assessment was completed, the most common outcome was classification as a DVA client, recorded 238 times. This was followed by clients declining services (215), the provision of safety advice and information (215), and cases where safe contact could not be established (202).
For those that go onto case work (n=237), interventions can also occur. Within 2024, the three most common interventions recorded in response to cases were referrals to MARAC, which accounted for 70 cases or 12.6% of the total. This was closely followed by referrals to counselling services, representing 68 cases (12.6%). The third most frequent intervention was clients moving to a safe address within the borough, with 61 instances recorded, making up 5.9% of all interventions during the period.
Looking back from 2019, referrals have dropped by 51.8%. The key driver of this change is the introduction of GDPR, and an impact on working practices, such as colocation. CSN Independent Domestic Violence Advisers (IDVAs) were co-located with police, receiving relevant cases daily. Since GDPR, the police no longer share cases in the same way, instead only completing referrals for cases with a safeguarding concern. Moreover, cases are more oftens sent to other services, such as Victim Support or other organisations within the Voluntary and Charity Sector (VCS). Despite this change, the service continues to operate at capacity.
Multi-Agency Risk Assessment Conference (MARAC)
Camden’s prevalence of MARAC cases, measures by cases per 10,000 adult female population, have remained fairly stable, with minute changes since 2019 to 2024. In 2019, there were 42 cases per 10,000, then peaking at 56 in 2023 and 2023 before falling slightly to 48 in 2024.
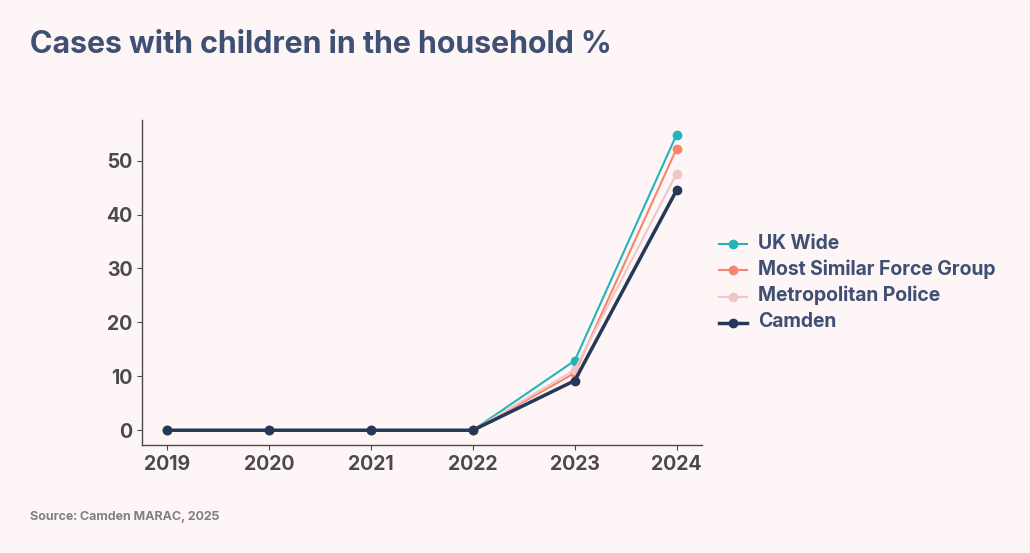
Figure 27: Line graph showing MARAC cases per 10,000 adult female residents since 2019
Camden is above the UK wide average, which increased from 40 to 48 cases per 10,000 over the same time frame, and is broadly in line with the Metropolitan Police Area. The repeat rate of cases within Camden has also shown variation, from 36% in 2019 to 29.9% in 2024.
This is consistently higher than the national average, but similar to patterns within London.
Referrals from police have declined, falling to 23.4% in 2024 from 38.6% in 2019. In contrast, non-police referrals have risen, reaching 76.6% in 2024. This exceeds both national and MPS values. Referrals from probation, VCS, and secondary care also show some increases. Primary care and Multi-Agency Safeguarding Hub (MASH) referrals remain low.
Looking at outcomes and support provided, IDVAs involvement for cases within Camden has been higher than national and similar force group benchmarks, although this fell from 45.4% in 2019 to around 28.9% in 2024. The proportion of cases involving children in the household shows a stark rise in 2024 (44.5%), aligning more with the levels seen in comparator areas.
Children’s Safeguarding and Social Work (CSSW) and Early Help
Within CSSW, VAWG risks can be raised at either the MASH Contact and Referral stage, which is completed at the point of referral, and then depending on circumstances and a threshold decision, a CSSW assessment or Early Help (EH) assessment is completed. Within these assessments VAWG risks can also be raised.
To extract relevant workflows, cases were filtered based on the following criteria: assessments and forms completed in 2024, flagged with any of the risks listed in Appendix 6g: i) where the subject of the assessment was identified as a girl (as a population of focus for VAWG) and ii) for all children, to include boys. This broader scope acknowledges that all children in families experiencing violence at home are affected and helps us consider the overall scale of support children may need, particularly around mental health and preventative interventions. It also reflects the dynamics of abuse in which mothers are frequently victims in their own right. Cases marked as an Early Help Brief Closure were excluded from the analysis.
Before reviewing the data, it’s important to note the different ways cases are counted. One method counts each Workflow ID, which may include multiple children. The other counts individual children by using unique person–workflow ID combinations, this could include repeat contact for the CYP, which will be discussed later, though this doesn’t account for repeat contacts with the same child. Both methods are used in the analysis and clearly indicated where applicable.
Within 2024, 41.2% of girls and young women who had who had either a MASH Contact and Referral stage form, CSSW assessment or EH assessment were identified as having a VAWG abuse type flagged as an assessment factor. This corresponds to 1,207 individual CYP, across 963 workflows. Based on unique counts of workflow IDs combined with People IDs, one in three cases for girls and young women are VAWG related (34.7%). Looking across all workflows, girls and young women with VAWG offences make up one in five workflows (20.6%). Where boys are included, one in three children were identified as having a VAWG abuse type flagged as an assessment factor (31.2%).
Looking within the assessment stages, 31.2% of girls and young women referred into MASH have a VAWG risk identified. Overall, 28.7% of all children referred into MASH have VAWG risk identified. Following MASH, the majority of VAWG cases progress to a CSSW Assessment, where 65.2% of cases for girls involved VAWG, and 60.1% of all cases were linked to a VAWG abuse type (including boys). Early Help accounts for a smaller proportion, with VAWG identified in 19.5% of cases for girls and young women, and a similar amount when boys are included.
Looking for the abuse types identified within the VAWG cases for girls and young women, at referral stage, the predominance of VAWG referrals had DVA identified, occurring within 56.3% of VAWG workflows, and 17.3% of all referrals for girls. When expanding to include boys, 57.6% of all workflows had DVA included, followed by abuse or neglect, the sexual exploitation.
Within CSSW assessment, 62.4% have DVA identified with 62.7% for all children, comprising 40.6% of all workflows for girls, and making it the highest abuse type identified. Finally, in EH assessments, 60.0% of VAWG workflows have DVA, and reducing to 12.2% for all workflows for girls. Details on outcomes of steps are detailed in the earlier section of this chapter about at risk populations.
Within 2024, the rereferral rate of cases with a VAWG risk flagged, for all children, was 7.2%. In contrast, for non-VAWG cases this was 21.9%. This difference is statistically significant, suggesting there is a systemic difference in addressing VAWG cases that is reducing rereferrals.
Beyond the scope of children who have directly interacted with Camden Council services for a VAWG risk, a Camden Council report from early 2024 examined common households between year 5 and year 6 pupils attending Camden schools, and the addresses referred into Camden services for DVA, from CSSW, CSN and Landlords Work Portal.[154] There was found to be 11.8% of pupils living in addresses that had been linked DVA in either CSN or CSSW. This conclusion does not come without limitations; there is temporal discontinuation between the School Census, and the populations of CSC and CSN. Moreover, there are issues with address linkages, due to a lack of, or poor-quality addresses provided from all data sources.
| Unique count of Person IDs for all Children | |||
|---|---|---|---|
| Assessment Type | Total | VAWG | Percent |
| Child and family assessment (CSSW) | 1,894 | 1,231 | 65.0% |
| Early Help Family Assessment (EH) | 698 | 135 | 19.3% |
| MASH contact and referral (CSSW) | 6,011 | 2,173 | 36.2% |
| Total | 6,292 | 2,509 | 39.9% |
| Unique count of Workflow IDs for all Children | |||
|---|---|---|---|
| Assessment Type | Total | VAWG | Percent |
| Child and family assessment (CSSW) | 2,030 | 1,301 | 64.1% |
| Early Help Family Assessment (EH) | 706 | 135 | 19.1% |
| MASH contact and referral (CSSW) | 8,297 | 2,467 | 29.7% |
| Total | 8,780 | 2,902 | 33.1% |
| Unique count of Combination of Workflow and Person IDs for all Children | |||
|---|---|---|---|
| Assessment Type | Total | VAWG | Percent |
| Child and family assessment (CSSW) | 1,136 | 686 | 60.4% |
| Early Help Family Assessment (EH) | 393 | 79 | 20.1% |
| MASH contact and referral (CSSW) | 4,761 | 1,368 | 28.7% |
| Total | 5,026 | 1,598 | 31.8% |
| Unique count of Person IDs | |||
|---|---|---|---|
| Assessment Type | Total Girls and Young People | VAWG Person | Percent |
| Child and family assessment (CSSW) | 919 | 605 | 65.8% |
| Early Help Family Assessment (EH) | 336 | 66 | 19.6% |
| MASH contact and referral (CSSW) | 2,790 | 1,041 | 37.3% |
| Total | 2,927 | 1,207 | 41.2% |
| Unique count of Workflow IDs | |||
|---|---|---|---|
| Assessment Type | Total Girls and Young Women | VAWG | Percentage |
| Child and family assessment (CSSW) | 725 | 466 | 64.28 |
| Early Help Family Assessment (EH) | 252 | 52 | 20.63 |
| MASH contact and referral (CSSW) | 2878 | 880 | 30.58 |
| Total | 3,037 | 1,035 | 34.1% |
| Unique count of Combination of Workflow and Person IDs for Girls and Young Women | |||
|---|---|---|---|
| Assessment Type | Total for Girls and Young Women | VAWG | Percentage |
| Child and family assessment (CSSW) | 973 | 634 | 65.16 |
| Early Help Family Assessment (EH) | 338 | 66 | 19.53 |
| MASH contact and referral (CSSW) | 3803 | 1188 | 31.24 |
| Total | 4,020 | 1,396 | 34.7% |
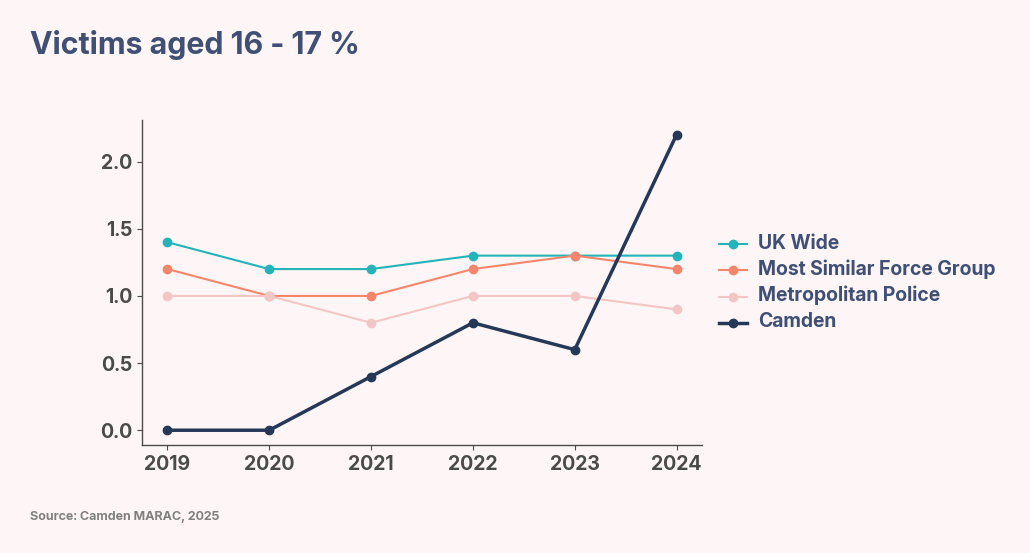
Figure 28: Bar graph showing the distribution of VAWG abuse types, based on all recorded cases in the MASH contact and referral stage in 2024. Each case may involve multiple types of abuse.
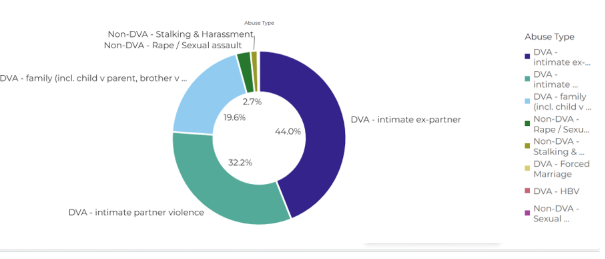
Figure 29: Bar graph showing the distribution of VAWG abuse types, based on all recorded cases in the CSSW assessment stage. Each case may involve multiple types of abuse.
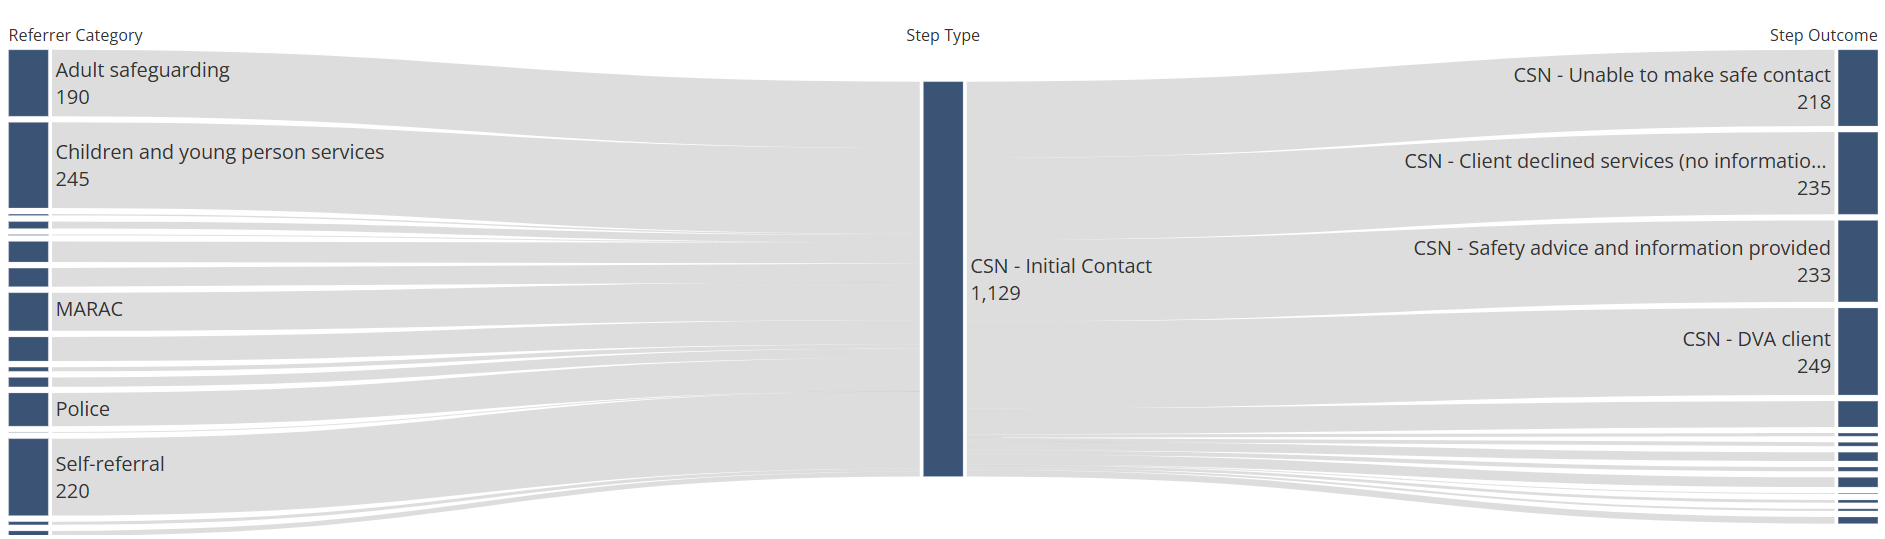
Figure 30: Bar graph showing the distribution of VAWG abuse types, based on all recorded cases in the EH assessment stage. Each case may involve multiple types of abuse.
Housing
DVA is intertwined with housing, being a significant contributor and consequence of homelessness among women.[155] Within Camden, there are three key housing pathways; application to join the housing register made under Part 6, Housing Act 1996, a homeless application made under part 7 of the Housing Act 1996, or via a non-statutory pathway, such as Camden’s Adult Pathway which includes refuge provision.
Housing register applications
For the first of these, applying to the housing register, in 2024, from the 592 applications 26.68% of applicants have received points for DVA. This has increased over time, as in 2019, 11.37% of applicants received DVA points, which rose steadily to 28.15% in 2023.
Homelessness applications
The identification of DVA within homelessness applications has widened; formerly DVA was only identified when recorded as the main reason for loss of last settled address. Now, DVA can also be identified in the support needs, if they are a victim/survivor of DVA or if they have already engaged with support. Since widening the identification of DVA, there have been 42.37% further cases identified since 2024.
In 2024, with the original identification method, around one in eleven cases had DVA as the main reason for application. However, using the new case flags, nearly one in five cases in 2025 are DVA-linked. Within 2024, there were around 2,400 total homeless applications, with 859 of these from women. From these, 8.2% were listed as a DVA victim/survivor as the main reason for loss of last settled address. 21.7% had experienced or was at risk of DVA and 27.6% had DVA involved in their case.
With the new flag, 252 of 859 of women had a DVA flag. From these, 60.0% had DVA as their main reason for loss of last settled address, followed by ‘Other’, or ‘family no longer willing or able to accommodate’ (11.6%, 11.2%) The majority, 60.8% were single people households, with the remainder being families with one or more children. Roughly 35% had one or more dependent children. 66.8% were already homeless.
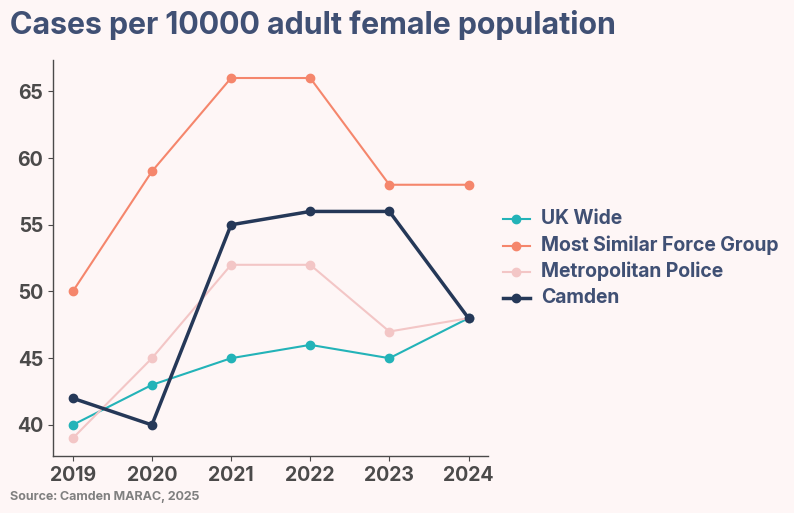
Figure 31: Line graph with proportional DVA flags for housing register applications since 2019
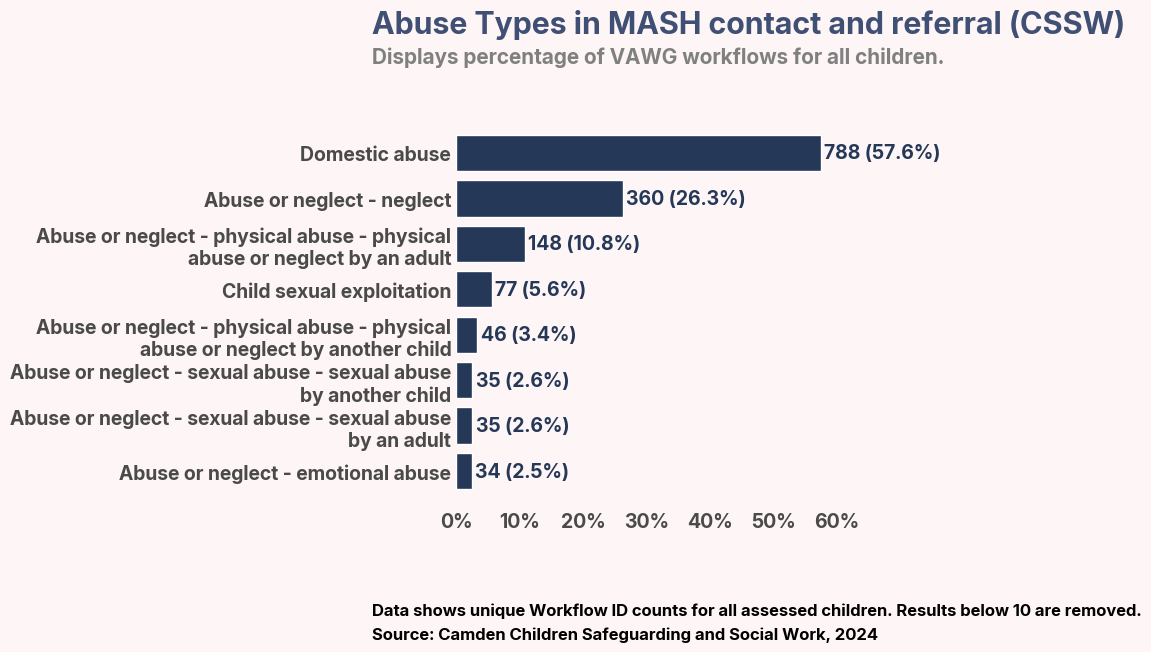
Figure 32: Line graph with proportional DVA flags for homeless applications since 2019
Current Camden Council tenants
Data about DVA is also collected in Landlords Work Portal, which is a system used by housing officers. Within this, they can flag if DVA is a presenting or contextual risk within a household. In 2024, there were 320 cases where DVA was a recorded concern, amounting to 1.65% of all cases in the system; from these, 140 were new cases. However, this system is primarily used to log various tenancy and housing management concerns, of which DVA is just one.
When looking at referrals made to other Camden services, analysis revealed that Camden Council tenants are not only more likely be referred for safeguarding support but are disproportionately likely to have a housing issue that constitutes a safeguarding concern. For example, analysis of CSSA and ASC data for financial year 2024/25 found that half (47.8%) of the families referred to CSSW that had a recorded housing issue were Camden Council tenants. One in four (23%) referrals to Camden’s EH team listed housing as a presenting issue; 46% of these were Camden tenants. 35% of people referred to CSN were Council tenants, yet only 5% of referrals came from Housing teams.
Moreover, in July 2025, cross-sectional research to understand the lived experiences of homeless women in Camden’s Adult Pathway. This work found that homeless women experience some of the highest levels of VAWG in Camden, yet the majority of survivors have never accessed specialist support. For example:
80% of women were currently experiencing VAWG or had done so in the last three years. An increase of 12% from when the research was last completed in 2022.
82% of women were reported to have experienced VAWG in their life, with this figure rising to 94% for women who were also currently experiencing VAWG.
52% were experiencing 5 or more types of abuse; a 17% increase from 2022. 34 women (28%) were experiencing more than 7 forms of abuse.
The research found that homeless and multiply disadvantaged are not accessing VAWG support:
Only 40 out of 125 women that have experienced VAWG in their lifetime have accessed specialist VAWG support, and the majority of women were not accessing ongoing support.
Of these women, 18 (14%) had accessed support from a specialist VAWG and multiple-disadvantage team, 11 (8%) had accessed support from CSN.
Victim/survivors working VAWG and multiple disadvantage teams, such as the DVA Navigators, experienced the highest prevalence against multiple abuse categories: experiencing on average 7.1 types of abuse.
External services
Victim Support, Mayors Office of Policing and Crime
MOPAC’s Victim Support provides specialist support for victim/survivors of DVA and provide quarterly updates on a borough level.[157] It should be noted that the aggregate data refers to all crimes supported and isn’t distinguished between those within the VAWG categorisation.
In the financial year 24/25, Victim Support data, there were 533 cases from Camden, equating to a rate of 4.5 per 1,000 female residents. The predominance of cases come from Police, sitting at 82.2%. This is then followed by other agencies, at 9.6% and the remainder being self-referrals, and colocations in hospitals. The most common crime category is ‘Violence without Injury’, with 186 cases amounting to 34.9%. This is then followed by ‘Stalking and Harassment’ at 21.0% and ‘Other Crime’, comprising 13.1% of cases.
When looking at demographics of victim/survivors supported, the majority are younger, with 29.3% in aged between 25 to 34. Only 3.00% are listed as disabled. Ethnicity has high levels of non-disclosure, at 70.5%, followed by ‘Other’ ethnicities, White and Asian (17.5%, 5.1% and 2.8% respectively). Victim/survivors are primarily female, making up 74.1% of cases. Religion also has high levels of non-recording, as does sexual orientation.
When looking at differences between Camden and the rest of London, in the first quarter of the fiscal 24/25 year, a greater proportion of cases in Camden were reported by the police than in the rest of London (70.6%, 60.6% respectively). Camden also had higher incidences of crimes classified as ‘Violence without Injury’, at 54.1% of cases. This is 43.9% for the rest of London. When looking at demographics of victim/survivors, Camden has increased representation of victim/survivors with from other ethnic groups (8.9%, compared to 4.3%). The proportion of Muslim individuals was notably higher in Camden (7.5%, 2.8%), as was the proportion of individuals identifying as lesbian (2.1%, 0.2%). All these differences are statistically significant.
Future demand
As the MPS dataset is rich, it is possible to use statistical modelling to estimate future changes in VAWG offences. It should be noted that the model was built on data from 2020 to March of 2024, as this is before the CONNECT system was introduced. This model also took COVID-19 lockdowns into account.
The forecasting model worked well across all London boroughs, with small average errors and a good overall fit. For Camden, the model was slightly more accurate and closely matched the real data. When looking to the future, the model predicts that the rate of VAWG in Camden could rise by about 7.8% between February 2024 and December 2028, going from 2.78 to 2.99 incidents per 1,000 female residents. However, there’s some uncertainty: the real change could be a small decrease of 2.9% or a larger increase of up to 17.3%, indicating considerable uncertainty around the direction and magnitude of change. While the projection suggests a modest upward trend, the wide confidence bounds reflect that VAWG rates could remain stable or even decline. These results should be interpreted cautiously, as many external factors can influence observed rates.
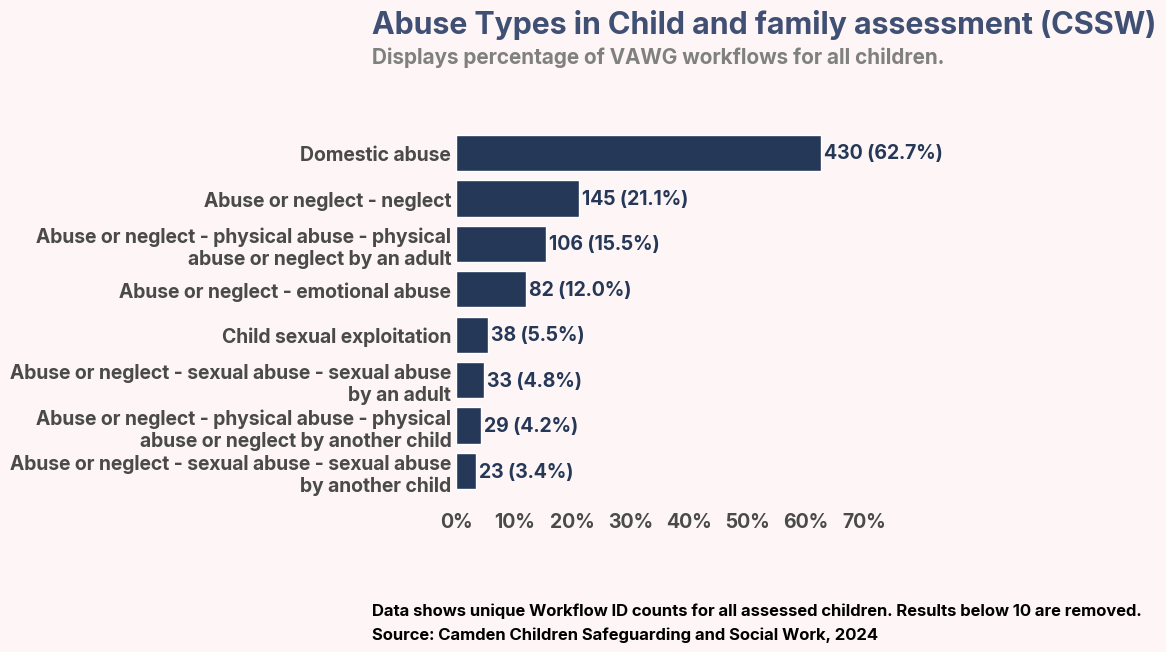
Figure 33: Forecasted VAWG rate per 1,000 female residents by borough
Outcomes
The MPS mark a positive result if there is a criminal justice outcome, including formal charges, cautions, community resolutions, and penalties.
Across London, MPS are taking steps to better outcomes for victims of VAWG. In the previous 12 months, they published figures that the number or rape charges have increased from 665 to 780, raising the positive outcome rate from 7.4% to 7.9%. For DVA, there were 4,360 more positive outcomes, though the overall rate slightly declined from 9.2% to 8.5%. In total, the MPS recorded 6,002 new positive outcomes across all VAWG offence types, but the year-on-year outcome rate has decreased.[158] Conversely, The Times reported in 2025 that just four of ten crimes in London are reported to police, and for those that make a report, four of ten victim/survivors go on to withdraw from the justice process.[159] This increases for victim/survivors of DVA, with six out of ten withdrawing, and for rape offences related to DVA the withdraw rate rose to 74%.
Looking at 2024 data for Camden, there is a positive outcome rate for VAWG crimes with a known outcome of 7.8%. This figure ranks Camden 7th highest out of all London boroughs. Across London, the positive outcome rate is 7.2%. There is no statistically significant difference between the positive rate in Camden when compared to the rest of London (Figure 34).
The positive outcome rate in Camden is above average when compared to the rest of London Boroughs for sexual violence, DVA, violent or threatening behaviour, honour based violence, stalking and harassment and physical and sexual abuse. However, no one of these are statistically significant.
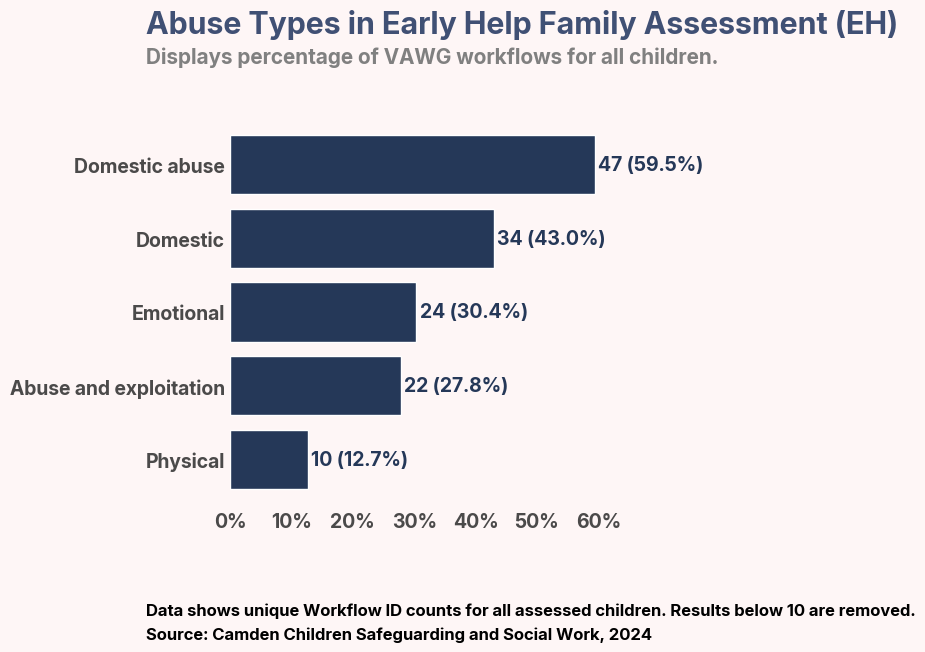
Figure 34: Bar graph comparing the positive outcome rate for Camden to London in 2024
Across London, over 2020 to 2024, only one in ten cases of DVA had a positive outcome.[160] When compared to all VAWG offences within Camden, there is a slightly higher significant odds of a positive outcomes for DVA (two times) and sexual violence (three times), and lower odds for stalking and harassment - the odds of a positive outcome were less than half those of cases without this flag (odds ratio = 0.5). These are the same trends seen across London.
Looking within the positive outcomes, which are minute in comparison to negative outcomes, the most common is charged, making up 74.9% of positive outcomes, but equating to just 155 in raw counts. This is followed by charged under alternate offence. This is the same distribution across different VAWG offences.
From the 2,616 VAWG offences within Camden in 2024 with no positive outcome, the most common category was the victim/survivor withdrawing support, despite a name suspect being identified (37.2%). This figure amounts to around four in ten victim/survivors withdrawing support, in line with figures reported by the Times. This outcome was followed by no suspect identified, at 34.4% of cases. This is followed by evidential difficulties despite victim/survivor cooperation at 15.5% of cases. For DVA, the rate of withdrawal increases to 68.4%, and to 62.2% in controlling or coercive behaviour cases. For sexual violence, stalking and harassment, physical or sexual abuse, violence or threatening behaviour the most common reason is no suspect identified.
Summary of quantitative data findings
This section used quantitative data to build a picture of VAWG in Camden, focusing on prevalence, victim/survivor and suspect characteristics, service demand, and outcomes. The findings are summarised below.
Scale and trends
Between 2020 to 2024, Camden recorded 18,856 VAWG related offences, amounting to a rate of 29.05 per 1,000 female residents in 2024. This is significantly above the London rate, which is 26.50 per 1,000, making Camden’s rate 9.8% higher. This finding applies to most VAWG abuse types.
From 2020 to 2023, offences rose by 8.2%, compared with a 6.4% rise across London.
Recorded offences fell in 2024 compared to previous years, likely linked to the introduction of the CONNECT system. However, within 2024, offences rose steadily from March to December.
The prevalence of VAWG within Camden places 11th highest across London boroughs.
VAWG abuses
The most common VAWG crimes recorded in 2024 were DVA, stalking and harassment, and sexual violence.
Camden’s rates of sexual violence, stalking and harassment, physical or sexual abuse and violent or threatening behaviour were all significantly higher than London.
Camden ranks 2nd highest in London for sexual violence and 5th for stalking and harassment.
Controlling or coercive behaviour has doubled as a share of violent offences since 2019.
Economic abuse is poorly captured in police data but appears in up to 14.6% of ASC safeguarding cases.
Psychological or emotional abuse has declined in ASC data, despite national evidence of high prevalence.
Geographical variation
Camden Town is a key hotspot for VAWG, ranking among the highest across London for overall VAWG, sexual violence, stalking and harassment, physical or sexual abuse, violent or threatening behaviour, and controlling or coercive behaviour.
Other wards also stand out – Kilburn (domestic violence/abuse, 3rd for stalking), Regent’s Park (sexual exploitation and coercive control), Holborn and Covent Garden (sexual violence), and Camden borough overall (4th for stalking and harassment).
South Camden forms a cluster of high-risk wards, showing concentrated need.
When looking at the relationship between deprivation and VAWG offences, the correlation strength for Camden wards more than doubled when compared to all other London wards.
Demographics of victim/survivors
Women in their 30s and 40s are most likely to report offences to police or access Camden Safety Net. It is unclear whether this reflects higher prevalence in these groups or unmet need among younger and older women.
Younger women (18 to 24 years old) are the single largest victim/survivor group in Camden, especially for sexual offences, yet they are less likely to progress through referral pathways in CSN.
Black and racially minoritised women are consistently overrepresented across police, MARAC, and service datasets, pointing to disproportionate risk and/or targeted need.
Disabled women are under-recorded in services but more likely to be referred for intimate partner abuse, but poor data masks the true scale of need.
Pregnancy and children feature heavily in cases (7% pregnant; one-third with children), and these cases are more likely to escalate to safety planning, showing heightened risk.
High unemployment among victim/survivors in Camden Safety Net (between 30–36%) highlights links between economic disadvantage and VAWG vulnerability.
Building profiles of victim/survivors and suspects using crime and service data was challenging due to a lack of completeness of data. Improving data on key protected characteristics and risk factors including ethnicity and disability are essential to identify and address unmet need.
Service demand
Across CSSW and EH, two in five workflows for girls related to VAWG, making up one in five of all workflows across the services.
When looking at all children, a third of workflows are linked to a VAWG abuse type.
One in six referrals are for DVA between parents.
Re-referral rates for VAWG are lower than for other case types, suggesting intervention may be working, but also that some cases may not re-enter when needed.
Referrals from the police to Camden Safety Net have fallen since GDPR restrictions, potentially preventing some women from receiving support. Despite this, the service continues to operate at capacity.
Within CSN, whilst 85% of cases are for DVA, only one in five referrals progress to case work. This can be due to several reasons, such as risk threshold or if a victim is ready to accept support.
DVA is increasingly driving homelessness demand: DVA-related housing register points awarded have risen from 11% (2019) to 27% (2024).
One in five homelessness applications by women now include DVA as a factor.
38% of safeguarding cases for women involve VAWG - mainly DVA and economic abuse.
Although ASC Safeguarding engages with older women victims of VAWG, case progression is low, with only one in four cases moving forward. For those that have no further action, around half are signposted to another service. As a result, a large proportion of this vulnerable population could be receiving little or no further support
Camden’s MARAC caseload is higher than national averages, stable over time, with a growing proportion of cases involving children (44.5% in 2024).
Outcomes
In 2024, only 7.8% of crimes had a positive outcome (including formal charges, cautions, community resolutions or penalties).
Victim/survivor withdrawal is the single biggest barrier: in Camden, 37% of all VAWG cases with no positive outcome ended because victim/survivors withdrew support despite a named suspect (4 in 10 cases).
This rises to 68% in DVA cases and 62% in coercive control cases.
No suspect identified accounts for a further 34% of negative outcomes.
Stalking and harassment cases are especially unlikely to reach positive outcomes (odds of success less than half that of other VAWG cases).