Analysis
Talk based methods
There are different approaches to analysing qualitative data. This chapter will not provide in-depth information on every approach but will provide an overview of common analytical approaches used in a public health context.
Preparing your data for analysis
There are various tasks you’ll need to do before you are ready to begin analysing your data. This stage is often underestimated, but decisions made here shape how easy (or difficult) the analysis will be.
Transcribing your interviews or focus groups
Most of the time, qualitative analysis uses transcripts rather than the original audio or video recording of an interview or focus group. Transcripts allow you to work systematically with the data, share it with colleagues, and clearly reference evidence (e.g., specific quotes) when you’re developing findings.
In some cases (e.g., rapid or exploratory work) you might choose to analyse directly from recordings using structured notes or summaries.
Not all projects require the same level of transcription detail. You may choose:
Verbatim transcription, capturing every word spoken
Cleaned or intelligent verbatim, removing filler words while retaining meaning
Summary-based transcription, used in rapid approaches
Transcribing focus group data will typically take longer than transcribing interview data, due to more participants and overlapping speech. Other factors like the quality of the recording, speech characteristics (e.g., accents, speed, volume) and the type of content can also have a big impact on how long it will take you to transcribe (learn more about time and resource planning).
You might choose to use an external transcription service or an automated software to transcribe your data, if you are doing this:
Ensure all confidentiality and data protection requirements are met
Factor in time for checking and correcting transcripts (there will be errors especially with acronyms, or technical language)
Be aware that automated transcription can struggle with group discussions and accents
Learn more about the tools and software available.
Familiarise yourself with your data
Familiarisation is a foundational step in qualitative analysis. It involves immersing yourself in the data so that you understand both the content and the context of what participants have shared.
The process of transcription can be a great way to familiarise yourself with the data. This stage might also include:
Reading transcripts multiple times
Listening back to recordings
Writing brief reflections and reading back through notes/memos
Noting early patterns, contradictions, or surprising findings
This stage is not about finalising themes or producing an output, but about getting to know the dataset as a whole.
Organising and managing your data
Organising your data at the outset will make analysis far more manageable, especially if you are doing a large number of interviews/focus groups or analysing with others in a team.
A few things to consider when organising your data:
Using clear and consistent file naming (e.g., date, method, participant group, version)
Storing transcripts, audio files, consent forms, and analysis files separately
Keeping a simple log that tracks what has been collected, transcribed, and analysed
Choosing where and how you will analyse your data
Decide early on how and where analysis will take place. This includes:
Whether you’ll do your analysis individually or collaboratively
Whether you will code manually (e.g., using Word, Adobe, or Excel) or use a specialist qualitative analysis software (e.g., NVivo)
How files and versions will be shared and updated
The choice of software or tools should be guided by the size of your dataset, you (or your team’s) experience and confidence with specific tools, the availability of specialist software and the time you have available.
Key analytical approaches
There is no single correct way to analyse qualitative data. The approach you pick will depend on:
Your research questions and objectives
The size and nature of your dataset
Time, skills, and resources available
How your findings will be used (e.g., to inform service improvement, develop a strategy, policy advice)
Below are some approaches commonly used in public health research and evaluation.
Thematic analysis (TA)
Thematic analysis is one of the most widely used approaches for analysing data from interviews and focus groups. It focuses on identifying, analysing, and interpreting patterns of meaning (themes) across a dataset.
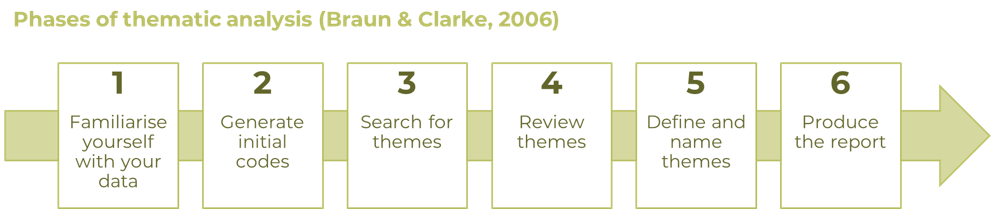
Themes can be identified in a data-driven, inductive way, from the data itself. Alternatively, they can be identified in a more deductive way, where you use the data to explore an existing theory.
Braun and Clarke’s1 approach to TA involves working systematically through six key phases and is key reading
Content analysis
Content analysis is a structured approach to analysing qualitative data that focuses on systematically categorising and summarising what has been said2. It is particularly useful when you want to describe patterns across a dataset, compare responses between groups, or answer clearly defined questions.
This approach can be thought of as a “count” of the instances of a theme’s occurrence3. The emphasis is on what is mentioned and how often, rather than how meanings are constructed (as in TA above).
In public health, content analysis can be used for:
Service evaluations and feedback
Consultation responses
Interviews linked to specific outcomes or indicators
Work where transparency and consistency are priorities
Content analysis can be deductive (using predefined categories) or inductive (developing categories from the data) but it usually involves less interpretation than thematic analysis.
Rather than generating lots of detailed codes, content analysis involves:
Identifying categories relevant to your research questions
Assigning sections of data to those categories
Summarising what participants say within each category
Comparing patterns across participants or groups
Using content analysis, after you have coded your data you might:
Count how many participants mentioned a particular factor as a barrier
Compare whether an issue or idea was raised more often by certain groups than others
Summarise common suggestions for improvement across interviews.
Framework analysis
Framework analysis is a systematic, matrix-based approach to analysing qualitative data4. This approach can be thought of as a combination of thematic and content analysis. Framework analysis is especially useful when:
Working with large volumes of qualitative data
Analysing data as part of a team
Needing to compare findings across groups, services, or time periods
Producing outputs that must link clearly to policy questions, outcomes, or recommendations
Because of how structured this approach is, it can also be helpful for those newer to qualitative analysis, as it provides clear stages whilst still allowing flexibility.
At the core of framework analysis is the development of a thematic framework - a structured set of themes and sub-themes that reflect:
The aims and objectives of your research
The issues that emerge from the data
The framework is used to organise and summarise data in a way that allows systematic comparison whilst linking back to participants’ original words (e.g., through quotes or phrases from transcripts).
The original approach comprises 5 key stages, while subsequent literature (e.g., Gale et al.) expands it into 7 stages by separating data preparation and initial coding.
There are seven stages to framework analysis:
Transcription
Familiarisation (with the interview)
Coding
Developing a working analytical framework
Applying the analytical framework
Charting5 data into the framework matrix
Interpreting the data
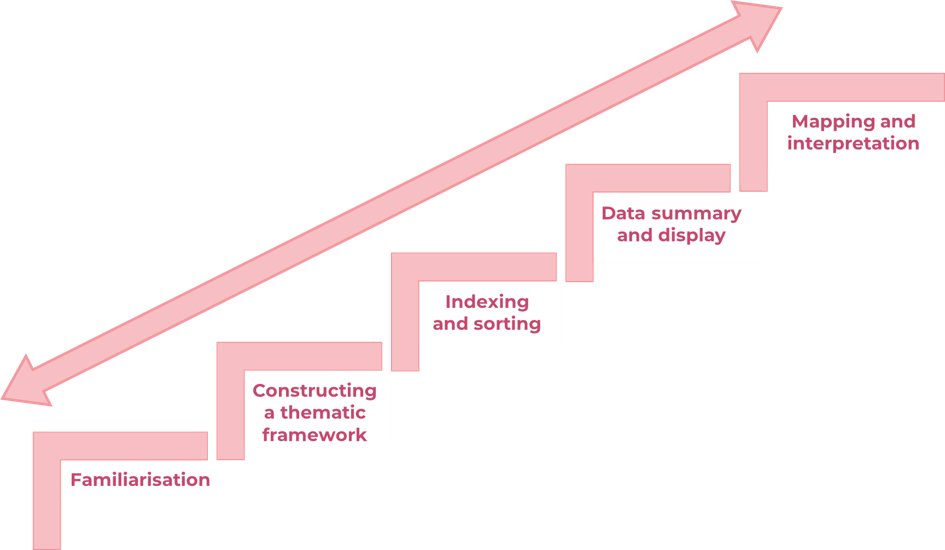
Framework analysis is an iterative approach. Analysts often move backwards and forwards between the different stages as their understanding develops. This process sometimes described as moving up and down the “ladder” of analysis.
Framework analysis does not require any special software. It can be successfully carried out using Excel to build a matrix, with:
Rows representing cases (e.g., interview participants)
Columns representing themes or sub-themes
Cells containing summarised data or key points
Once your matrix is complete, the final stage (mapping and interpretation) involves:
Reviewing the matrices as a whole unit
Exploring relationships between themes and identifying patterns
Linking findings back to your research questions
Coding your data
Coding is the process of systematically identifying and labelling features of your data that are relevant to your research question. It is a core analytical step across most qualitative approaches, but the way codes are developed, applied, and used will vary depending on the approach you are taking.
A code is a word or phrase that captures what a section of text is about or what it represents. By linking sections of data to codes, you can begin to build an overall picture of what was said about a particular topic across your whole dataset and identify patterns, connections, and differences.
Codes act as building blocks: they help you organise large volumes of text so that structure and meaning can be identified and interrogated across your data as a whole.
A code usually captures one idea or concept. It can be applied to a few words, a sentence, or a longer section of text.
Depending on the approach you are taking, coding can be:
Data-driven (inductive) where codes emerge from the data itself, without being predetermined
Theory-driven or framework-driven (deductive) where codes are developed in advance based on an existing framework, theory, or set of research questions, and applied to the data systematically
A combination of both where a predefined structure is used, but there is flexibility for codes to emerge from the data that were not anticipated at the start
Across all approaches, coding is typically iterative rather than fixed. Codes may be refined, merged, or split as you make your way through the dataset.
What a code is not
A code is not:
A full interpretation or explanation of your data
So broad that it loses meaning (e.g., ‘barriers to access’)
Just a keyword pulled out of context
Something that has to appear frequently to be important
A finished analytical output - codes are a step towards analysis, not the end point
From coding to analysis
Codes are not your final output. Throughout the analysis phase, you will generate codes across your dataset, refine them, and begin to look for patterns and relationships between them.
What you do next will depend on your analytical approach. In thematic analysis, for example, codes are grouped into candidate themes; in framework analysis, they are organised within a matrix structure to enable systematic comparison. In all cases, the process of coding prepares your data for the deeper analytical work that follows.
For example, codes such as appointments clash with work, long waiting times, and lack of flexibility might contribute to a broader theme like ‘structural barriers to access’.
Top tips for good quality analysis
Stay close to your data
It can be tempting to make conclusions quickly, but good analysis requires repeated engagement with your transcripts or memos. Read the data in full before you begin coding and return to it regularly as your analysis develops. Patterns that aren’t obvious on first read can become clearer over time.
Differentiate between description and interpretation
A common mistake in qualitative analysis is summarising what participants have said without explaining what it means. Good analysis asks not just what was said, but why, how, and what does this tell us in relation to our wider research question.
Actively look for differences and contradictions in your data
Strong analysis does not only identify patterns, but it also attends to variation, outliers, and cases that do not fit neatly. Data that complicates your emerging picture is analytically valuable, not inconvenient.
Document your thinking and decisions
Keep an analytical memo6 as you work. It is best practice to record why you made particular coding decisions, where you were uncertain, and how your thinking changed.
Don’t work in isolation
Where possible, involve a colleague in sense-checking your analysis. This might be through a formal QA process, peer or double-coding, or simply talking through your emerging findings. A second perspective can surface blind spots and strengthen your confidence in the analysis.
Use quotes to anchor your analysis
Quotes from participants are not just illustrative, they are evidence to support your themes or categories. When developing themes, make sure you can point to specific pieces of data that supports them, and be honest about where the data is more ambiguous or mixed.
Reflect on your own position
Your own background, assumptions, and prior knowledge will shape how you read and interpret data. This is unavoidable, but being explicit about it, at least in your analytical notes, is part of responsible and ethical qualitative analysis.
Footnotes
Braun, V. and Clarke, V., 2006. Using thematic analysis in psychology. Qualitative research in psychology, 3(2), pp.77-101. Available from: Using thematic analysis in psychology: Qualitative Research in Psychology: Vol 3, No 2↩︎
Weber, R.P., 1990. Basic content analysis (Vol. 49). Sage.↩︎
Braun, V and Clarke, V. (2022) Successful qualitative research: A practical guide for beginners. Los Angeles: SAGE. Available from: Braun & Clarke Textbook↩︎
Gale, N.K., Heath, G., Cameron, E., Rashid, S. and Redwood, S., 2013. Using the framework method for the analysis of qualitative data in multi-disciplinary health research. BMC medical research methodology, 13(1), p.117. Available from: ttps://link.springer.com/content/pdf/10.1186/1471-2288-13-117.pdf
Hackett, A. and Strickland, K., 2018. Using the framework approach to analyse qualitative data: a worked example. Nurse researcher, 26(2). Available from: Using the framework approach to analyse qualitative data: a worked example↩︎
Charting refers to the process of summarising and organising data into a matrix, typically a table with participants or data sources as rows and themes or analytical categories as columns.↩︎
An analytical memo is an informal written note made during the analysis process to record your thinking. Memos don’t need to be formal or polished, their purpose is to capture your reasoning as it develops, so that your analytical decisions are documented and can be revisited or shared with colleagues.↩︎